1, wherein
Prometheus main features are:
A multidimensional data model, wherein the data comprises a sequence identified by time metric name and key / value
PromQL, one kind of flexible query language , you can use this dimension
It does not depend on the distributed storage; single server node is autonomous
Collecting time-series by the HTTP pull model
Gateway support via an intermediate push time series
Static configuration or through service discovery to find the target
A variety of graphics and dashboards support mode
2, components
Prometheus ecosystem comprising a plurality of components, many of which are optional:
Prometheus master server , it will be scraped off and stored time-series data
The client library for detecting the application code
A short-term support for the work of Push Gateway
Such as a dedicated HAProxy, StatsD, Graphite and other services exporters
A alertmanager handle alerts
Various support tools
Most components are used Prometheus Go written, it is easy to build and deploy static binaries.
3, architecture
The following diagram illustrates the architecture of ecosystem and certain components of Prometheus:

Grafana or other user API can be used to visualize the collected data.
4, installation
Premise requires helm environment:

helm install prometheus stable/prometheus
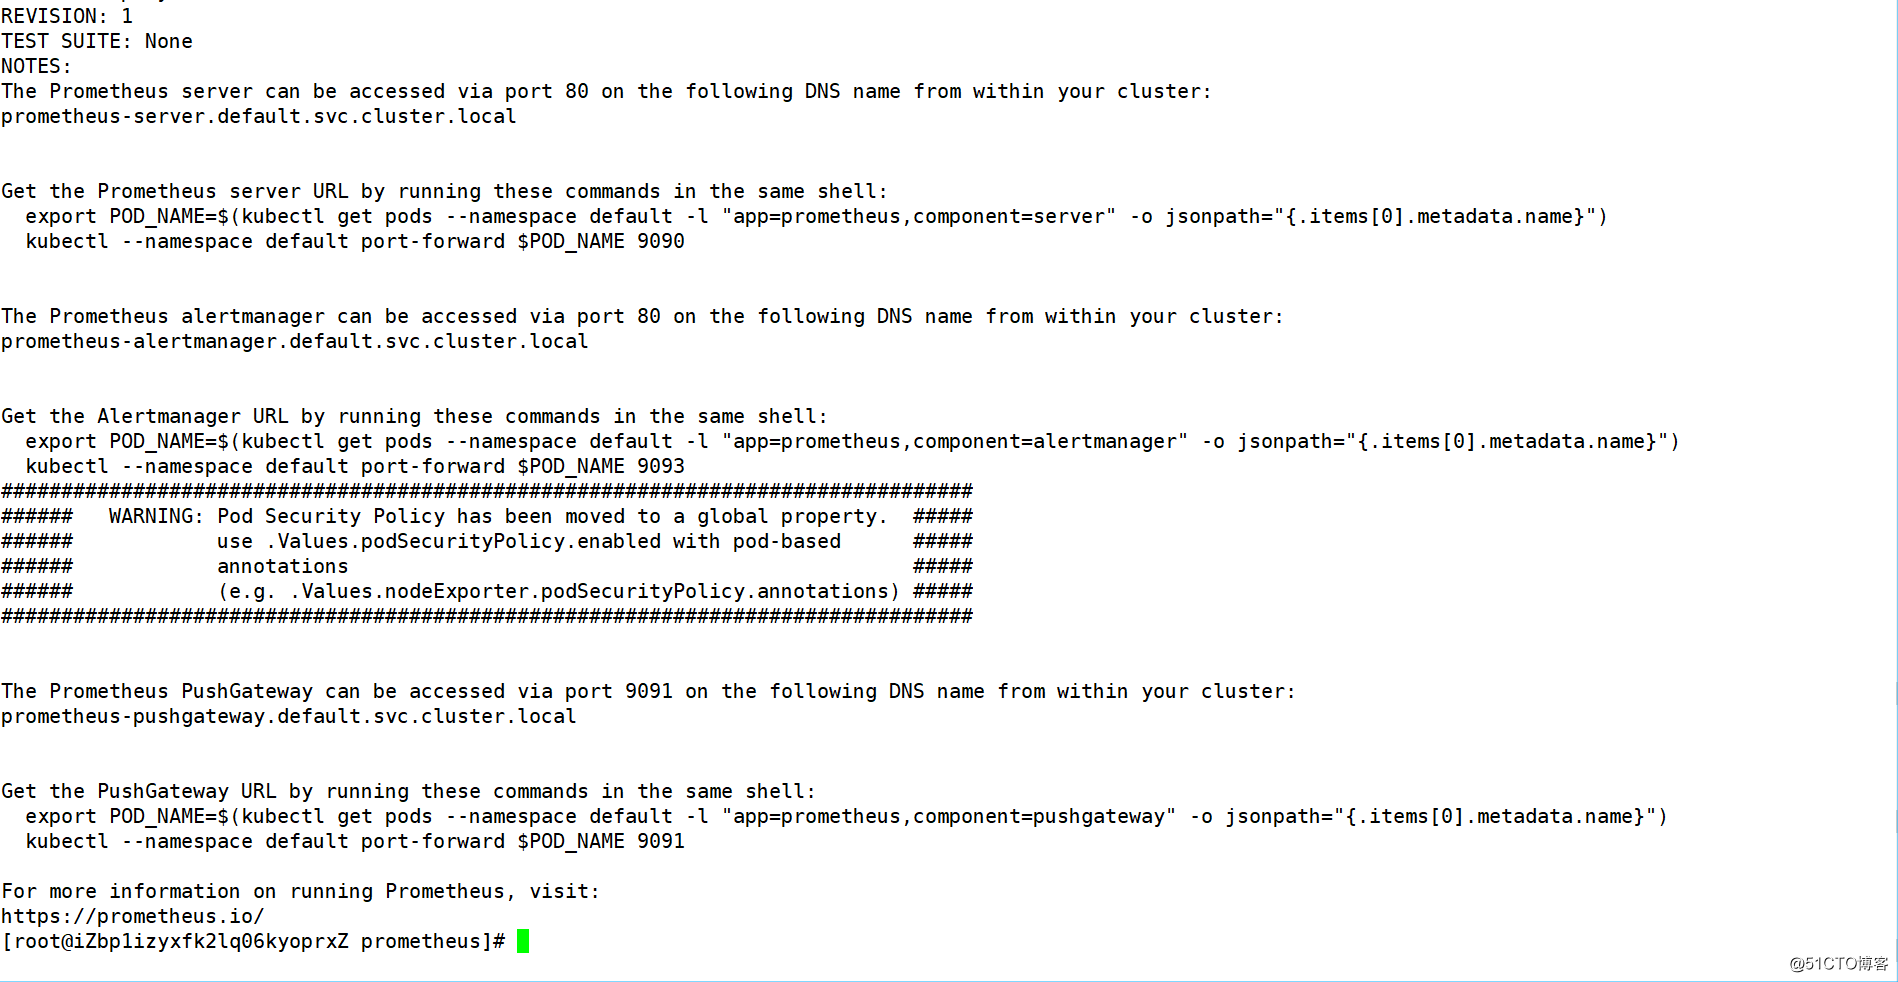
安装成功,查看pod状态会发现有两个处于pending状态,是因为需要请求pv

这里使用hostPath来创建pv
apiVersion: v1
kind: PersistentVolume
metadata:
  name: prometheus-pv1
spec:
  capacity:
    storage: 2Gi
  volumeMode: Filesystem
  accessModes:
  -  ReadWriteOnce
  persistentVolumeReclaimPolicy: Retain
  hostPath:
    path: /app/prometheus/pv1

查看pod状态会发现有个pod会报错,并查看日志是报错是容器名不同

真正的原因是因为使用的hoatPath,pvc请求的权限不够,到worker节点给对应的hostpath加777的权限即可,这是我通过rancher查看到的报错
msg="Error opening query log file" file=/data/queries.active err="open /data/queries.active: permission denied"
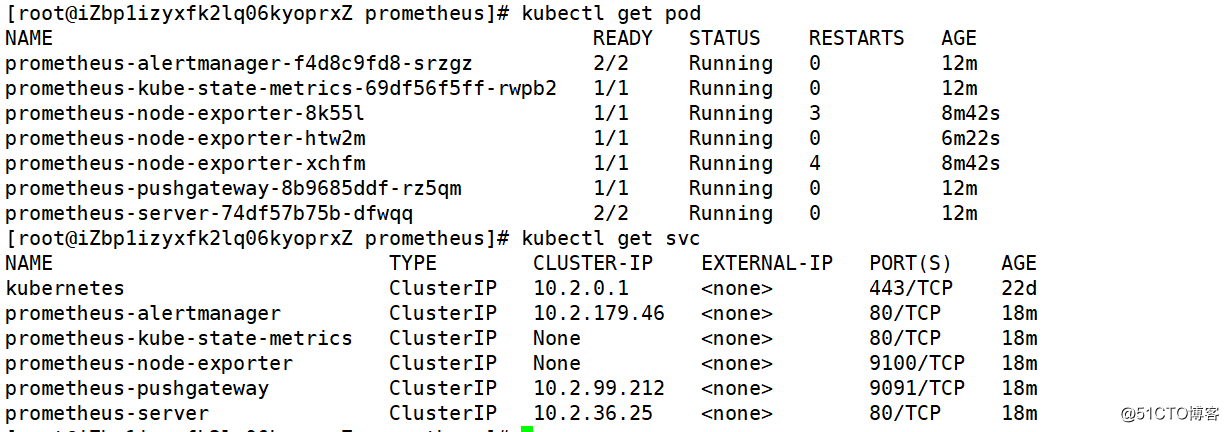
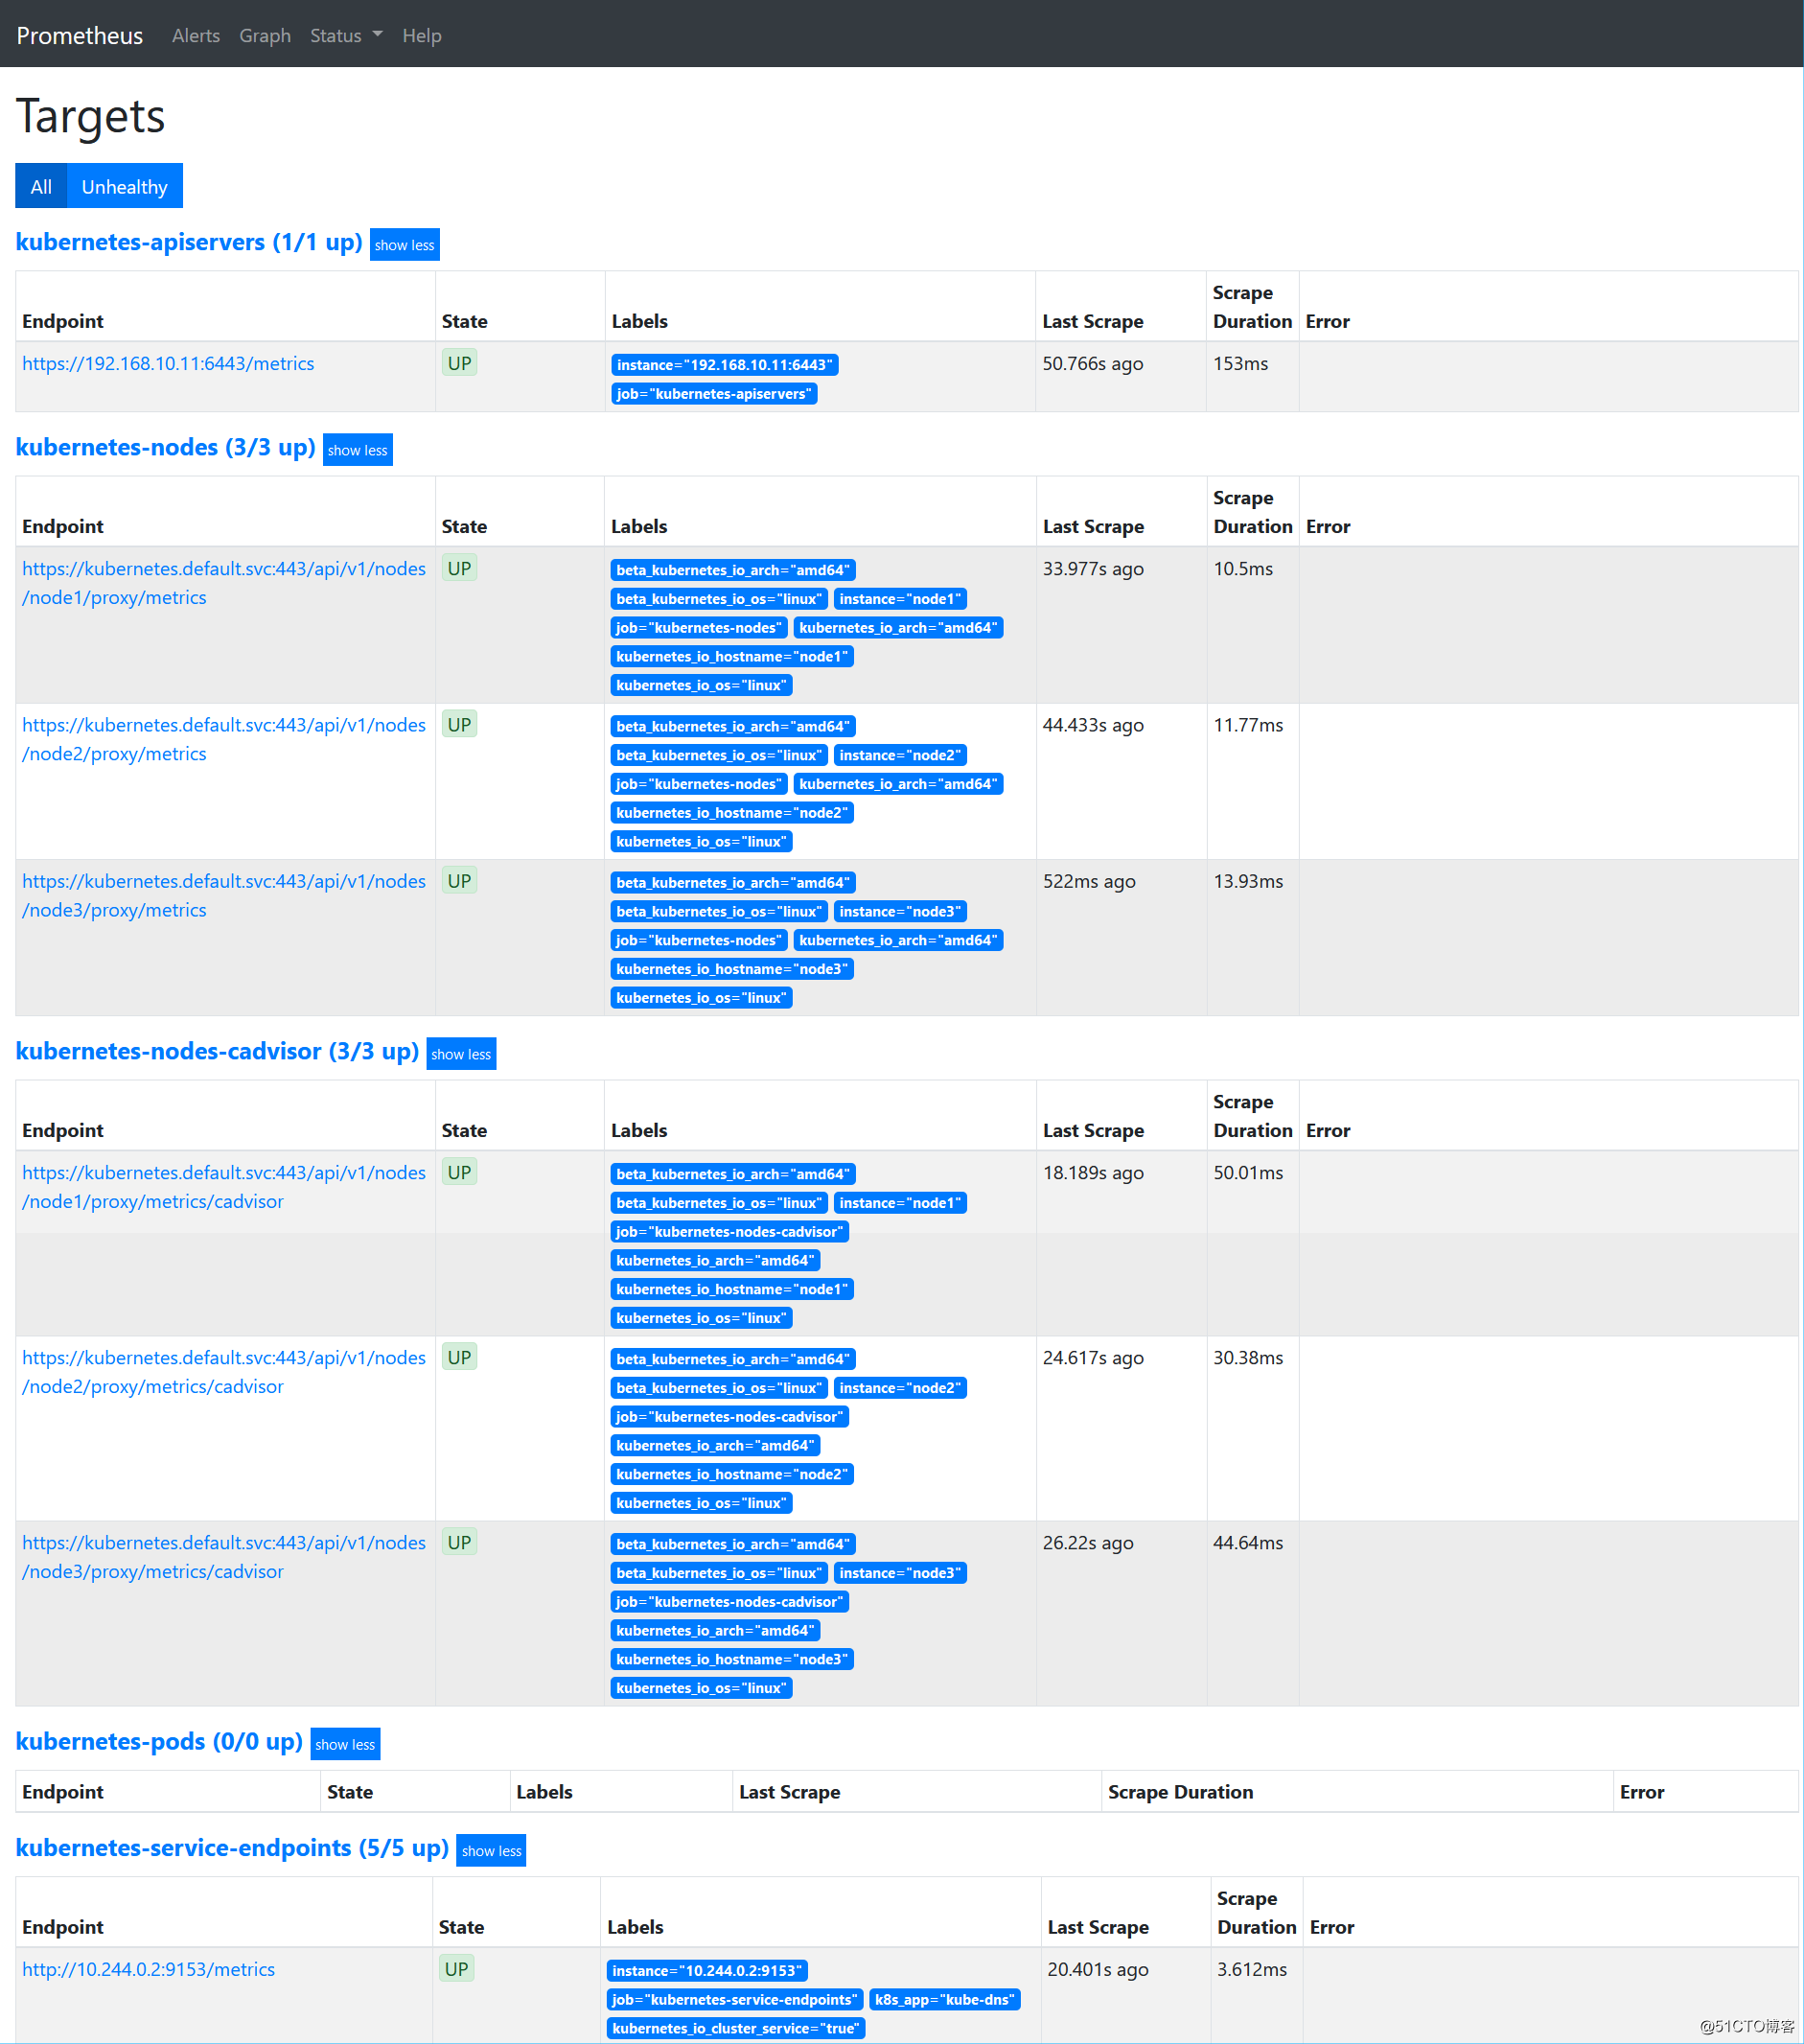
这里还需要修改Prometheus-server的Port类型为NodePort。
helm pull stable/grafana
tar xvf grafana-4.2.2.tgz
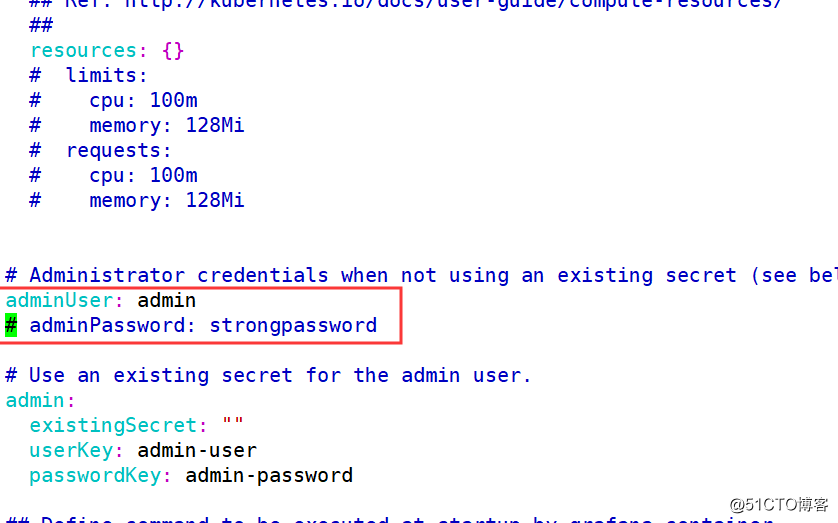
vim grafana/values.yaml #设置admin的密码为admin123
helm install grafana ./grafana
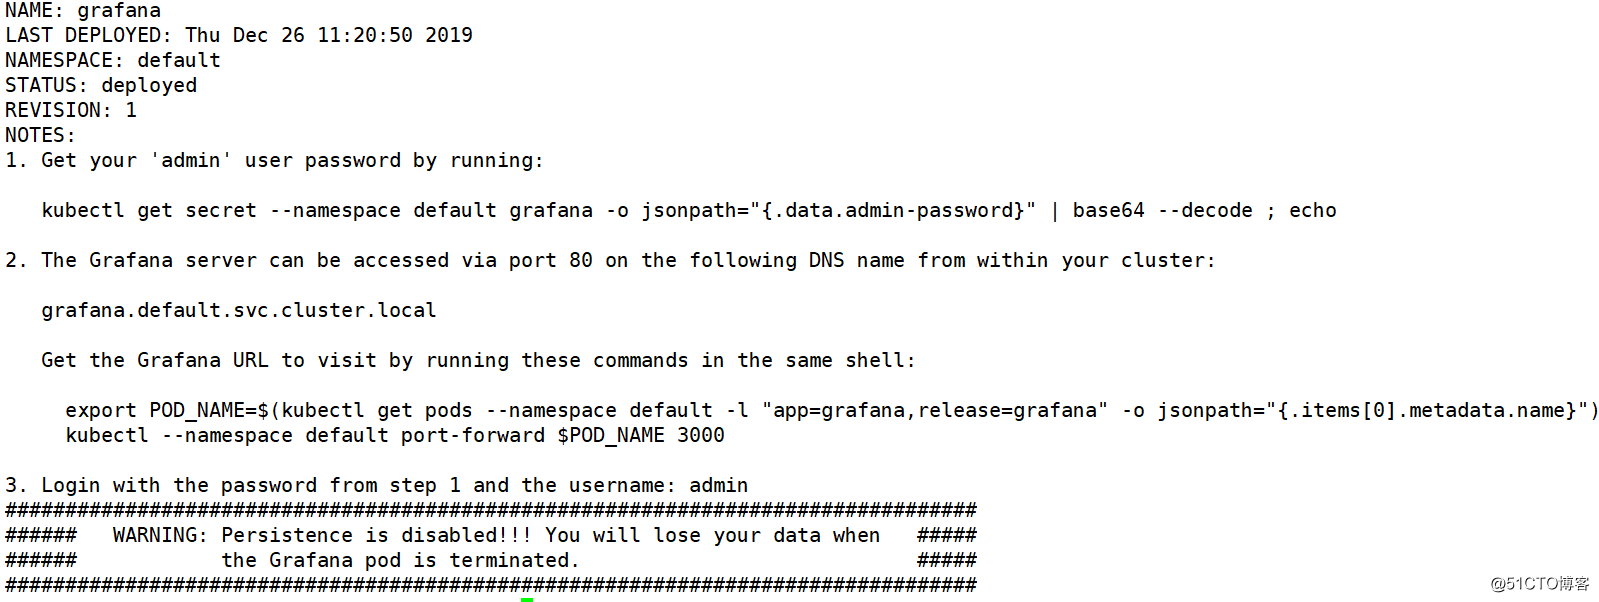
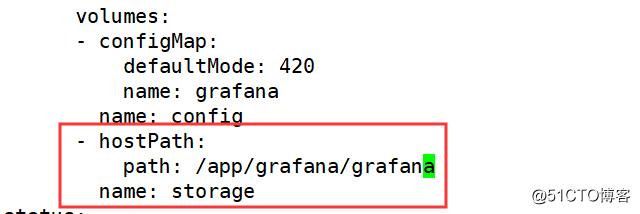
由于grafana没有使用持久存储,根据需求修改为hostpath持久存储,需要注意的是,宿主机目录也需要777的权限
Also you need to be diverted to svc grafana type NodePort


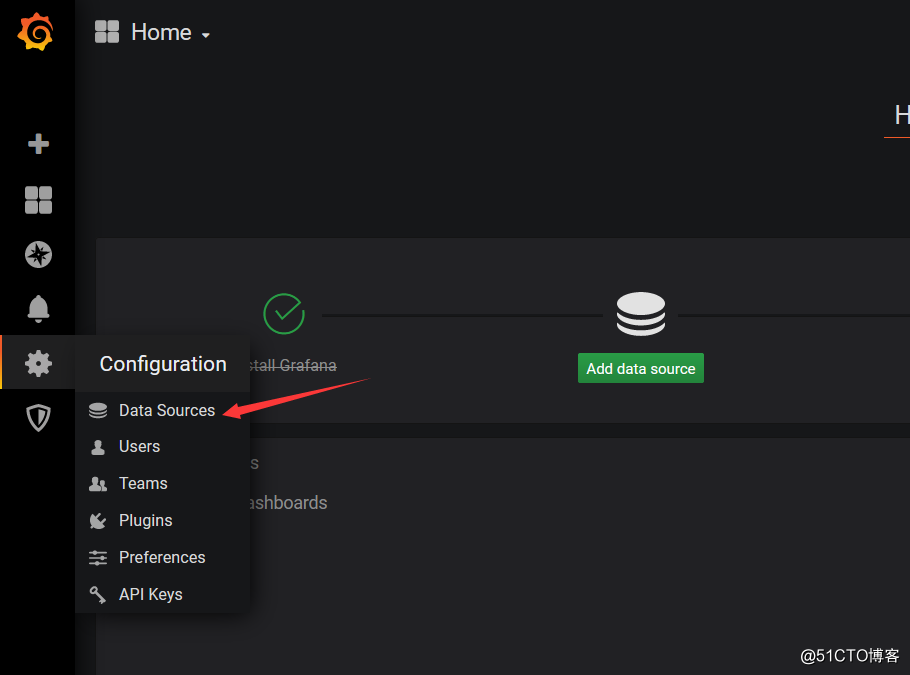
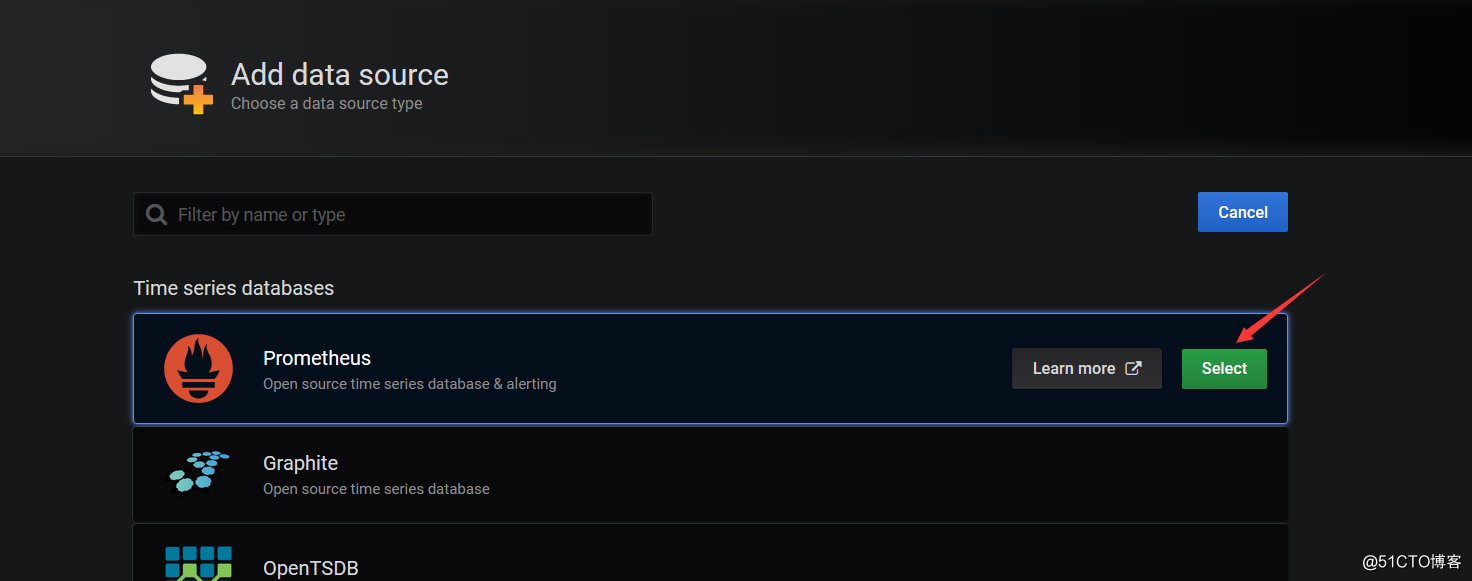
Fill in the address of Prometheus
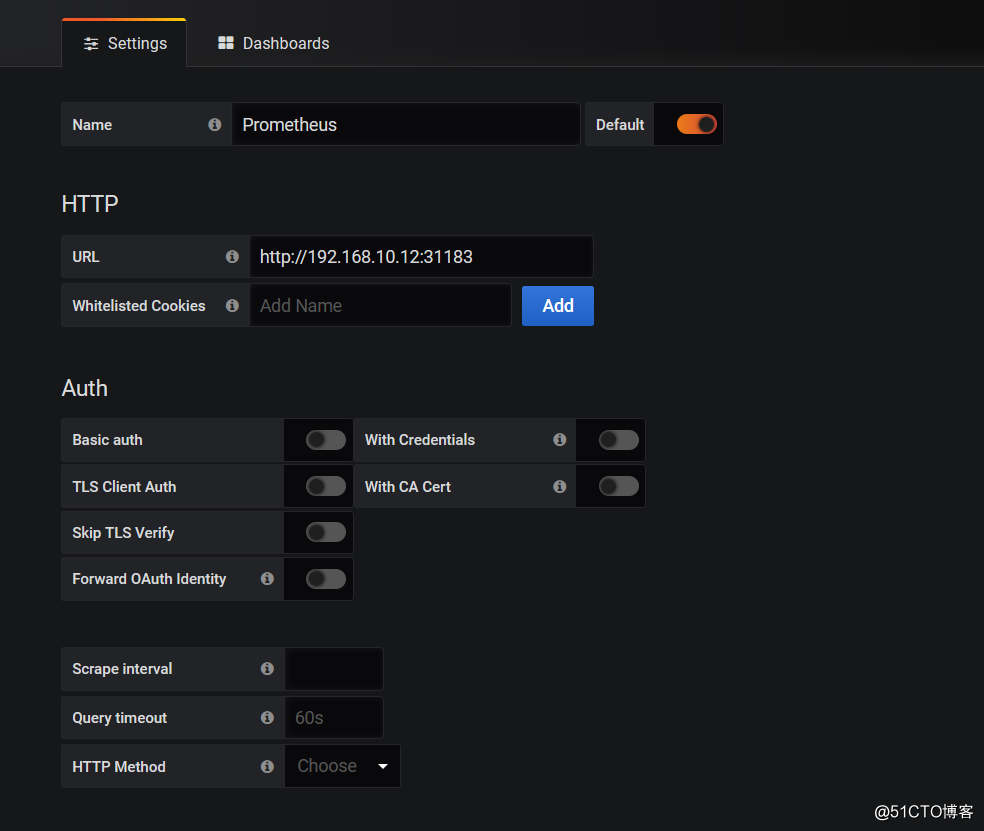
Said verification by

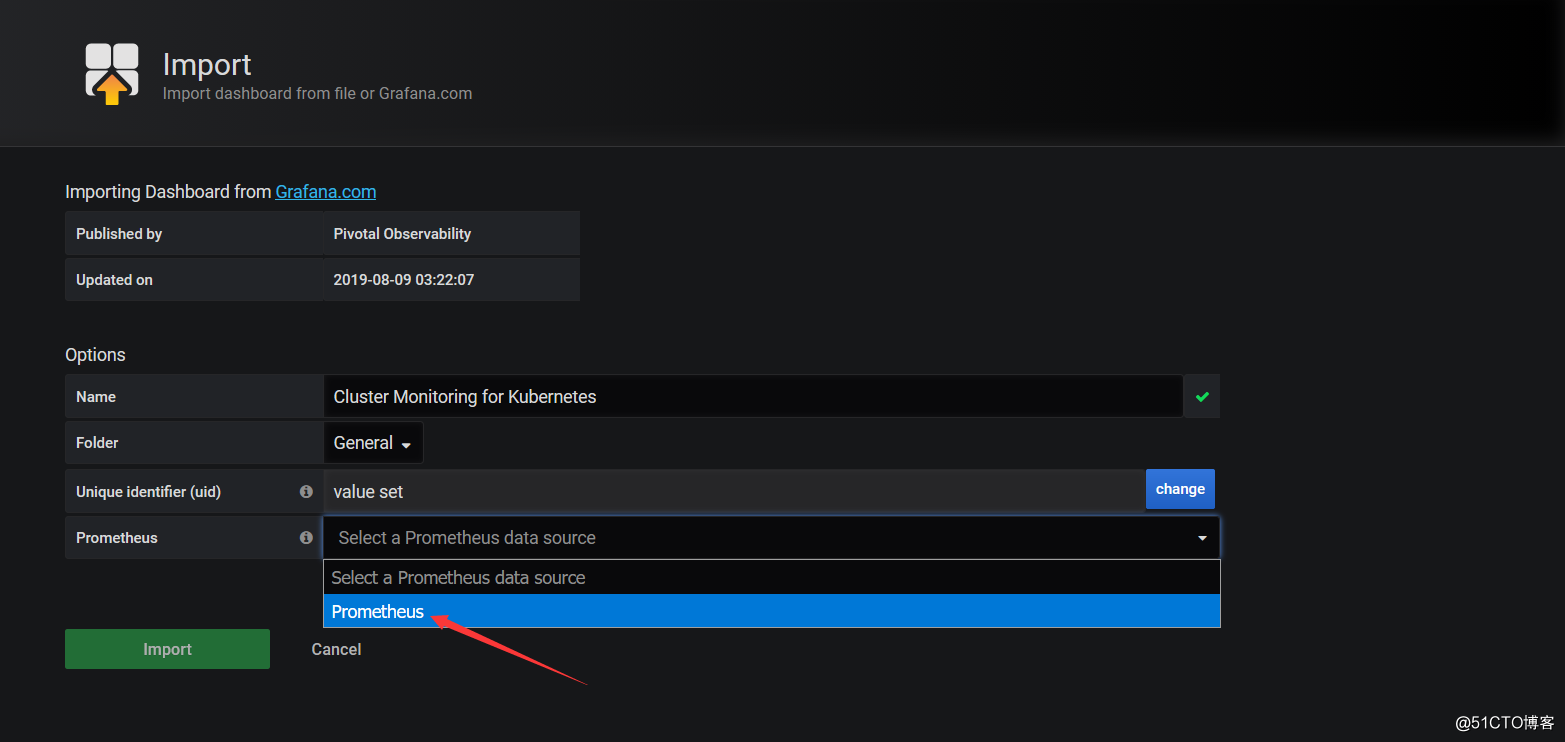
Importing templates grafana
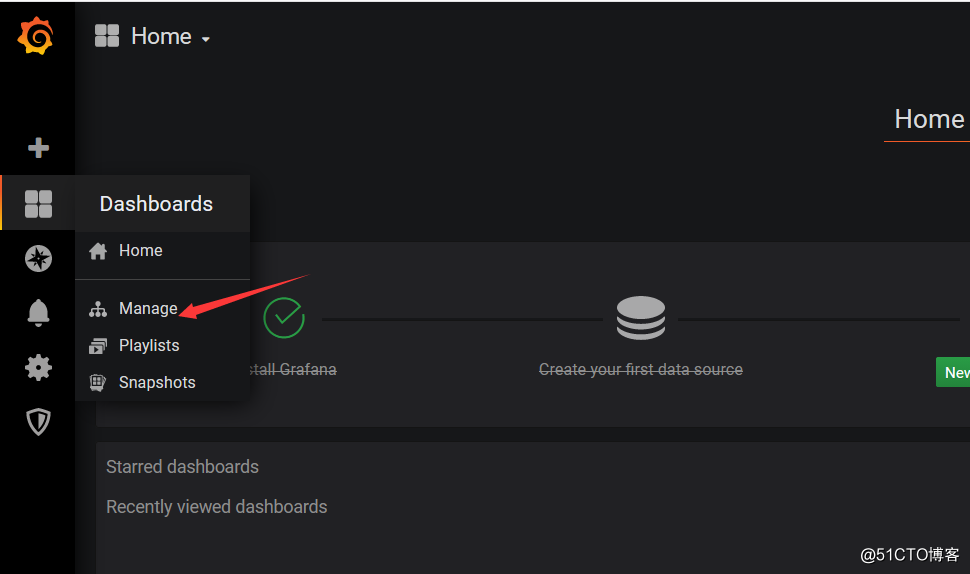
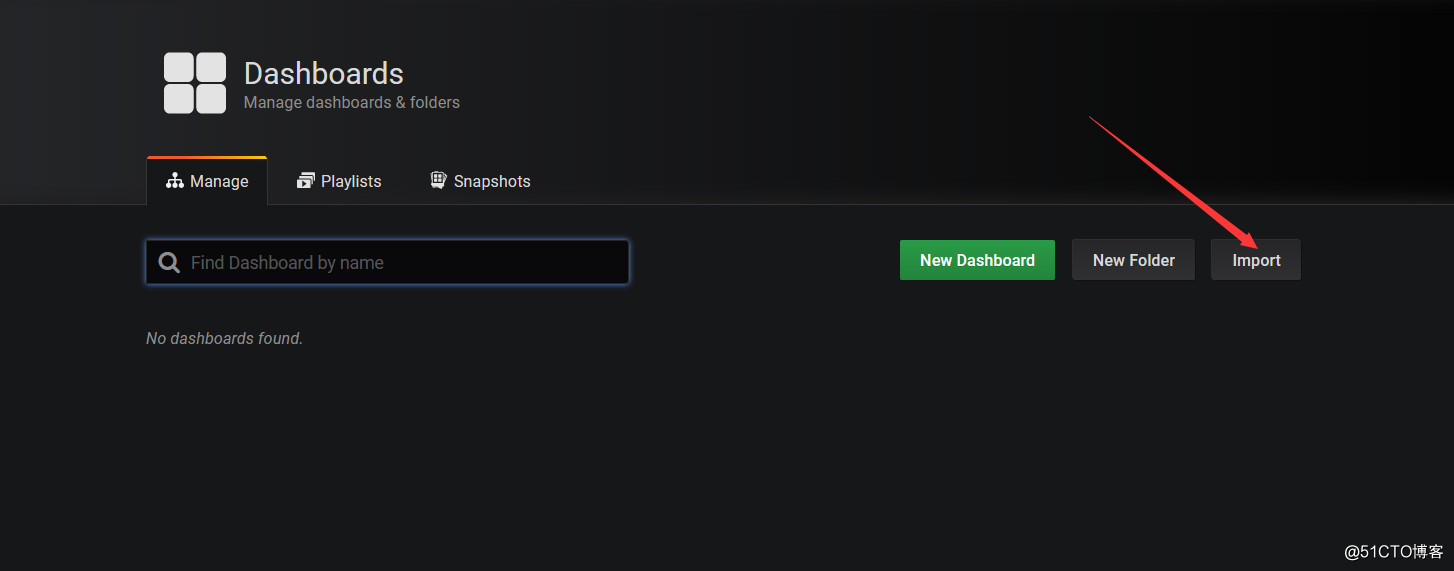
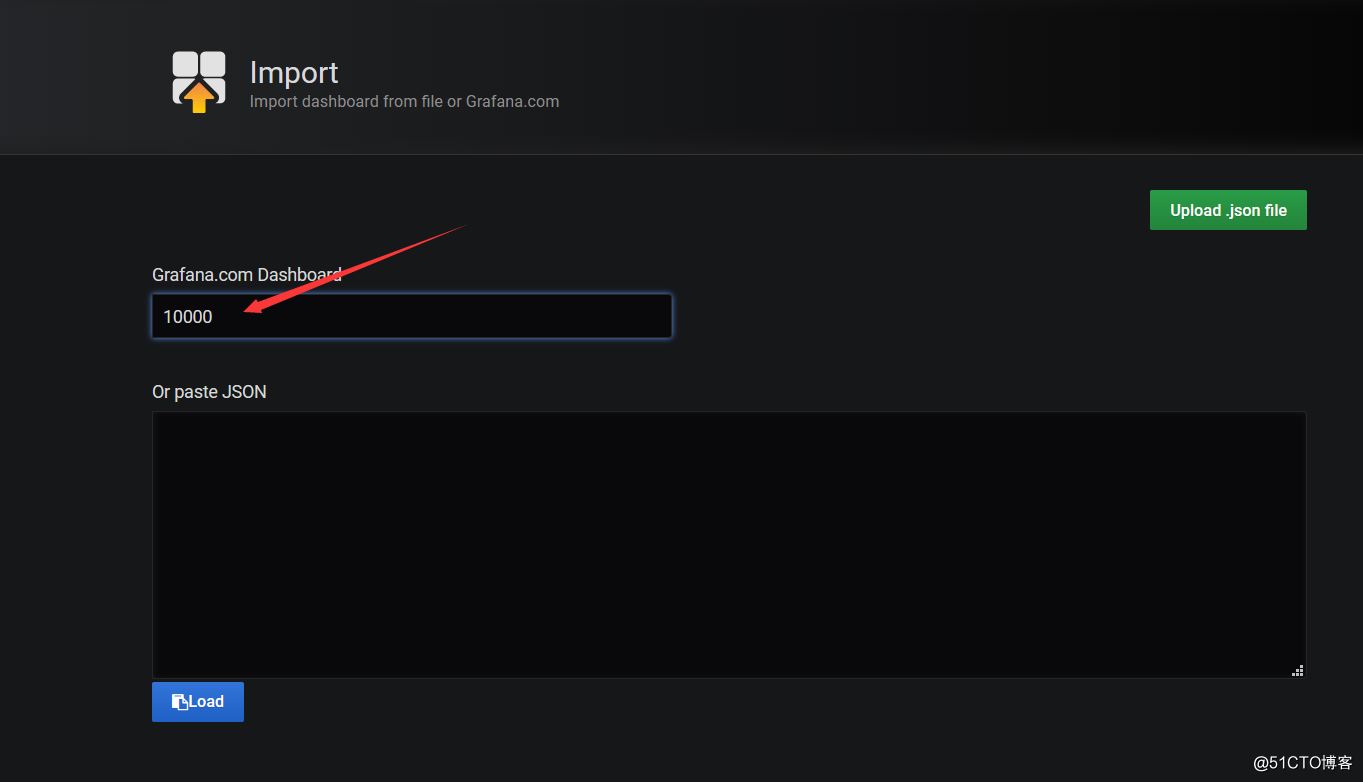
Here select Prometheus
Gray often to see the gorgeous dashboard
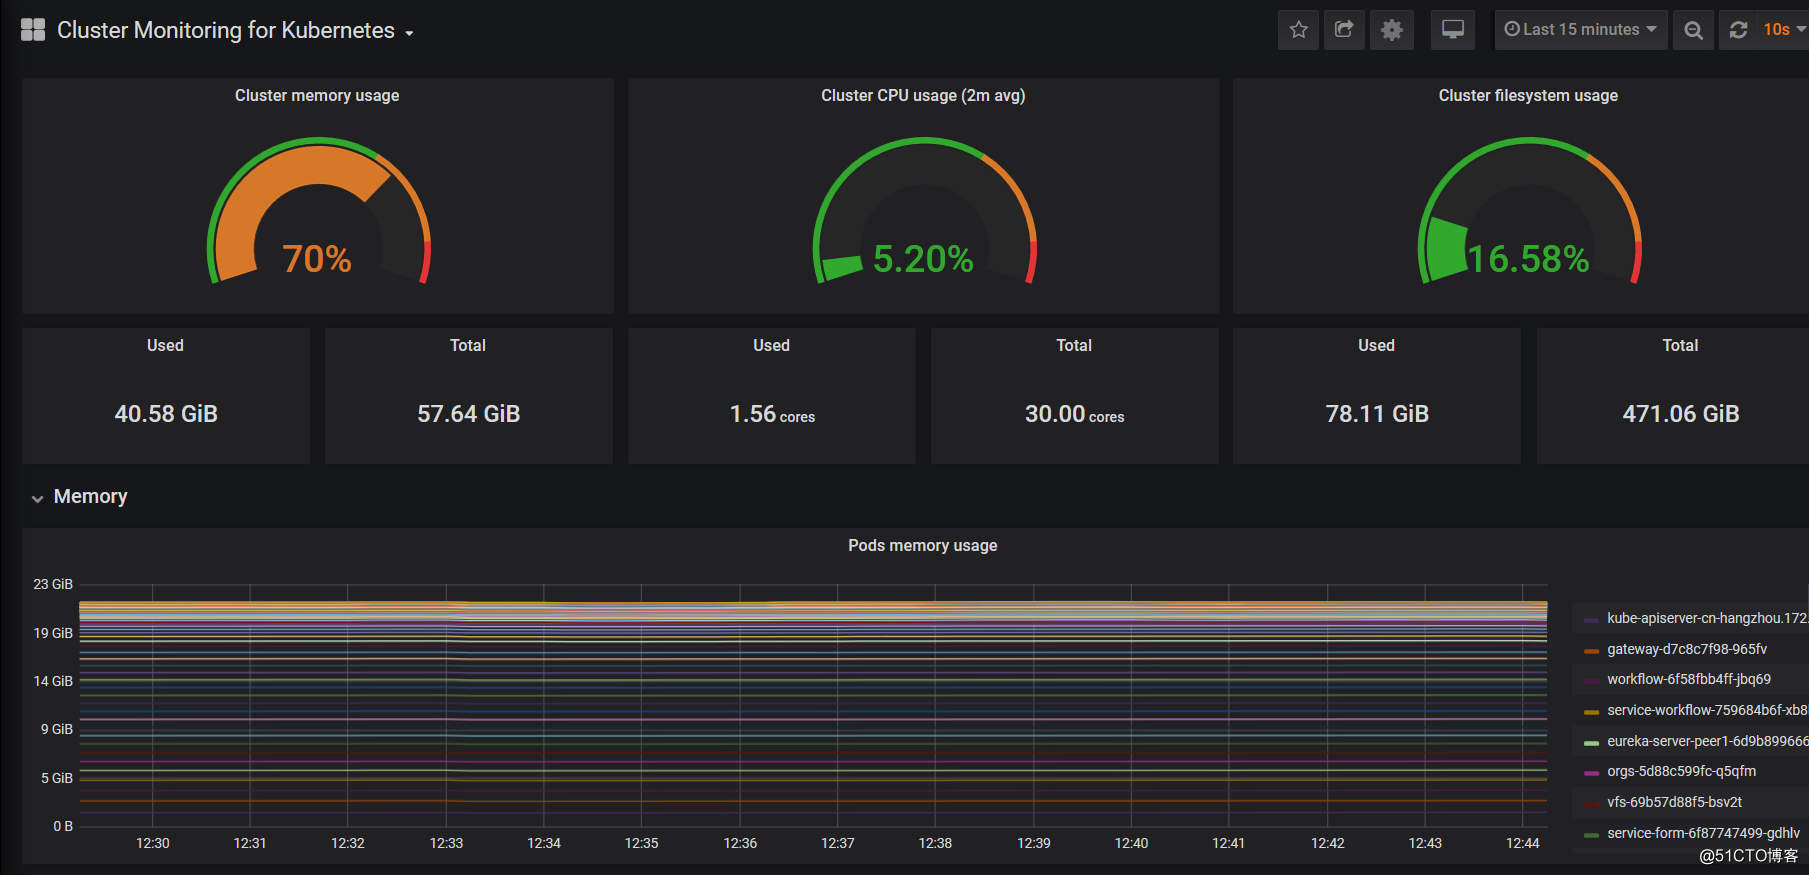
Here are a few numbers template:
10000,315,7249,5228,8685,8588
Perfect ending!