It’s okay to read the article, and share the notes, and record the learning progress through this method.
Wang Depeng. Server monitoring and alarming and performance optimization based on Zabbix[D]. Liaoning: Dalian University of Technology, 2020.
Original text: Server monitoring alarm and performance optimization based on Zabbix
Pay attention to the official account, and the background reply " Based on Zabbix to realize server monitoring and alarm and performance optimization" can get the original text and learn together.
The main content of the paper:
Based on Zabbix open source program and Mysql database, design and build a reliable and real-time monitoring and alarming platform to realize real-time monitoring and alarming of the temperature, performance, service and other status of servers, switches, routers and other equipment distributed in different regions , this monitoring and alarm platform is of great value in promoting the standardization, platformization and automation of the company's information system.
Two innovative points:
By writing a Python program to connect to the API interface of the monitoring and alarm platform, it makes up for the lack of Zabbix in batch modification.
In order to improve the processing performance of the monitoring and alarming platform, analyze the background Mysql database algorithm and select the storage engine and index type that are most suitable for the monitoring and alarming platform, and optimize the parameters of the database, so that the real-time performance and reliability of the monitoring and alarming platform are greatly improved. improvement.
1 Introduction
Comparison of various open source monitoring systems

This picture can be seen in many places on the Internet. Is this the original source?
2. Related technical analysis
I wrote a chapter on SNMP, IPMI, JMX protocols, MySQL database, and python. How to reduce the weight of this thing? Haha, but it's still good as a learning material.
3. Analysis and design of monitoring and alarm platform
In addition to the similar requirements and principles, the big difference from the online texts is that the block diagram of the system is given, which may be the needs of academic papers.

In the logic diagram of the entire platform, the arrows on the left refer to the names of the layers on the right. At first, I thought it was the output of data.

This picture is doubtful. This is the data flow of the Agent. Does the data transmission of the Agent use the Snmpd service?
4. Platform realization and application
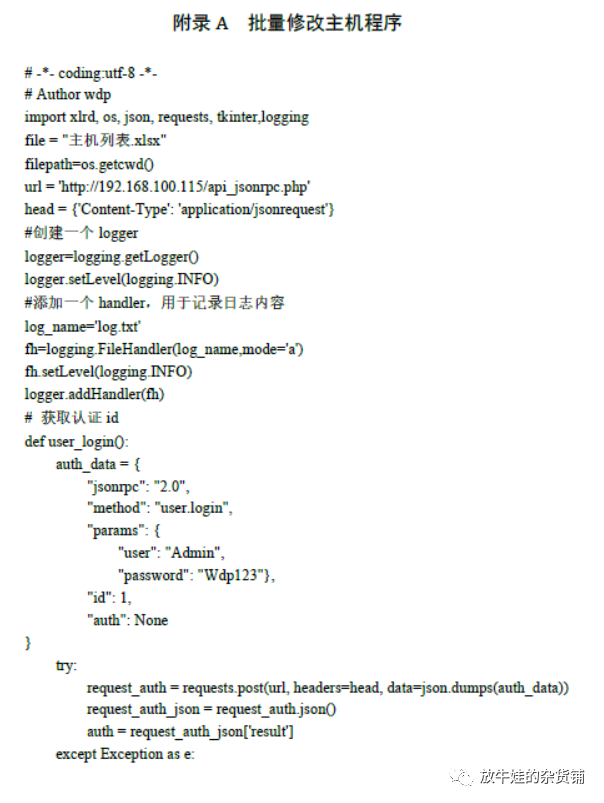
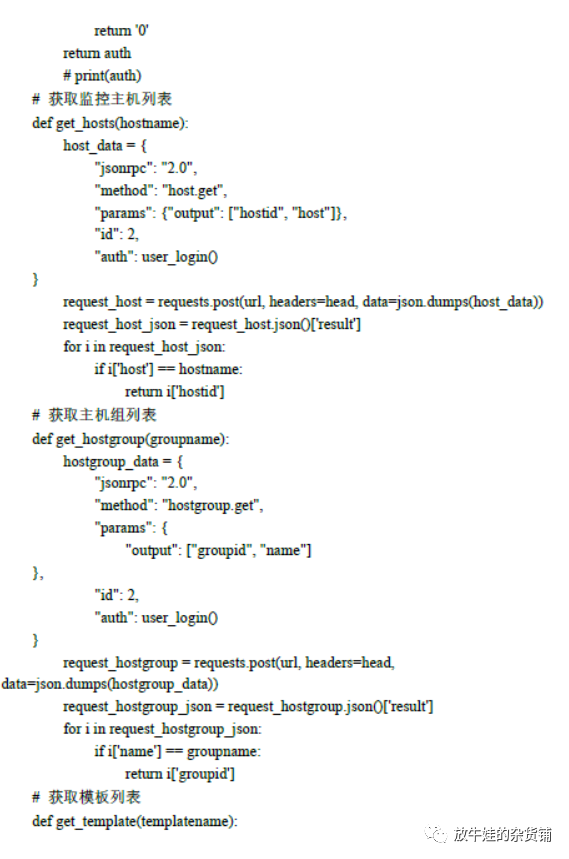
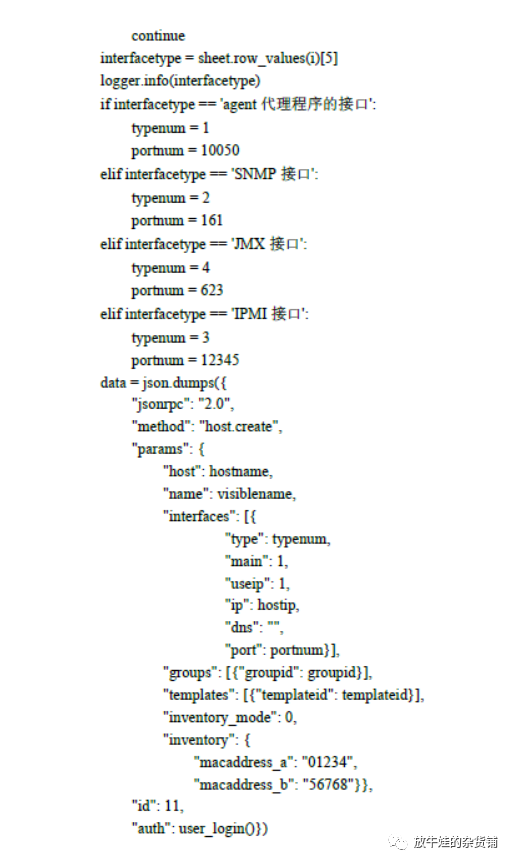
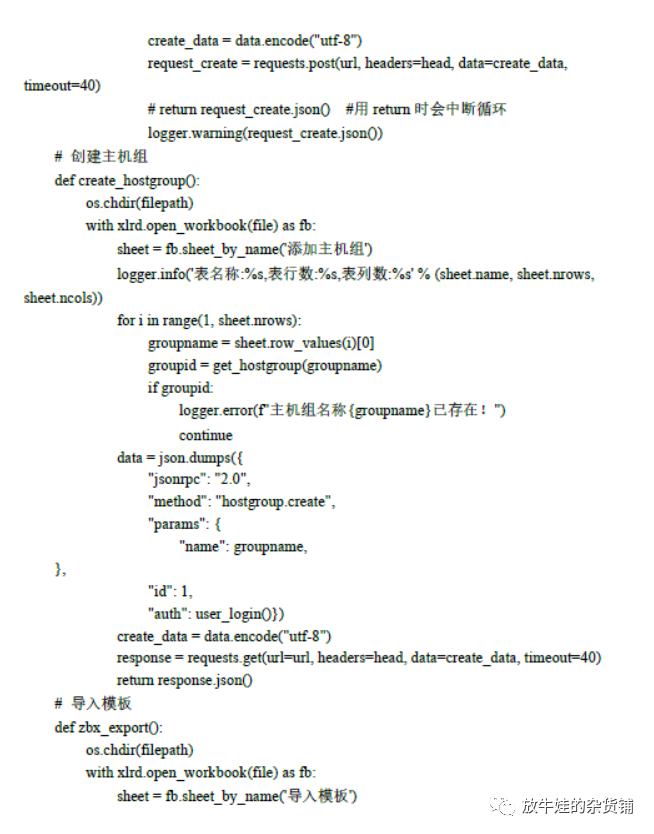
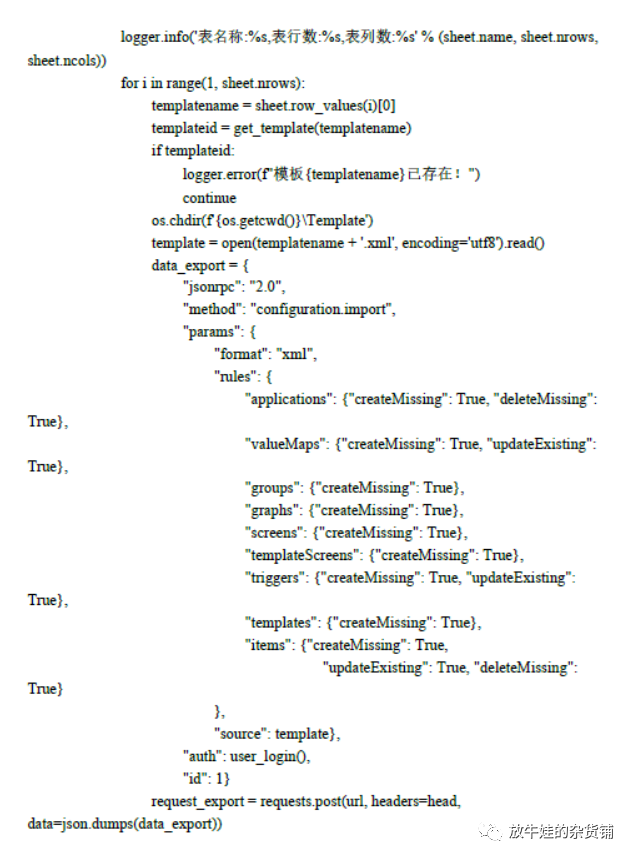
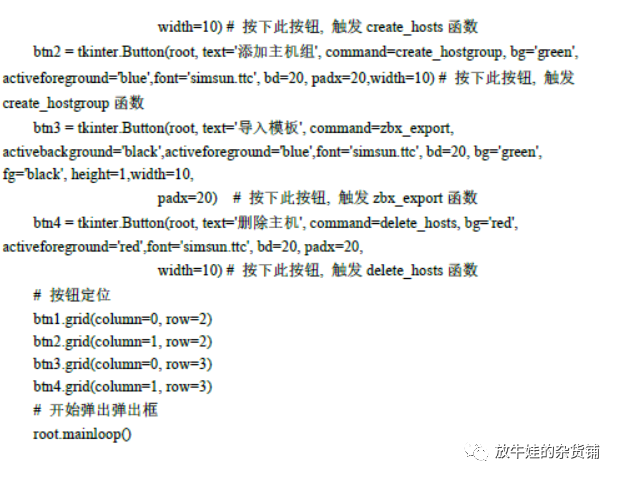
The implementation and application of the platform is to build a Zabbix monitoring solution. There is a method of using Python to read the host in Excel and perform batch modification. This is the innovation point of the article, and the others are basically consistent with the manual.
The author gives all the code in the appendix, using the zabbix API. This should be a small tool that can be used frequently, and you can learn from it.

5. Performance optimization and testing of the monitoring and alarming platform
It mainly includes structure optimization, database optimization and parameter optimization, and gives an optimization comparison. The structure uses proxy; database tuning starts from the database engine and index type, and then optimizes the parameters of the database; the optimization of zabbix Server mainly Including the number of processes, cache size, and refresh frequency, but only one picture is given, and it does not explain why it should be optimized in this way.
reanalysis of doubts
1. Agent's processing process
Last night, I said that Figure 3.3 in the paper was suspicious because I saw that SNMPD is a service of snmp, and MIB (management information base) is a database for storing OIDs, so it looks like a block diagram of the system using SNMP protocol to collect data.

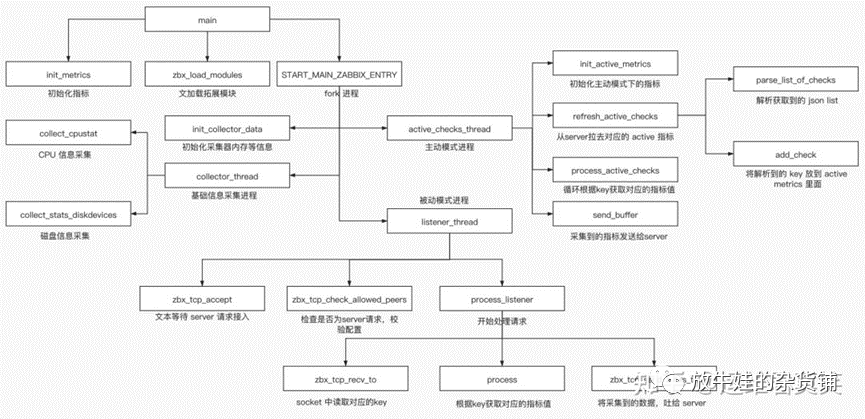
In fact, it is pointed out in the official manual that Agent has the following three processes:
-
collector_thread periodically collects basic information, mainly memory and CPU, stored in shared memory
-
listener_thread is used to receive collection tasks assigned by server or proxy, passive collection
-
active_checks_thread Active collection and reporting
The three processes here are easy to understand, one is to collect indicators, one is to accept tasks from the server, and the last is to report data.
I also found an Agent program structure diagram on the Internet, and the above structure can also be produced.
2. Optimal Design of Server
In yesterday's paper, only one server optimization configuration was given yesterday, and the reason was not given, let alone more configuration methods. Here are other configuration solutions, which will be studied in more detail later.
Zabbix server configuration file
#ListenPort=10051
#Listening port
# SourceIP=
#In the case of multiple addresses, specify which address to use for communication
# LogType=file
#The way to specify the log is to record to the file
LogFile=/var/log/zabbix/zabbix_server.log
#Specify the log file storage path; the user needs to have permission to the directory;
# LogFileSize=1
# Log rewriting, generally not open
# DebugLevel=3
#Log level; when you need to make a mistake, you can adjust to the debug level to see more clearly. After the mistake is completed, change back to the original log level, otherwise the log will fill up the disk space
PidFile=/apps/zabbix-server/run/zabbix_server.pid
#PID file path
SocketDir=/apps/zabbix-server/run/
#Specify the socket file path
DBHost=
#Connected database address
DBName=zabbix_server
#Name database
DBUser=
#Connected account
DBPassword=
#Connection password
Zabbix server optimization configuration
# HistoryStorageURL=
#Specify the elasticsearch server address, save zabbix historical data in ES, optimize zabbix performance, and need a new version of zabbix to support
# HistoryStorageTypes=uint,dbl,str,log,text
Index Types for #elasticsearch
# HistoryStorageDateIndex=0
#Save historical data to different elasticsearch indexes
# ExportDir=
#Define the directory of real-time export trigger events, monitoring item collection values, and trend data
# ExportFileSize=1G
#Define the maximum size of each exported file
StartPollers=6
# Specify to open several processes to collect agent data; the number of general processes corresponds to the number of CPU cores, and the range is 0-1000
# StartIPMIPollers=1
# Specify to open several processes to collect IPMI data, you need to open IPMI in advance, otherwise an error will be reported, the range is 0-1000
StartPreprocessors=6
#How many processes are pre-started to process zabbix agent data, the range is 0-1000
# StartPollersUnreachable=1
#How many processes to start to detect unreachable hosts in rotation, the range is 0-1000
Start Trappers=5
#How many processes are pre-started to handle trigger-related operations, the range is 0-1000
StartPingers=5
#How many processes to start for ping detection, used to ping network devices and hosts, the range is 0-1000
StartDiscoverers=6
#How many processes to start for automatic discovery, such as disk automatic discovery, network automatic discovery, the number of general processes should not exceed the number of host CPU cores, the range is 0-250
StartHTTPPollers=3
#When performing web access, how many processes are started to handle web access, the range is 0-1000
StartTimers=3
#The number of timer processes, the timer is used to calculate the occurrence time of the problem and step synchronization, etc., used for recursive sending of emails when triggering an alarm, etc., range 1-1000
# StartEscalators=1
The initial process number of the #elasticsearch process, the number of processes used to process the automatic steps in the action, 0-100
# StartAlerts=3
#The pre-start number of the alarm process, 0-100
# JavaGateway=
#zabbix is written in php and cannot directly access java programs, so javagateway is used. The javagateway is connected to zabbix at one end and the java environment at the other end to collect resource indicators of the java environment. A javagateway can connect to multiple java services; specify the javagateway address
# JavaGatewayPort=10052
#javagatewayListening port
# StartJavaPollers=0
#How many processes to pre-start to collect java data in rotation, 0-1000
# StartVMwareCollectors=0
#It is used to set the monitoring vmware esxi host instance, if it is 0, it will not be used. If you want to monitor the esxi host, the minimum value is 1. Set the corresponding number according to the number of monitoring esxi. Zabbix monitors vmware, you need to use the template for monitoring vmware ;0-250
VMwareFrequency=60
#Monitor the time interval for vmware to obtain the latest data, in seconds
# VMwarePerfFrequency=60
#Monitor vmware performance data time interval
# VMwareCacheSize=8M
#vmware data cache size will occupy the memory of zabbix server server
# VMwareTimeout=10
#vmware timeout for getting data
SNMPTrapperFile=/apps/zabbix-server/run/zabbix_traps.tmp
#Temporary path of the SNMP trigger file
StartSNMPTrapper=1
#SNMP trigger process number, the range is 0-1, 1 means open
# ListenIP=0.0.0.0
#zabbix server listening address
# HousekeepingFrequency=1
#How many hours to clean up the historical data of the agent database, the default is 1 hour, the range is 0-24; when the historical data storage time defined in the monitoring item and the trend data storage time exceed the specified time, it will be cleaned up ;Trend data will save the maximum value, minimum value and average value of the data within one hour; historical data is to query the data of each monitoring item is historical data
# MaxHousekeeperDelete=5000
#The maximum number of rows to delete historical data each time, the range is 0-1000000
CacheSize=128M
#The cache size used to store host, management item and trigger data; the range is 128K-8G, generally configured with 1 to 2 G
CacheUpdateFrequency=300
#zabbix update the frequency of cached data, in seconds, range 1-3600
StartDBSyncers=4
How many processes #zabbix starts to synchronize data with the database, including queries; 0-100
HistoryCacheSize=2G
# Historical data cache size, 128K-2G
HistoryIndexCacheSize=128M
#Historical data index information cache, 128K-2G
TrendCacheSize=16M
#It is used to set how much system shared memory is used to cache the calculated trend data. This parameter can affect the database read pressure to a certain extent, and the range is 128K-2G
ValueCacheSize=16M
#Shared memory size used to cache project historical data requests, 128K-64G
Timeout=30
#Specify how long the agent has not returned the data queried by the server, it will time out, 1-30
TrapperTimeout=300
#The maximum time for the trigger to process data, in seconds; 1-300
UnreachablePeriod=60
#When the host is unreachable for how many seconds, it is set as the host is unavailable, the unit is seconds, 1-3600
UnavailableDelay=60
#When the host is unavailable, how often to check the availability of the host, range 1-3600
UnreachableDelay=15
#When the host is unreachable, how often to check the availability of the host, 1-3600
AlertScriptsPath=${datadir}/zabbix/alertscripts
#Monitoring alarm script path depends on the datadir parameter at compile time, such as /apps/zabbix-server/share/zabbix/alertscripts
# FpingLocation=/usr/sbin/fping
#Specify the location of the fping command, fping is used to test network connectivity; you can use apt install fping to install
# Fping6Location=/usr/sbin/fping6
Command location for #fping6
LogSlowQueries=3000
#Specify how long the result is not returned, it is a slow log (in milliseconds), only when the log level is 3, 4/5, 0 means no recording, the range is 1-3600000
# TmpDir=/tmp
#Temporary file storage directory
StartProxyPollers=1
#Specify how many processes the zabbix server starts to communicate with the proxy. This is a passive proxy, and the zabbix server actively connects to the proxy, and the proxy passively accepts the server connection. Generally, it is necessary to ensure that a server process interacts with a proxy
ProxyConfigFrequency=60
#proxy passive mode, how many seconds does the server synchronize the configuration file (monitoring item) to the proxy, this parameter is only used for the passive mode proxy, the range is 1-3600*24*7; if a new agent node is added through zabbix web, how long Synchronize the configuration file to the proxy once at a time. After the proxy receives the configuration file, it will synchronize the configuration file to the agent host again, so that the agent host can obtain the monitoring items to be collected in the configuration file.
ProxyDataFrequency=60
#In passive mode, how many seconds does the zabbix server request historical data from the proxy, the proxy will report the monitoring data of the agent to the server within the specified time, 1-3600
# AllowRoot=0
#Whether it is allowed to start zabbix as root, if you want to allow it, change it to 1
User=zabbix
#Specify the user who starts zabbix
# Include=
#Import the configuration file of the specified path
# StatsAllowedIP=
#Set the address that allows access to the zabbix server
after reading
The article mentions the monitoring of a company's network many times. This should be a summary of a specific network monitoring project. The technology used is not difficult, but the structure and process are still written clearly, and The biggest difference between manuals and online articles may be helpful for further understanding of monitoring.
Original text: Server monitoring alarm and performance optimization based on Zabbix
Pay attention to the official account, and the background reply " Based on Zabbix to realize server monitoring and alarm and performance optimization" can get the original text and learn together.