VS2019 (Visual Studio 2019) is an integrated development environment (IDE) developed by Microsoft for developing various applications, including desktop applications, web applications, mobile applications, and more.
Familiarity with tools can help improve development efficiency. It is necessary to spend some time learning how to use tools.
Commonly used shortcut keys to set the position
In the menu bar---Tools---Options---Environment---Keyboard
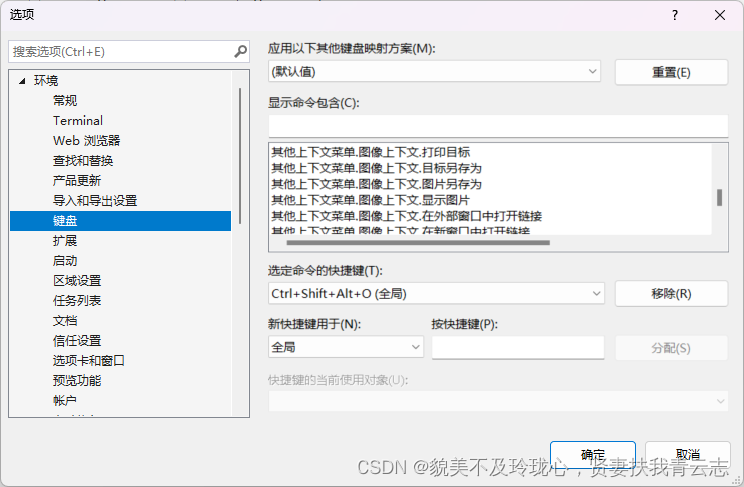
In the keyboard mapping scheme, there are shortcut key modes of Microsoft's previous IDE, such as VC6, which can be used by setting the keyboard mapping scheme to VC6, which is convenient for developers who originally used VC6 to use VS2019
The following display commands include the corresponding functions and shortcut keys, which can be modified according to personal preferences
Here, the default mode is used for learning during the learning process
Commonly used shortcut keys
Ctrl + Shift + B: compile only
F5: Compile and link
Commenting and uncommenting are combined key operations
Note: CTRL+K, CTRL+C
Uncomment: CTRL+K, CTRL+U
Debugger related
F5: start debugging program
Shift + F5: Stop debugging (end debugging session)
F9: Set a breakpoint, set a breakpoint on the line where the cursor is located
Pressing F9 again will cancel the breakpoint
F10: Step-by-step debugging (execute the current line line by line, skipping function calls ).
F11: Statement-by-statement debugging (execute the current line line by line, including function calls ).
Shift + F11: Jump out of the current function (execute to the caller of the current function).
Ctrl + F10: Run to the cursor (the program runs to the line where the cursor is located).
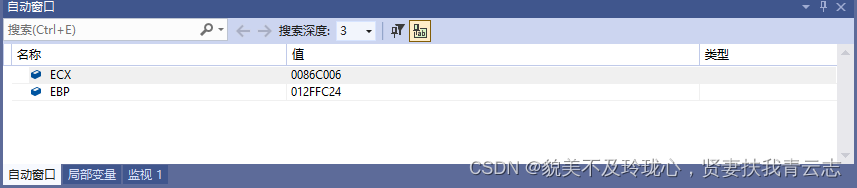
Automated Window: In debug mode, select the "Windows" option in the "Debug" menu, then select "Automated" Window. You can also use the shortcut keys Ctrl + Alt + P.

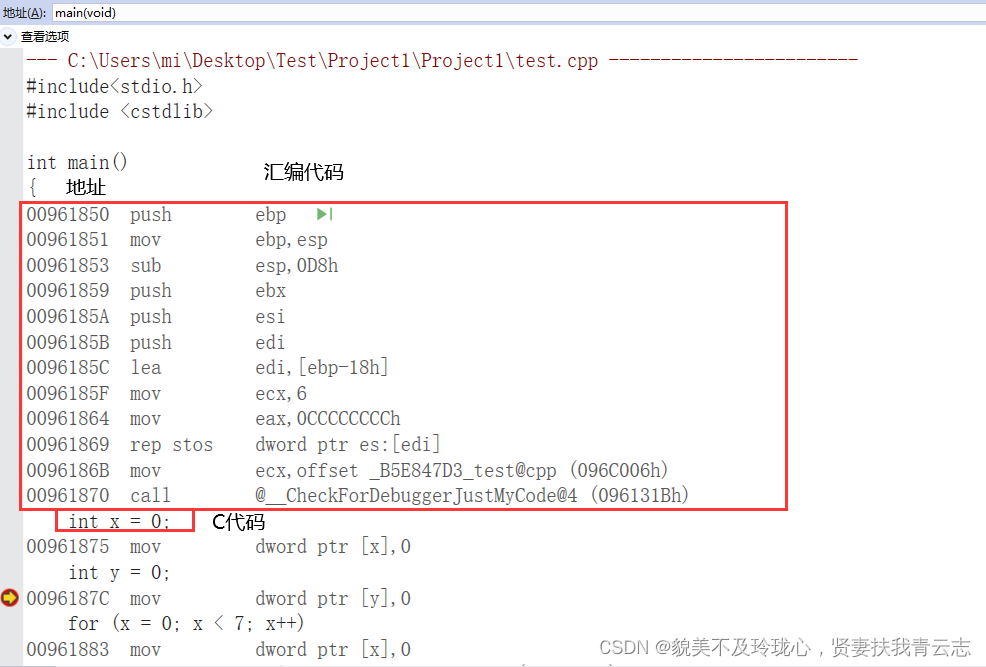
There are differences in registers, memory, and c file codes
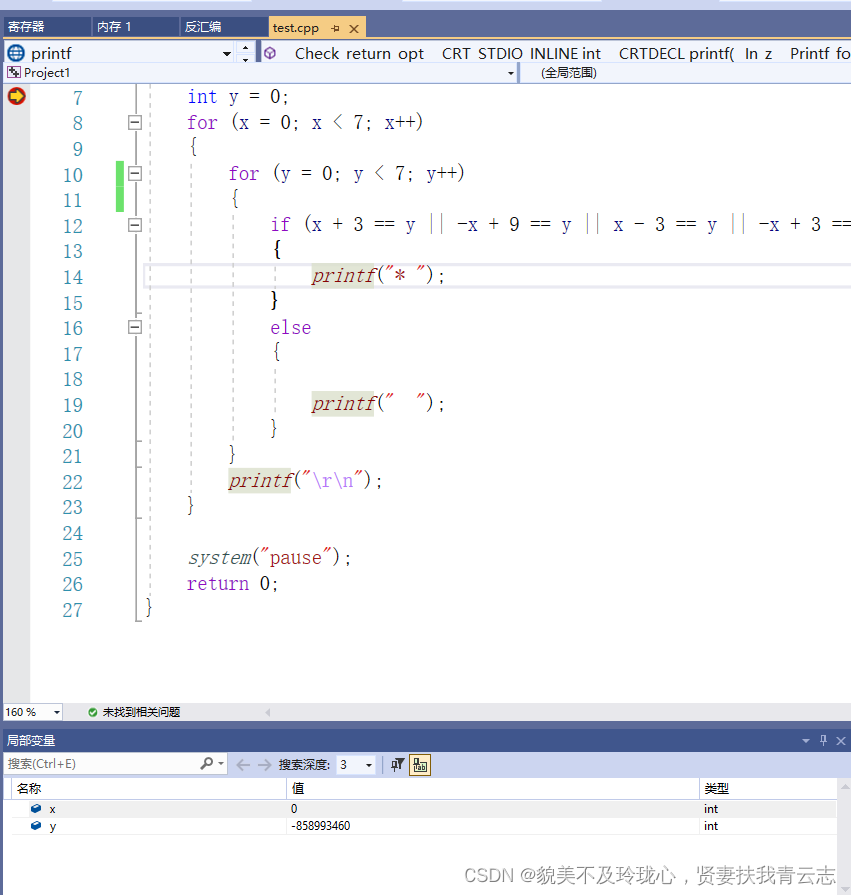
There is also a local variable window, which displays all local variables defined in the code, and can view changes during debugging, which is conducive to analyzing algorithms, etc.
other shortcut keys
CTRL + ALT + D: Bring up the disassembly interface
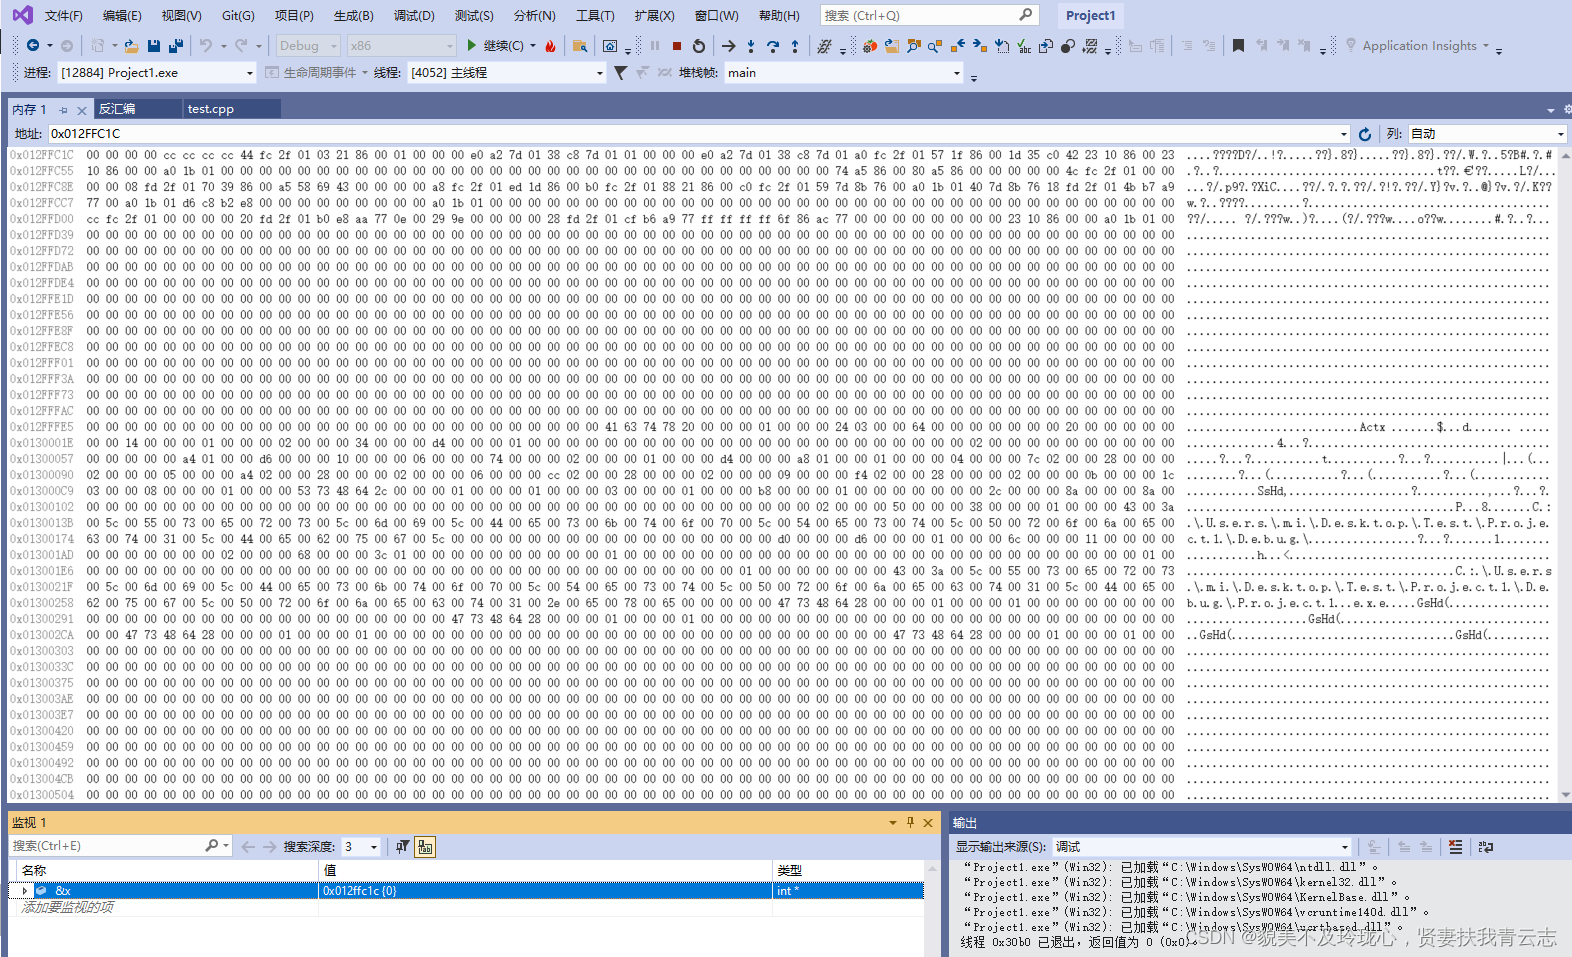
Open the Memory window: In a debug session, select the Windows option from the Debug menu, then select the Memory window. You can also use the shortcut keys Ctrl + Alt + M.
Open the Registers window: In a debug session, select the "Windows" option in the "Debug" menu, then select the "Registers" window. You can also use the shortcut keys Ctrl + Alt + G.

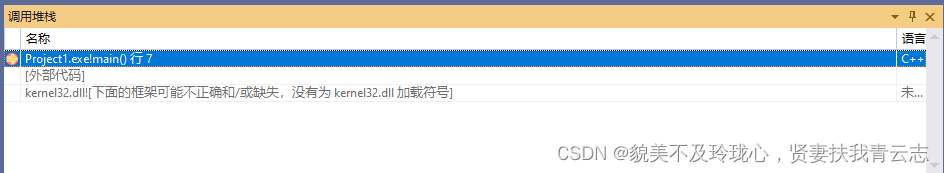
Open the Call Stack window: In a debugging session, select the Windows option from the Debug menu, then select the Call Stack window. You can also use the shortcut Ctrl + Alt + C.
F12: Go to the function definition, that is, the function implementation

The use of VS2019 is suspended here, and I will continue to learn in practice.
How to learn memory structure?
It is necessary to achieve every step of code execution, and the changes in the memory can be correctly predicted. It is necessary to run the C++ syntax to observe the changes in the memory structure. This is also the significance of learning VS2019.