Purpose
- Master the visual interface design GUI of matlab
- Mastering collection transformations of images
Experimental content
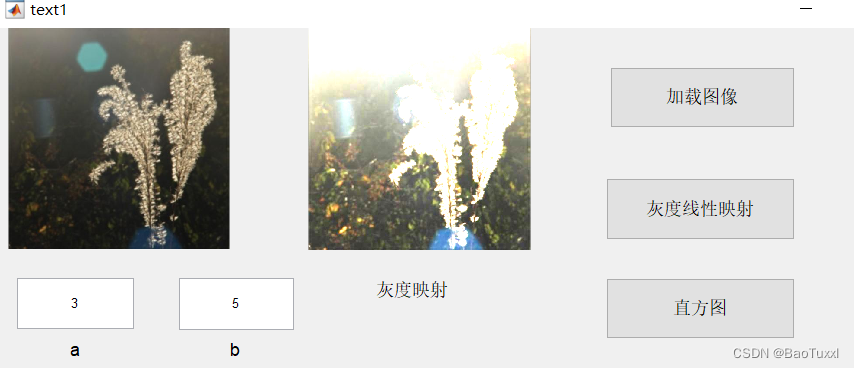
- Gray-scale linear mapping of gray-scale images, through the adjustment of advanced parameters (the parameters are input in the text box), the image quality adjustment is realized, g(x, y)=a*f(x, y)+b
Design ideas
1. Load the grayscale image: first you need to load the grayscale image to be processed into the program
2. Grayscale conversion: Convert the color image to a grayscale image for subsequent grayscale mapping processing.
3. Gray-scale linear mapping: According to the formula g(x,y)=a*f(x,y)+b, gray-scale linear mapping is performed on the gray-scale image. Among them, a and b are the parameters input by the text box, f(x, y) represents the pixel value of the original grayscale image at (x, y) position, g(x, y) represents the processed grayscale image at Pixel value at (x,y) position.
4. Display processing results: display the processed grayscale image
code and comments
function pushbutton1_Callback(hObject, eventdata, handles)
% hObject handle to Open (see GCBO)
% eventdata reserved - to be defined in a future version of MATLAB
% handles structure with handles and user data (see GUIDATA)
% open the file and read in
[filename,pathname]=uigetfile({'*.bmp;*.jpg;*.png;*.jpeg;*.tif'},'choose a picture','F:\test'); %Get picture address
str=[pathname filename]; % store file address
if isequal(filename,0)||isequal(pathname,0) % small part is prompt
warndlg('Please select a picture first!','Warning');
return;
else
handles.OriginalPic= imread(str); % read the original picture
axes(handles.axes1); % displayed in axes1
imshow(handles.OriginalPic);
end;
guidata(hObject,handles);
function pushbutton2_Callback(hObject, eventdata, handles)
% Get the value in the corresponding edit control in the GUI interface
% Get the image in axes1
img=handles.OriginalPic
a = str2double(get(handles.edit2, 'String'));
b = str2double(get(handles.edit3, 'String'));
outputImg = a * double(img) + b;
axes(handles.axes2);
imshow(uint8(outputImg));
% hObject handle to pushbutton2 (see GCBO)
% eventdata reserved - to be defined in a future version of MATLAB
% handles structure with handles and user data (see GUIDATA)

Result analysis
In terms of image quality adjustment, the brightness, contrast, and brightness of the image can be changed by adjusting the slope and intercept. For example, if you want to increase the brightness of the image, you need to increase the slope appropriately while decreasing the intercept; if you want to increase the contrast of the image, you need to increase the slope but do not need to change the intercept.
- Realize the histogram display of the image, histogram equalization (button)
Design ideas
1. Load image: use imread function or other related functions to load image from file.
2. Display the original image: use the imshow function to display the read image on the GUI interface for the user to operate.
3. Display the histogram: Calculate the grayscale histogram of the image and draw it using the histogram function. The histogram function can automatically calculate the image histogram and display it in the GUI interface in the form of a histogram.
4. Realize histogram equalization: According to the user's operation, call the histeq function in the button click event to realize histogram equalization, and update the image and histogram display in the GUI interface.
5. Add buttons: Add buttons on the GUI interface and bind event response functions to realize user interaction.
code and comments
function pushbutton3_Callback(hObject, eventdata, handles)
img=handles.OriginalPic;
[counts, bins] = imhist(rgb2gray(img));
% Draw a histogram in axes4
plot(handles.axes3, bins, counts);
% hObject handle to pushbutton3 (see GCBO)
% eventdata reserved - to be defined in a future version of MATLAB
% handles structure with handles and user data (see GUIDATA)
% --- Executes on button press in pushbutton4.
function pushbutton4_Callback(hObject, eventdata, handles)
img=handles.OriginalPic;
% Perform histogram equalization on the image
img_eq = histeq(rgb2gray(img));
% Display the equalized image in axes3
imshow(img_eq, 'Parent', handles.axes3);
% Compute the histogram of the equalized image
[counts_eq, bins_eq] = imhist(img_eq);
% Draw the equalized histogram in axes4
plot(handles.axes4, bins_eq, counts_eq);


Result analysis
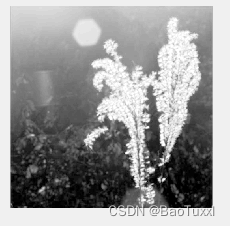
1. Histogram display: The histogram of the grayscale image is generated by the histogram function, and the frequency of occurrence of different grayscale levels can be clearly seen. The brightness, contrast and color distribution of the image can be judged by the shape of the histogram, which provides basic information for subsequent processing.
2. Histogram equalization: By calling the histeq function to achieve histogram equalization, the visual effect of the image can be enhanced. Histogram equalization will expand the dynamic range of the image, increase the brightness of low gray value pixels, and reduce the brightness of high gray value pixels, so that the overall image is brighter and has better visual effects.
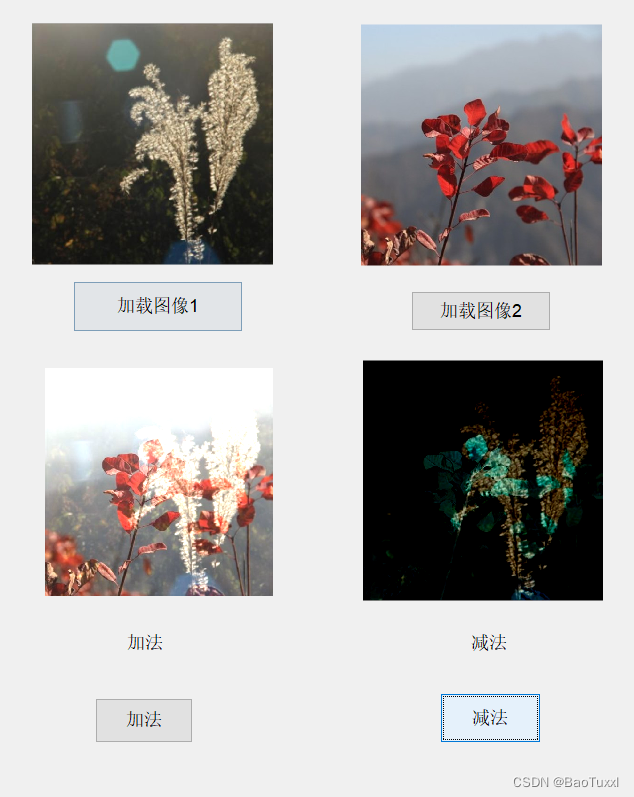
3. Read two images and realize basic algebraic operations
Design ideas
1. Add two axes to the GUI to display the processed image results.
2. Create a button or other object that triggers the addition and subtraction operations.
3. Write Matlab code to realize image addition and subtraction. You can use the imread function to read images, the imadd function for addition, and the imsubtract function for subtraction.
4. Display the processed results in axes. Images can be displayed in axes using the imshow function.
code and comments
function pushbutton7_Callback(hObject, eventdata, handles)
res=imadd(handles.picture1,handles.picture2)
imshow(res, 'Parent', handles.axes10)
% hObject handle to pushbutton7 (see GCBO)
% eventdata reserved - to be defined in a future version of MATLAB
% handles structure with handles and user data (see GUIDATA)
% --- Executes on button press in pushbutton8.
function pushbutton8_Callback(hObject, eventdata, handles)
res=imsubtract(handles.picture1,handles.picture2)
imshow(res, 'Parent', handles.axes11)
% hObject handle to pushbutton8 (see GCBO)
% eventdata reserved - to be defined in a future version of MATLAB
% handles structure with handles and user data (see GUIDATA)
Result analysis
The operation of reading two images and performing addition and subtraction in Matlab is realized.
4. Realize mean filtering and median filtering (template size parameters are entered in the text box)
Design ideas
The idea of mean filtering is as follows:
- Get the size of the image to be processed and the filter template.
- Traversing the image to be processed, for each pixel, take the average value of all pixels in the filter template area, and assign the average value to the current pixel.
- Repeat step 2 until the entire image is traversed.
The implementation idea of the median filter is as follows:
- Get the size of the image to be processed and the filter template.
- Traversing the image to be processed, for each pixel, take the gray value of all pixels in the filter template area, take the intermediate value after sorting, and assign the intermediate value to the current pixel.
- Repeat step 2 until the entire image is traversed.
code and comments
function pushbutton5_Callback(hObject, eventdata, handles)
originalImage =handles.OriginalPic;
originalImage=rgb2gray(originalImage);
filterSize = str2double(get(handles.edit4, 'String'));
% apply mean filtering
meanFiltered = imfilter(originalImage, fspecial('average', [filterSize filterSize]));
% Display the filtered image in axes3 and axes4
axes(handles.axes5);
imshow(meanFiltered);
% hObject handle to pushbutton5 (see GCBO)
% eventdata reserved - to be defined in a future version of MATLAB
% handles structure with handles and user data (see GUIDATA)
% --- Executes on button press in pushbutton6.
function pushbutton6_Callback(hObject, eventdata, handles)
originalImage =handles.OriginalPic;
originalImage=rgb2gray(originalImage);
% Get the filter size from the edit box
filterSize = str2double(get(handles.edit4, 'String'));
% apply median filter
medianFiltered = medfilt2(originalImage, [filterSize filterSize]);
axes(handles.axes6);
imshow(medianFiltered);
% hObject handle to pushbutton6 (see GCBO)
% eventdata reserved - to be defined in a future version of MATLAB
% handles structure with handles and user data (see GUIDATA)

Result analysis
1. Analysis of mean filtering results: Mean filtering can effectively smooth the image, but it will cause the details of the image to be blurred. As the filter template size increases, the image can be smoothed better, but it will also make the image more blurred. Therefore, when selecting the size of the filter template, it needs to be adjusted according to the specific situation.
2. Median filtering results analysis: Median filtering can effectively remove noise other than Gaussian noise such as salt and pepper noise, while retaining the edge information of the image. Similarly, as the size of the filter template increases, the noise can be removed better, but it will also distort the details of the image. Therefore, appropriate adjustments are also required when selecting the size of the filter template.
problem and solution
- Gray-scale linear mapping of gray-scale images, through the adjustment of advanced parameters (the parameters are input in the text box), the image quality adjustment is realized, g(x, y)=a*f(x, y)+b
Problems that may arise:
- The format of the input parameters is incorrect or beyond the reasonable range, resulting in code errors;
- The displayed results are not as expected, and there may be logic errors in the code implementation.
solution:
- In the process of code development, it is necessary to strictly control and check the format and value range of input parameters, which can be realized by using the input verification function that comes with Matlab;
- When debugging code, you can print and inspect intermediate results step by step to find errors in the code.
- Realize the histogram display of the image, histogram equalization (button)
Problems that may arise:
- Image reading failed or the read image format does not support histogram operation;
- The histogram is calculated incorrectly or the effect of the histogram equalization algorithm is not as expected.
solution:
- During the code development process, ensure that the read image format is correct and supports histogram operations;
- When debugging code, you can print and check intermediate results step by step to find errors in the code; at the same time, you also need to carefully design and test the effect of the algorithm to ensure that the output results meet user expectations
- Read two images, implement basic algebraic operations, and implement mean filtering and median filtering (the template size parameter is entered in the text box)
Problems that may arise:
- The format of the input parameters is incorrect or beyond the reasonable range, resulting in code errors;
- Image reading failed or the read image format does not support the required operation;
- There is a logic error in the algorithm implementation, resulting in unexpected output results.
solution:
- In the process of code development, it is necessary to strictly control and check the format and value range of input parameters, which can be realized by using the input verification function that comes with Matlab;
- When debugging the code, you can print and check the intermediate results step by step to find errors in the code; at the same time, you also need to carefully design and test the effect of the algorithm to ensure that the output results meet the user's expectations.
Summary and experience
Gray scale linear mapping is a simple and effective image enhancement method, which is often used in practical applications. When the code is implemented, it is necessary to strictly check and control the input parameters to avoid unexpected errors; at the same time, it is also necessary to carefully design and test the effect of the algorithm to ensure that the output results meet the user's expectations. Histogram is a commonly used image statistics tool, which can effectively describe the distribution of images. The histogram equalization algorithm can enhance the contrast of the image and make the visual effect of the image more full. In practical applications, it is necessary to select an appropriate algorithm according to different scenarios and requirements, and to fully test and debug the implementation of the algorithm. Basic algebraic operations, mean filtering, and median filtering are commonly used operations in image processing and are very useful in practical applications. When the code is implemented, it is necessary to strictly check and control the input parameters to avoid unexpected errors; at the same time, it is also necessary to carefully design and test the effect of the algorithm to ensure that the output results meet the user's expectations. The realization of mean filtering and median filtering is the basic operation in digital image processing. Mastering these two filtering algorithms can effectively remove image noise and smooth the image. During the implementation process, attention should be paid to exception handling and boundary issues, and an appropriate template size should be selected according to image characteristics to achieve the best results.
appendix
function varargout = text1(varargin)
% TEXT1 MATLAB code for text1.fig
% TEXT1, by itself, creates a new TEXT1 or raises the existing
% singleton*.
%
% H = TEXT1 returns the handle to a new TEXT1 or the handle to
% the existing singleton*.
%
% TEXT1('CALLBACK',hObject,eventData,handles,...) calls the local
% function named CALLBACK in TEXT1.M with the given input arguments.
%
% TEXT1('Property','Value',...) creates a new TEXT1 or raises the
% existing singleton*. Starting from the left, property value pairs are
% applied to the GUI before text1_OpeningFcn gets called. An
% unrecognized property name or invalid value makes property application
% stop. All inputs are passed to text1_OpeningFcn via varargin.
%
% *See GUI Options on GUIDE's Tools menu. Choose "GUI allows only one
% instance to run (singleton)".
%
% See also: GUIDE, GUIDATA, GUIHANDLES
% Edit the above text to modify the response to help text1
% Last Modified by GUIDE v2.5 27-May-2023 14:40:51
% Begin initialization code - DO NOT EDIT
gui_Singleton = 1;
gui_State = struct('gui_Name', mfilename, ...
'gui_Singleton', gui_Singleton, ...
'gui_OpeningFcn', @text1_OpeningFcn, ...
'gui_OutputFcn', @text1_OutputFcn, ...
'gui_LayoutFcn', [] , ...
'gui_Callback', []);
if value && ischar(value{1})
gui_State.gui_Callback = str2func(varargin{1});
end
if nargout
[varargout{1:nargout}] = gui_mainfcn(gui_State, varargin{:});
else
gui_mainfcn(gui_State, varargin{:});
end
% End initialization code - DO NOT EDIT
% --- Executes just before text1 is made visible.
function text1_OpeningFcn(hObject, eventdata, handles, varargin)
% This function has no output args, see OutputFcn.
% hObject handle to figure
% eventdata reserved - to be defined in a future version of MATLAB
% handles structure with handles and user data (see GUIDATA)
% varargin command line arguments to text1 (see VARARGIN)
% Choose default command line output for text1
handles.output = hObject;
% Update handles structure
guidata(hObject, handles);
% UIWAIT makes text1 wait for user response (see UIRESUME)
% uiwait(handles.figure1);
% --- Outputs from this function are returned to the command line.
function varargout = text1_OutputFcn(hObject, eventdata, handles)
% varargout cell array for returning output args (see VARARGOUT);
% hObject handle to figure
% eventdata reserved - to be defined in a future version of MATLAB
% handles structure with handles and user data (see GUIDATA)
% Get default command line output from handles structure
varargout{1} = handles.output;
function edit2_Callback(hObject, eventdata, handles)
% hObject handle to edit2 (see GCBO)
% eventdata reserved - to be defined in a future version of MATLAB
% handles structure with handles and user data (see GUIDATA)
% Hints: get(hObject,'String') returns contents of edit2 as text
% str2double(get(hObject,'String')) returns contents of edit2 as a double
% --- Executes during object creation, after setting all properties.
function edit2_CreateFcn(hObject, eventdata, handles)
% hObject handle to edit2 (see GCBO)
% eventdata reserved - to be defined in a future version of MATLAB
% handles empty - handles not created until after all CreateFcns called
% Hint: edit controls usually have a white background on Windows.
% See ISPC and COMPUTER.
if ispc && isequal(get(hObject,'BackgroundColor'), get(0,'defaultUicontrolBackgroundColor'))
set(hObject,'BackgroundColor','white');
end
function edit3_Callback(hObject, eventdata, handles)
% hObject handle to edit3 (see GCBO)
% eventdata reserved - to be defined in a future version of MATLAB
% handles structure with handles and user data (see GUIDATA)
% Hints: get(hObject,'String') returns contents of edit3 as text
% str2double(get(hObject,'String')) returns contents of edit3 as a double
% --- Executes during object creation, after setting all properties.
function edit3_CreateFcn(hObject, eventdata, handles)
% hObject handle to edit3 (see GCBO)
% eventdata reserved - to be defined in a future version of MATLAB
% handles empty - handles not created until after all CreateFcns called
% Hint: edit controls usually have a white background on Windows.
% See ISPC and COMPUTER.
if ispc && isequal(get(hObject,'BackgroundColor'), get(0,'defaultUicontrolBackgroundColor'))
set(hObject,'BackgroundColor','white');
end
% --- Executes on button press in pushbutton1.
function pushbutton1_Callback(hObject, eventdata, handles)
% hObject handle to Open (see GCBO)
% eventdata reserved - to be defined in a future version of MATLAB
% handles structure with handles and user data (see GUIDATA)
% open the file and read in
[filename,pathname]=uigetfile({'*.bmp;*.jpg;*.png;*.jpeg;*.tif'},'choose a picture','F:\test'); %Get picture address
str=[pathname filename]; % store file address
if isequal(filename,0)||isequal(pathname,0) % small part is prompt
warndlg('Please select a picture first!','Warning');
return;
else
handles.OriginalPic= imread(str); % read the original picture
axes(handles.axes1); % displayed in axes1
imshow(handles.OriginalPic);
end;
guidata(hObject,handles);
% hObject handle to pushbutton1 (see GCBO)
% eventdata reserved - to be defined in a future version of MATLAB
% handles structure with handles and user data (see GUIDATA)
% --- Executes on slider movement.
function slider1_Callback(hObject, eventdata, handles)
% hObject handle to slider1 (see GCBO)
% eventdata reserved - to be defined in a future version of MATLAB
% handles structure with handles and user data (see GUIDATA)
% Hints: get(hObject,'Value') returns position of slider
% get(hObject,'Min') and get(hObject,'Max') to determine range of slider
% --- Executes during object creation, after setting all properties.
function slider1_CreateFcn(hObject, eventdata, handles)
% hObject handle to slider1 (see GCBO)
% eventdata reserved - to be defined in a future version of MATLAB
% handles empty - handles not created until after all CreateFcns called
% Hint: slider controls usually have a light gray background.
if isequal(get(hObject,'BackgroundColor'), get(0,'defaultUicontrolBackgroundColor'))
set(hObject,'BackgroundColor',[.9 .9 .9]);
end
% --- Executes on slider movement.
function slider2_Callback(hObject, eventdata, handles)
% hObject handle to slider2 (see GCBO)
% eventdata reserved - to be defined in a future version of MATLAB
% handles structure with handles and user data (see GUIDATA)
% Hints: get(hObject,'Value') returns position of slider
% get(hObject,'Min') and get(hObject,'Max') to determine range of slider
% --- Executes during object creation, after setting all properties.
function slider2_CreateFcn(hObject, eventdata, handles)
% hObject handle to slider2 (see GCBO)
% eventdata reserved - to be defined in a future version of MATLAB
% handles empty - handles not created until after all CreateFcns called
% Hint: slider controls usually have a light gray background.
if isequal(get(hObject,'BackgroundColor'), get(0,'defaultUicontrolBackgroundColor'))
set(hObject,'BackgroundColor',[.9 .9 .9]);
end
% --- Executes on button press in pushbutton2.
function pushbutton2_Callback(hObject, eventdata, handles)
% Get the value in the corresponding edit control in the GUI interface
% Get the image in axes1
img=handles.OriginalPic
a = str2double(get(handles.edit2, 'String'));
b = str2double(get(handles.edit3, 'String'));
outputImg = a * double(img) + b;
axes(handles.axes2);
imshow(uint8(outputImg));
% hObject handle to pushbutton2 (see GCBO)
% eventdata reserved - to be defined in a future version of MATLAB
% handles structure with handles and user data (see GUIDATA)
% --- Executes on button press in pushbutton3.
function pushbutton3_Callback(hObject, eventdata, handles)
img=handles.OriginalPic;
[counts, bins] = imhist(rgb2gray(img));
% Draw a histogram in axes4
plot(handles.axes3, bins, counts);
% hObject handle to pushbutton3 (see GCBO)
% eventdata reserved - to be defined in a future version of MATLAB
% handles structure with handles and user data (see GUIDATA)
% --- Executes on button press in pushbutton4.
function pushbutton4_Callback(hObject, eventdata, handles)
img=handles.OriginalPic;
% Perform histogram equalization on the image
img_eq = histeq(rgb2gray(img));
% Display the equalized image in axes3
imshow(img_eq, 'Parent', handles.axes3);
% Compute the histogram of the equalized image
[counts_eq, bins_eq] = imhist(img_eq);
% Draw the equalized histogram in axes4
plot(handles.axes4, bins_eq, counts_eq);
% --- Executes during object creation, after setting all properties.
function axes1_CreateFcn(hObject, eventdata, handles)
% hObject handle to axes1 (see GCBO)
% eventdata reserved - to be defined in a future version of MATLAB
% handles empty - handles not created until after all CreateFcns called
set( gca, 'xtick', [] ); % remove the scale of the x-axis
set( gca, 'ytick', [] ); % remove the scale of the y-axis
% Hint: place code in OpeningFcn to populate axes1
% --- Executes during object creation, after setting all properties.
function axes2_CreateFcn(hObject, eventdata, handles)
% hObject handle to axes2 (see GCBO)
% eventdata reserved - to be defined in a future version of MATLAB
% handles empty - handles not created until after all CreateFcns called
set( gca, 'xtick', [] ); % remove the scale of the x-axis
set( gca, 'ytick', [] ); % remove the scale of the y-axis
% Hint: place code in OpeningFcn to populate axes2
% --- Executes during object creation, after setting all properties.
function axes3_CreateFcn(hObject, eventdata, handles)
% hObject handle to axes3 (see GCBO)
% eventdata reserved - to be defined in a future version of MATLAB
% handles empty - handles not created until after all CreateFcns called
set( gca, 'xtick', [] ); % remove the scale of the x-axis
set( gca, 'ytick', [] ); % remove the scale of the y-axis
% Hint: place code in OpeningFcn to populate axes3
% --- Executes on button press in pushbutton5.
function pushbutton5_Callback(hObject, eventdata, handles)
originalImage =handles.OriginalPic;
originalImage=rgb2gray(originalImage);
filterSize = str2double(get(handles.edit4, 'String'));
% apply mean filtering
meanFiltered = imfilter(originalImage, fspecial('average', [filterSize filterSize]));
% Display the filtered image in axes3 and axes4
axes(handles.axes5);
imshow(meanFiltered);
% hObject handle to pushbutton5 (see GCBO)
% eventdata reserved - to be defined in a future version of MATLAB
% handles structure with handles and user data (see GUIDATA)
% --- Executes on button press in pushbutton6.
function pushbutton6_Callback(hObject, eventdata, handles)
originalImage =handles.OriginalPic;
originalImage=rgb2gray(originalImage);
% Get the filter size from the edit box
filterSize = str2double(get(handles.edit4, 'String'));
% apply median filter
medianFiltered = medfilt2(originalImage, [filterSize filterSize]);
axes(handles.axes6);
imshow(medianFiltered);
% hObject handle to pushbutton6 (see GCBO)
% eventdata reserved - to be defined in a future version of MATLAB
% handles structure with handles and user data (see GUIDATA)
function edit4_Callback(hObject, eventdata, handles)
% hObject handle to edit4 (see GCBO)
% eventdata reserved - to be defined in a future version of MATLAB
% handles structure with handles and user data (see GUIDATA)
% Hints: get(hObject,'String') returns contents of edit4 as text
% str2double(get(hObject,'String')) returns contents of edit4 as a double
% --- Executes during object creation, after setting all properties.
function edit4_CreateFcn(hObject, eventdata, handles)
% hObject handle to edit4 (see GCBO)
% eventdata reserved - to be defined in a future version of MATLAB
% handles empty - handles not created until after all CreateFcns called
% Hint: edit controls usually have a white background on Windows.
% See ISPC and COMPUTER.
if ispc && isequal(get(hObject,'BackgroundColor'), get(0,'defaultUicontrolBackgroundColor'))
set(hObject,'BackgroundColor','white');
end
% --- Executes during object creation, after setting all properties.
function axes6_CreateFcn(hObject, eventdata, handles)
% hObject handle to axes6 (see GCBO)
% eventdata reserved - to be defined in a future version of MATLAB
% handles empty - handles not created until after all CreateFcns called
set( gca, 'xtick', [] ); % remove the scale of the x-axis
set( gca, 'ytick', [] ); % remove the scale of the y-axis
% Hint: place code in OpeningFcn to populate axes6
% --- Executes during object creation, after setting all properties.
function axes5_CreateFcn(hObject, eventdata, handles)
% hObject handle to axes5 (see GCBO)
set( gca, 'xtick', [] ); % remove the scale of the x-axis
set( gca, 'ytick', [] ); % remove the scale of the y-axis
% eventdata reserved - to be defined in a future version of MATLAB
% handles empty - handles not created until after all CreateFcns called
% Hint: place code in OpeningFcn to populate axes5
% --- Executes during object creation, after setting all properties.
function axes4_CreateFcn(hObject, eventdata, handles)
% hObject handle to axes4 (see GCBO)
set( gca, 'xtick', [] ); % remove the scale of the x-axis
set( gca, 'ytick', [] ); % remove the scale of the y-axis
% eventdata reserved - to be defined in a future version of MATLAB
% handles empty - handles not created until after all CreateFcns called
% Hint: place code in OpeningFcn to populate axes4
% --- Executes on button press in pushbutton7.
function pushbutton7_Callback(hObject, eventdata, handles)
res=imadd(handles.picture1,handles.picture2)
imshow(res, 'Parent', handles.axes10)
% hObject handle to pushbutton7 (see GCBO)
% eventdata reserved - to be defined in a future version of MATLAB
% handles structure with handles and user data (see GUIDATA)
% --- Executes on button press in pushbutton8.
function pushbutton8_Callback(hObject, eventdata, handles)
res=imsubtract(handles.picture1,handles.picture2)
imshow(res, 'Parent', handles.axes11)
% hObject handle to pushbutton8 (see GCBO)
% eventdata reserved - to be defined in a future version of MATLAB
% handles structure with handles and user data (see GUIDATA)
% --- Executes on button press in pushbutton9.
function pushbutton9_Callback(hObject, eventdata, handles)
[filename,pathname]=uigetfile({'*.bmp;*.jpg;*.png;*.jpeg;*.tif'},'choose a picture','F:\test'); %Get picture address
str=[pathname filename]; % store file address
if isequal(filename,0)||isequal(pathname,0) % small part is prompt
warndlg('Please select a picture first!','Warning');
return;
else
handles.picture1= imread(str); % read the original picture
axes(handles.axes8); % displayed in axes1
imshow(handles.picture1);
end;
guidata(hObject,handles);
% hObject handle to pushbutton9 (see GCBO)
% eventdata reserved - to be defined in a future version of MATLAB
% handles structure with handles and user data (see GUIDATA)
% --- Executes on button press in pushbutton10.
function pushbutton10_Callback(hObject, eventdata, handles)
[filename,pathname]=uigetfile({'*.bmp;*.jpg;*.png;*.jpeg;*.tif'},'choose a picture','F:\test'); %Get picture address
str=[pathname filename]; % store file address
if isequal(filename,0)||isequal(pathname,0) % small part is prompt
warndlg('Please select a picture first!','Warning');
return;
else
handles.picture2= imread(str); % read the original picture
axes(handles.axes9); % displayed in axes1
imshow(handles.picture2);
end;
guidata(hObject,handles);
% hObject handle to pushbutton10 (see GCBO)
% eventdata reserved - to be defined in a future version of MATLAB
% handles structure with handles and user data (see GUIDATA)