This is a help and solution to some common problems encountered in learning cv on ubuntu.
I will slowly add some things to the top
Article directory
- create new environment
- transfer files using scp command
- Convert dataset annotation format
- Install useful plugins on anaconda
- Use a crawler to download images from a website
- mmdetection learning method, how to get started with cv (most important)
- Visualize training results
- pycharm user manual
- Ubuntu common commands and common problems
- Frequently used websites
- write to new students
create new environment
Refer to
python to create a virtual environment (Anaconda, windows)
conda add mirror source
install module
1) conda list to see which packages are installed
2) conda env list or conda info -e to see which virtual environments currently exist
3) conda update conda checks to update the current conda
4) conda create -n env_name python=3.7 to create a virtual environment
5) source activate your_env_name activates the virtual environment
6) source deactivate your_env_name closes the virtual environment
7) conda install -n your_env_name [package] installs this package in your_env_name environment
8) conda remove -n your_env_name (virtual environment name) –all deletes the virtual environment
conda environment Copy:
1) Activate the environment (for example, the environment name is stylegan)
source activate stylegan
2) Export the environment
conda env export > stylegan.yaml
3) Install and copy the environment (note that only the package installed by conda can be obtained, and the package installed by pip needs to be exported once)
conda env create -f stylegan.yaml
Use new environment in jupyter
Refer to
python to create a virtual environment (Anaconda, windows)
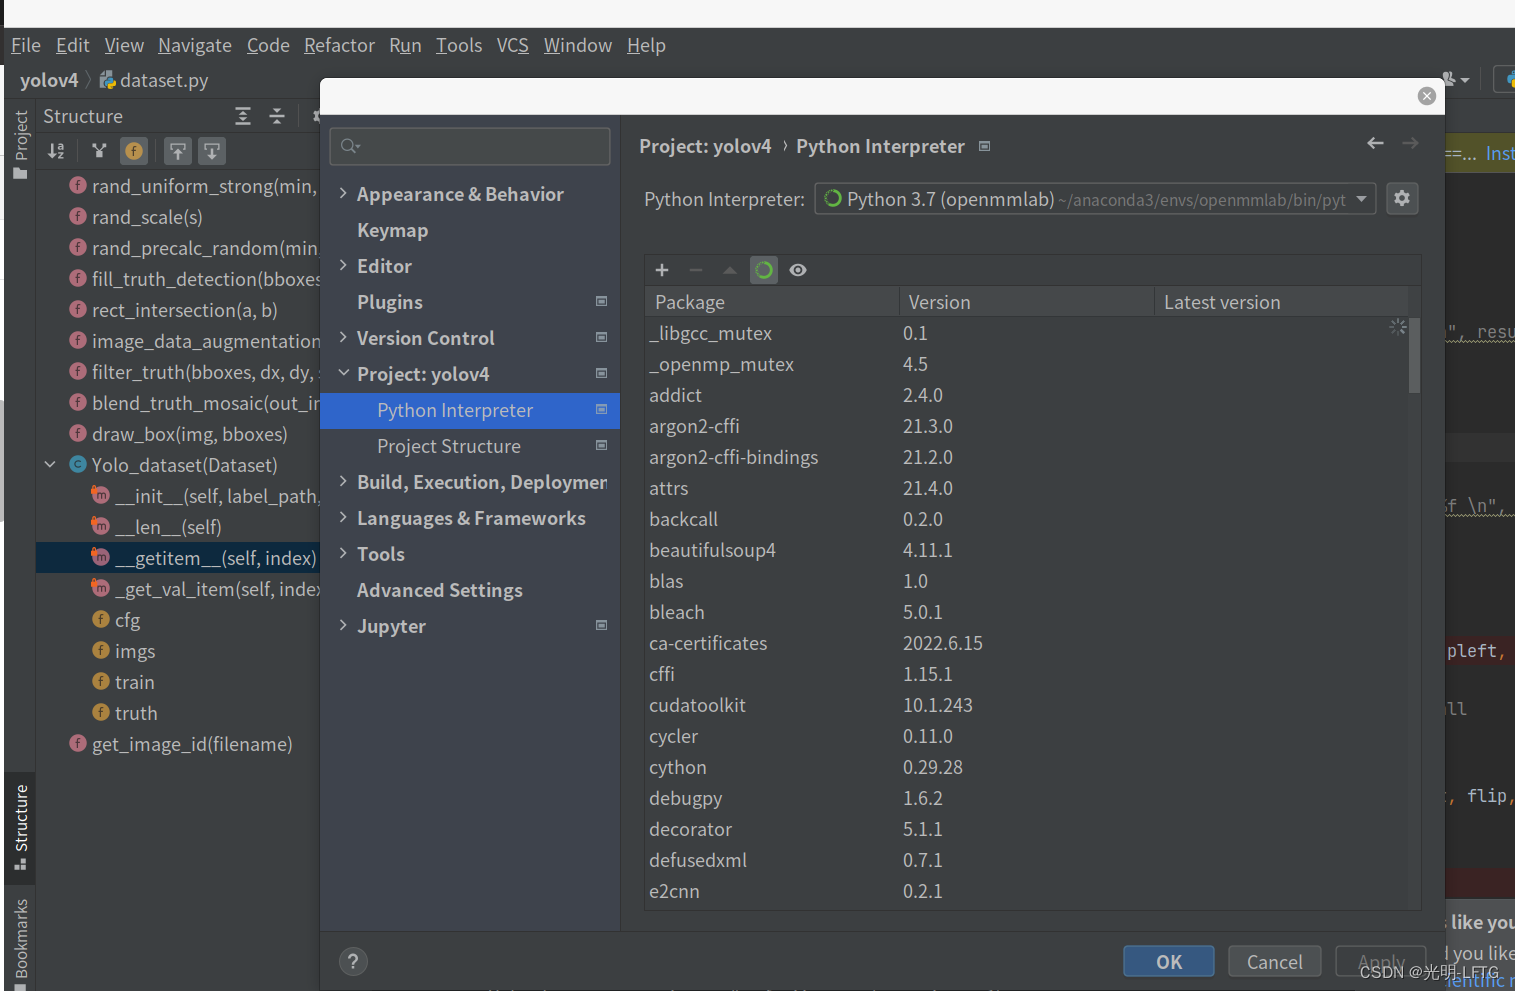
Use new environment in pycharm
- Write code using the new environment (similar to helping you automatically detect whether some modules exist when writing code)
- ctrl+alt+s to open settings
- Click on the project
- Click on the python interpreter
- Select the environment in the inverted triangle
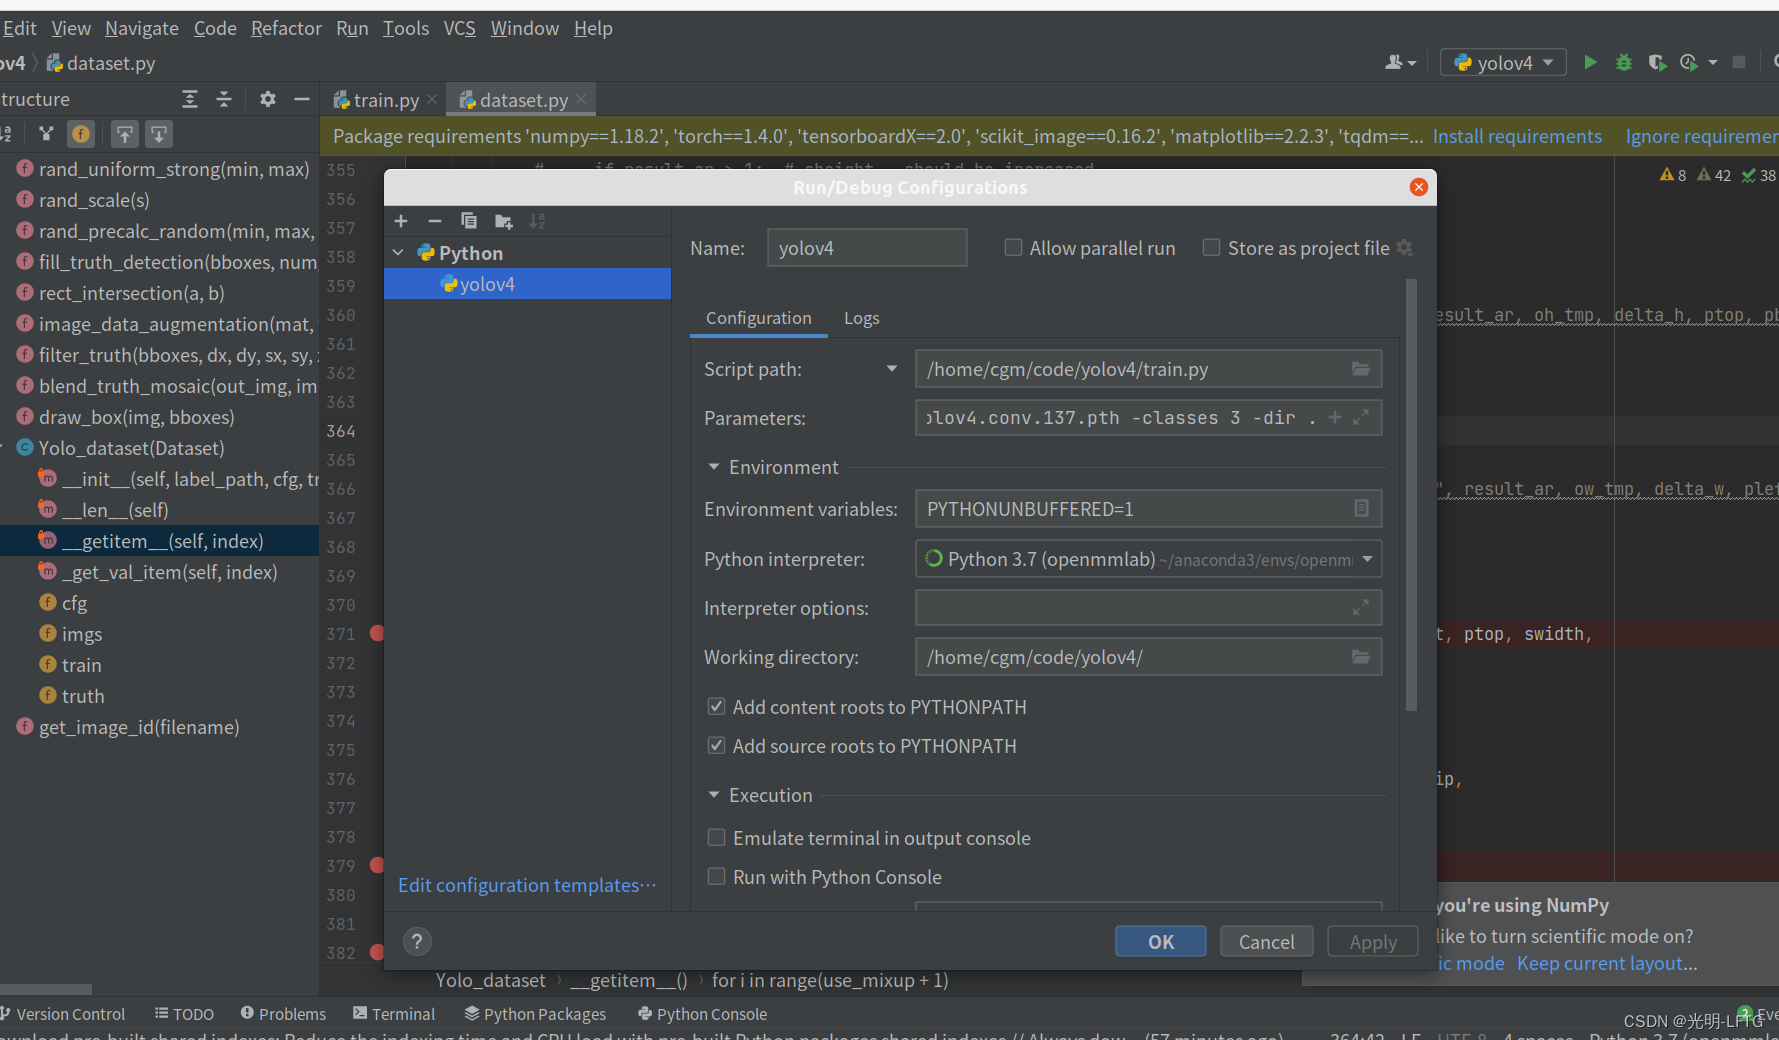
- Run the code using the new environment (run including debug)
- Click on the project name in the upper right corner (if not, it will be called add configuration in gray)
- Click the upper left corner + in the pop-up window (debug configuration)
- choose python
- Fill in the script path (this is the location of the program you want to run)
- parameters pass in parameters as needed, similar to the parameters passed in to the main function
- select environment
- Select a relative path (working directory)
transfer files using scp command
scp is used to directly transfer files between servers. Since linux does not have WeChat, you need to know the opposite network port, host name and password, and upload and download can be realized.
scp -P111111 -r file [email protected]:file
transfer files using scp command
Use mobaxterm to connect to the server
To be added
Convert dataset annotation format
Such as xml to json
such as txt to json
To be added
Install useful plugins on anaconda
Enter the following code in the anaconda prompt and restart jupyter
pip install jupyter_contrib_nbextensions
jupyter contrib nbextension install --user
After restarting, there will be a button on the right side of the clusters Configurable nbextensions,
you can choose to use some plug-ins
Code completion: Hinterland is undoubtedly one of the most useful plug-ins
The following are some very useful plug-ins
ExecuteTime - display execution time, Code prettify - format Beautify/beautify code
Use a crawler to download images from a website
To be added (preparing to make a video lecture)
mmdetection learning method, how to get started with cv (most important)
First talk about how to get started with cv, considering that the mainstream of deep learning is pytorch
-
1. Learn the basics of python (including data types 'commonly used functions including basic data types', structural statements, classes and objects, file processing, decorators, regularization statements, familiarity with and use of some important modules'opencv, numpy, torch , time, os, matplotlib, PIL.Image')
-
2. After many people learn some languages, they always feel that they have learned a lot but know nothing. At this time, you need to get started with some content, such as cv, and you need to start with general target detection. The learning route at this time is code + thesis . Start with classic articles (link) to learn other people's ideas and code writing.
-
3. Now, we are only one step away from getting started. After reading a lot of papers and knowing the basic operations, how do I write a target detection code by myself? In fact, a set of target detection code is quite cumbersome, read data dataloader, backbone, neck, head, loss, assigner, optimizer. Probably the second step before that, just a cursory glance at the code of the classic model. Here you need to carefully study a mature code framework (because each author has each author's writing style and style), to apply it, and learn most models, and also strengthen an overall understanding of neural networks. The mmdetection framework is recommended here, which is perfect (https://github.com/open-mmlab/mmdetection). At the beginning, I found this framework difficult to start, and it was very complicated. In fact, following the tutorials in the docs in the article, I can learn how to use this framework comprehensively in a week. Using this framework, try to make improvements in the existing models, and you will find this extremely convenient.
-
4. After getting familiar with mmdetecion, try to reproduce other people's open source network in the mmdetection framework, which will greatly strengthen your understanding of the framework and model.
-
5. At this point, congratulations on your successful introduction to cv.
Visualize training results
Suppose there is an annotation file, and the information in it is extracted by learning the annotation method of the annotation file.
It includes the bounding box and label information of the object in the picture. How to visualize it on the corresponding picture is the content of this section.
Using json files to visualize training results requires the use of plt.gca()
from matplotlib.collections import PatchCollection
from matplotlib.patches import Polygon
import os
from PIL import Image
import matplotlib.pyplot as plt
import numpy as np
#以下代码是为了演示,故而标注框使用的shape为4*1,实际上可以是4*n
bboxes=np.array([[100,200,700,800]])#x1,y1,x2,y2

#为了使用gca,需要定义画布,需要考虑到原图尺寸,比如按如下定义可使得画面为1920*1080
#如果要求保持一致的宽高,可以使用cv2模块读取图片,输出shape,保证figsize*dpi = shape即可
#此处的dpi代表图片的清晰度,也可以说是缩放比,在绘图时影响明显
#但是此处仅仅是把已有的图片放在画布上,因而不会影响清晰度。
plt.figure(figsize=(19.2,10.8), dpi=100,frameon=False)

#subplots_adjust可以控制绘制区域,如下的参数使得图片充满整个区域(不留白)
#默认left=0.125,r=0.9,t=0.9,b=0.1说明直接绘图保存会导致图片边界存在留白
plt.subplots_adjust(top=1, bottom=0, right=1, left=0)

#所有的绘图本质上都是在gca上进行的包括plt.plot
ax=plt.gca()
ax.axis('off')

#下面的部分实现了标注画在图上,如果自用的话,draw_bboxes不需要做修改,只需要保证输入维度正确
#ax.text实现了标注框打上类别注释,100,200为图片的<相对left-top坐标>(注意不是top-left)
#'label_text'可以输入你先输入的文字,可以使用python3的字符串的一些自带功能如f'{label_text}'使其更简洁
#下面的函数实现了draw_labels方法,可以套用,此处直接使用ax.text只是为了演示
draw_bboxes(ax,bboxes)
ax.text(
    100,
    200,
    'label_text',
    bbox={


        'facecolor': 'black',
        'alpha': 0.8,
        'pad': 0.7,
        'edgecolor': 'none'
    },
    color='g',
    fontsize=8,
    verticalalignment='top',
    horizontalalignment='left')

#可以替换为任何一个图像(注意box不要超过图片尺寸)
plt.imshow(Image.open("e:/1.jpg"))
plt.savefig('e:/2.jpg')
The following code demonstrates the effect of dpi on image quality
#测试dpi对图片的影响
x=np.arange(0.1,5,0.1)
y=x+1/x
figsize=[(15,7.5),(12,6),(8,4),(6,3)]
dpi=[80,100,150,200]

#验证dpi对于绘制的图片是否有影响(答案是有影响)
for i in range(4):
    plt.figure(figsize=figsize[i], dpi=dpi[i],frameon=False)
#     plt.subplots_adjust(top=1, bottom=0, right=1, left=0)
    ax=plt.gca()
    ax.axis('off')
    plt.plot(x,y)
    plt.savefig(f'e:/matplot/{

      i}.jpg')

#验证dpi对于直接读取的图片的放缩是否有影响(答案是无影响)
im=plt.imread('e:/matplot/3.jpg')
for i in range(4):
    plt.figure(figsize=figsize[i], dpi=dpi[i],frameon=False)
    plt.subplots_adjust(top=1, bottom=0, right=1, left=0)
    ax=plt.gca()
    ax.axis('off')
    plt.imshow(im)
    plt.savefig(f'e:/matplot/{

      i}{

      i}.jpg')
The following two functions come from mmdetection, which are the draw_bboxes and draw_labels methods. Learning to use them can make drawing more convenient and simple.
def draw_bboxes(ax, bboxes, color='g', alpha=0.8, thickness=2):
    """Draw bounding boxes on the axes.

    Args:
        ax (matplotlib.Axes): The input axes.
        bboxes (ndarray): The input bounding boxes with the shape
            of (n, 4).
        color (list[tuple] | matplotlib.color): the colors for each
            bounding boxes.
        alpha (float): Transparency of bounding boxes. Default: 0.8.
        thickness (int): Thickness of lines. Default: 2.

    Returns:
        matplotlib.Axes: The result axes.
    """
    polygons = []
    for i, bbox in enumerate(bboxes):
        bbox_int = bbox.astype(np.int32)
        poly = [[bbox_int[0], bbox_int[1]], [bbox_int[0], bbox_int[3]],
                [bbox_int[2], bbox_int[3]], [bbox_int[2], bbox_int[1]]]
        np_poly = np.array(poly).reshape((4, 2))
        polygons.append(Polygon(np_poly))
    p = PatchCollection(
        polygons,
        facecolor='none',
        edgecolors=color,
        linewidths=thickness,
        alpha=alpha)
    ax.add_collection(p)

    return ax

def draw_labels(ax,
                labels,
                positions,
                scores=None,
                class_names=None,
                color='w',
                font_size=8,
                scales=None,
                horizontal_alignment='left'):
    """Draw labels on the axes.

    Args:
        ax (matplotlib.Axes): The input axes.
        labels (ndarray): The labels with the shape of (n, ).
        positions (ndarray): The positions to draw each labels.
        scores (ndarray): The scores for each labels.
        class_names (list[str]): The class names.
        color (list[tuple] | matplotlib.color): The colors for labels.
        font_size (int): Font size of texts. Default: 8.
        scales (list[float]): Scales of texts. Default: None.
        horizontal_alignment (str): The horizontal alignment method of
            texts. Default: 'left'.

    Returns:
        matplotlib.Axes: The result axes.
    """
    for i, (pos, label) in enumerate(zip(positions, labels)):
        label_text = class_names[
            label] if class_names is not None else f'class {

      label}'
        if scores is not None:
            label_text += f'|{

      scores[i]:.02f}'
        text_color = color[i] if isinstance(color, list) else color

        font_size_mask = font_size if scales is None else font_size * scales[i]
        ax.text(
            pos[0],
            pos[1],
            f'{

      label_text}',
            bbox={


                'facecolor': 'black',
                'alpha': 0.8,
                'pad': 0.7,
                'edgecolor': 'none'
            },
            color=text_color,
            fontsize=font_size_mask,
            verticalalignment='top',
            horizontalalignment=horizontal_alignment)

    return ax
pycharm user manual
Select Interpreter
run settings
What should I do if the result does not appear in the middle of the breakpoint?
Preference --> python debugger --> Gevent compatible
Debug function introduction
Knowing that there is a very detailed introduction to the search for pycharm debug above
Ubuntu common commands and common problems
Most used software
(you can find it by searching online, remember to download the ubuntu version)
Rhythmbox music player (leisure)
pycharm (work)
edge (work+leisure)
Common commands
Create a folder named filename
mkdir filename
delete file
rm filename
delete folder
rm -r file
wheel sensitivity
killall imwheel
sudo vim ~/.imwheelrc
imwheel
Move files (folders) (can also be used to rename)
mv fromfile tofile
scp -r -P11111 DOTA1-split-1024 ubuntu@111:disk2/dataset
scp copy from remote to local (similar to above, change the position of the last two parameters)
scp remote@remote_ip:/home/root/others/music /home/space/music/1.mp3
View the number of folders in the current folder
ls -l|grep "^d"|wc -l
View the number of files in the current folder
ls -lR|grep “^-”| wc -l
Folder permissions problem
chmod -R 777 file
common problem
The file manager is stuck.
Find the ubuntu system monitor and kill the nautilus process. Similarly, pycharm, stuck, kill java process. ,
ssh cannot connect
to the problem of "Error: Network error: Connection refused", generally because Ubuntu has just installed the system, and the system lacks the openssh-server package, just enter the installation command in Ubuntu: sudoapt-get install openssh-server , you can install it.
When using ls to display files in the current directory, green in ubuntu represents executable files, blue represents folders (covered by shadows represent 777 permissions), red represents compressed files, yellow represents device files, and light blue represents link files , and white represents normal files.
df -h view space
github can't connect, need to go online scientifically
Frequently used websites
https://github.com/open-mmlab/mmdetection/blob/master/docs/zh_cn/article.md
write to new students
The teacher will ask everyone to write a weekly report, but each of us has a daily goal in our hearts! Only when there is a goal every day, the week will not be decadent. Organize your day!