This article provides a common-sense understanding of common algorithms for machine learning, introduces what these algorithms are and how they are applied (mainly for classification problems), and an introduction to the understanding of individual algorithms. The top ten algorithms to be introduced in this article are as follows: ①Decision tree; ②Random forest; ③Logistic regression; ④SVM (support vector machine); ⑤Naive Bayesian; ⑥K nearest neighbor algorithm; 10 Markov.
1. Decision tree
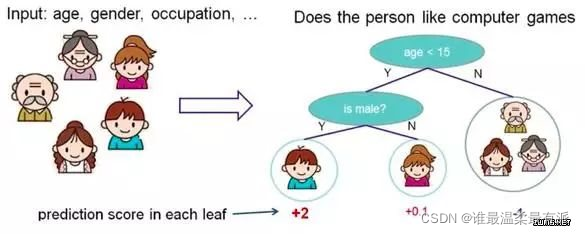
Classify according to some features, each node asks a question, divides the data into two categories through judgment, and continues to ask questions. These problems are learned based on existing data. When Zi ah puts in new data, he divides the data into appropriate leaves according to the problems on the tree.
2. Random Forest
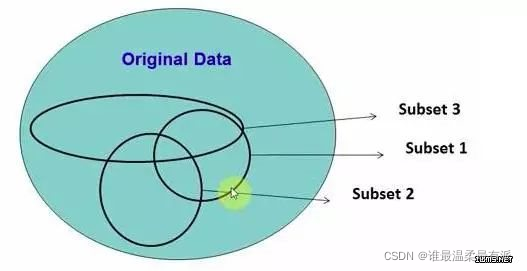
Randomly select data from the source data to form several subsets.
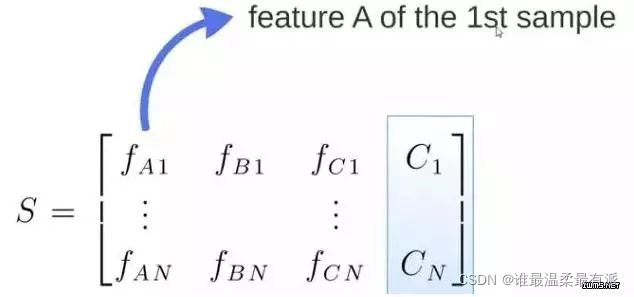
The s matrix is the source data, with 1-N pieces of data, ABC is the feature, and the last column C is the category.
M submatrices are randomly generated by S.
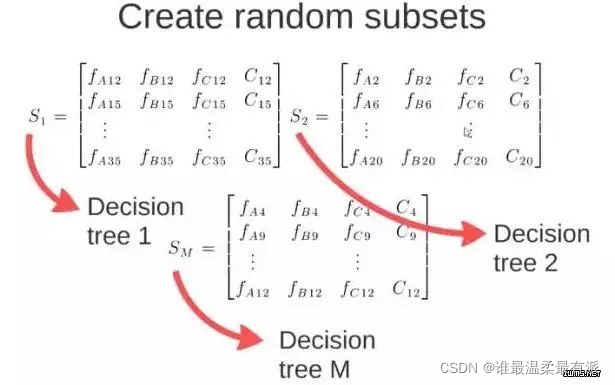
These M subsets get M decision trees.
Put new data into these M trees, get M classification results, count to see which category has the largest number of tests, and use this category as the final prediction result
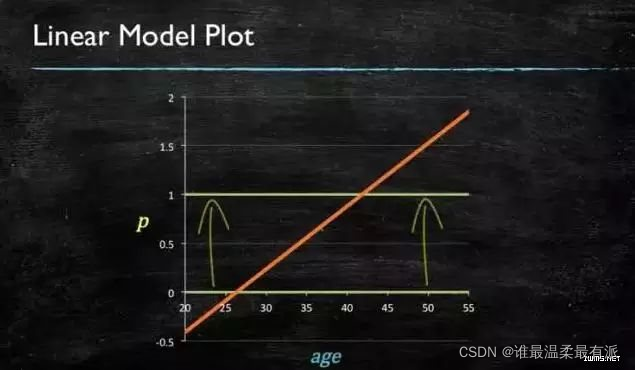
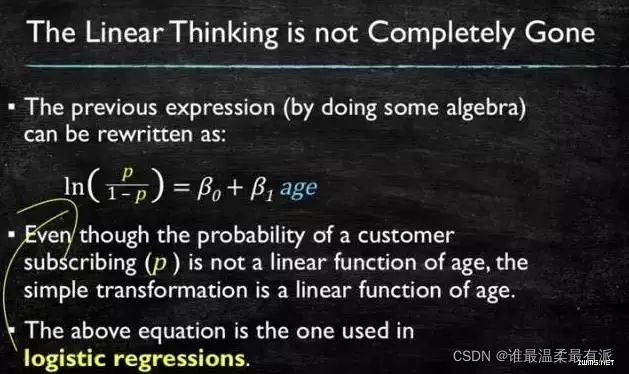
3. Logistic regression
When predicting the probability of the target number, the value range needs to be greater than or equal to 0 and less than or equal to 1. At this time, a simple linear model cannot do it, because when the definition domain is not within a certain range, the value range also exceeds Specify the interval.
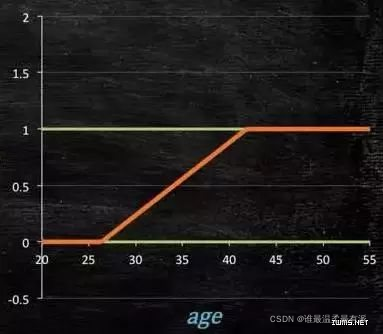
So it would be better to need a model with the following shape at this time.
The question is how to get such a model? Conditions: models greater than or equal to 0, less than or equal
to 1 and greater than or equal to 0 can choose absolute value, square value, here use exponential function,
models that must be greater than 0 and less than or equal to 1 can use division, the numerator is itself, and the denominator is itself plus 1, It must be less than 1
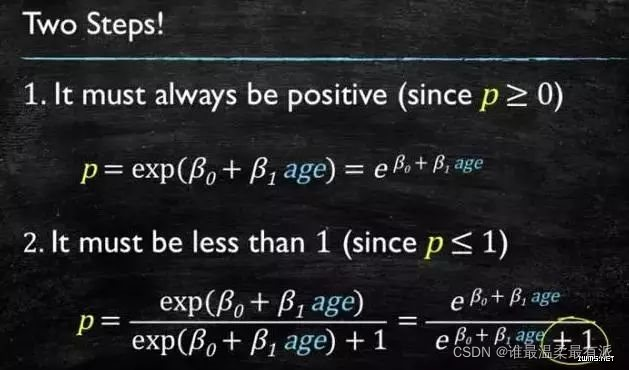
and then deformed to get the logistic regression model.
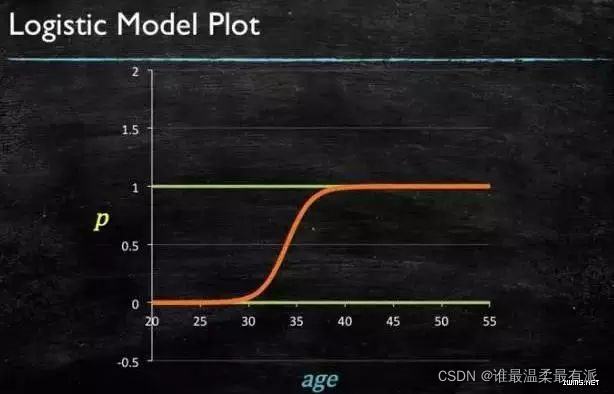
The corresponding coefficients can be obtained through the calculation of the source data,
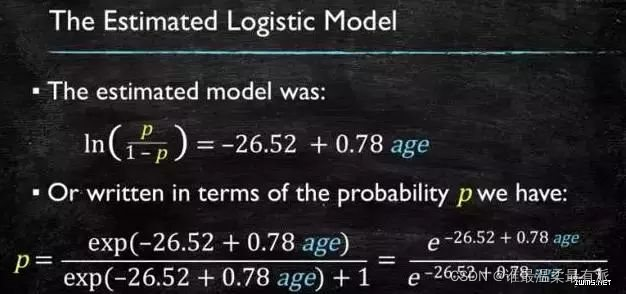
and finally the logistic graph is obtained.
4. SVM
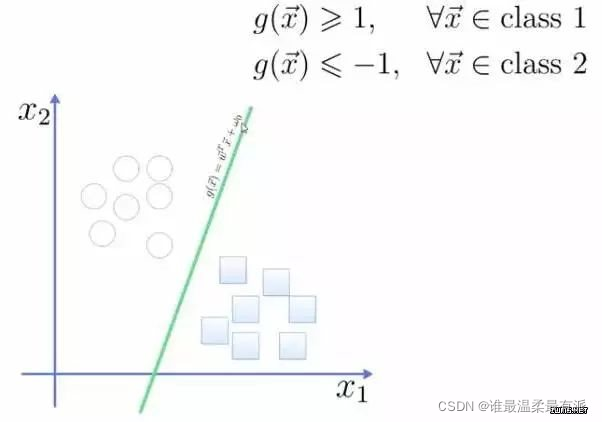
To separate the two categories, and to obtain a hyperplane, the optimal hyperplane is to reach the maximum margin of the two categories, and the margin is the distance between the hyperplane and the closest point to it, as shown in the figure below, so the green hyperplane is better
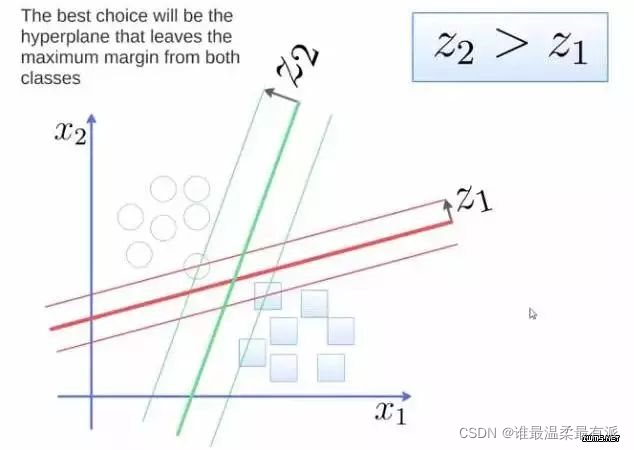
. This hyperplane is expressed as a linear equation. One class above the line is greater than or equal to 1, and the other class is less than or equal to -1. The
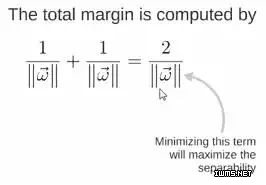
distance from the point to the plane is calculated according to the formula in the figure,

so the expression of the total margin is as follows, the goal is the maximum To optimize this margin, you need to minimize the denominator, which becomes an optimization problem.
For example: three points, find the optimal hyperplane, and define weight vector=(2,3)-(1,1)
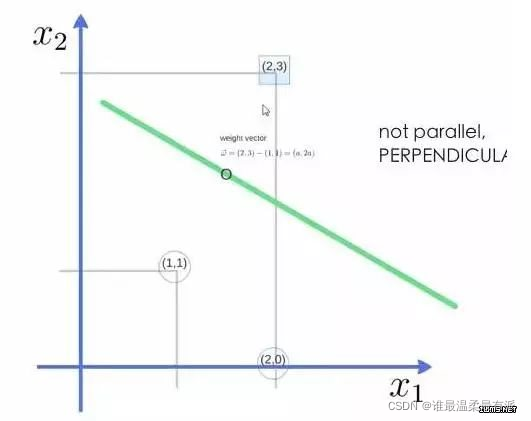
to get weight The vector is (a, 2a), bring two points into the equation, substitute (2, 3) and its value is equal to 1, and substitute (1, 1) and its value is equal to -1, and solve the value of a and intercept w0, Then get the expression of the hyperplane.
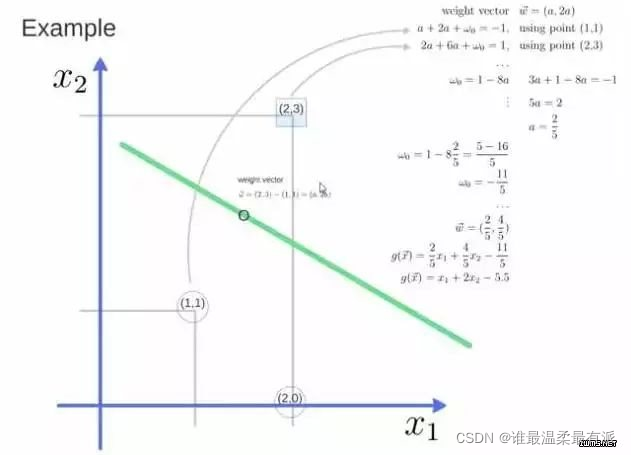
After a is obtained, the equation obtained by substituting (a, 2a) into (a, 2a) is the support vector
a and w0 into the hyperplane is the support vector machine
5. Naive Bayes
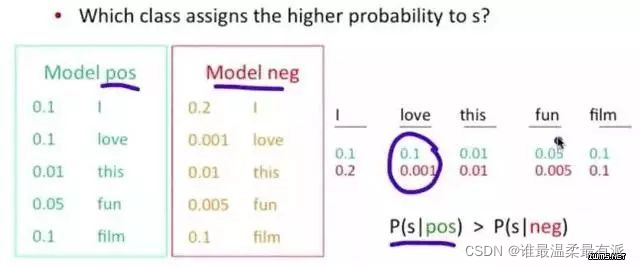
Take an application in NLP: give a piece of text, and return the sentiment classification, whether the attitude of this piece of text is positive or negative.
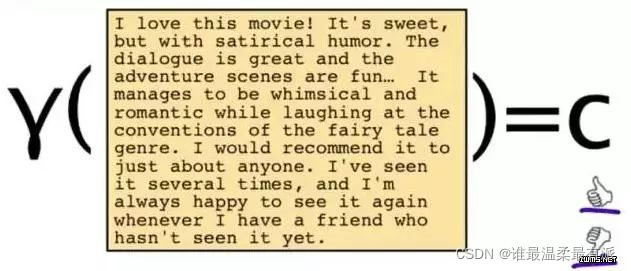
To solve this problem, you can only see some of the words.
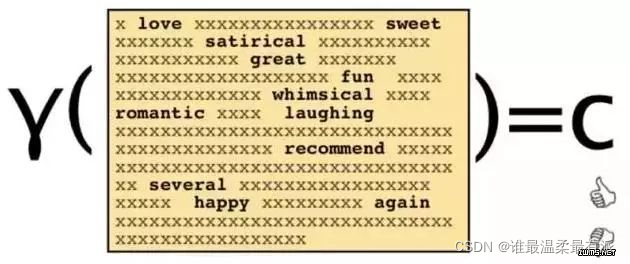
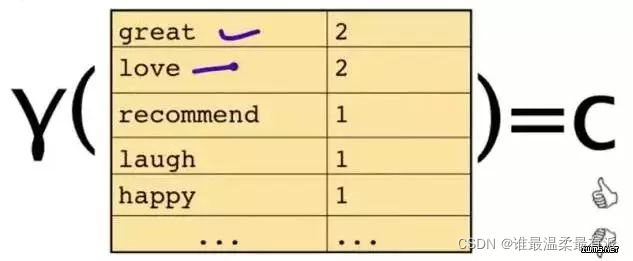
This piece of text will only be represented by some words and their counts
The original question is: Give you a sentence,
which category does it belong to? It becomes a relatively simple and easy problem to obtain through bayes rules
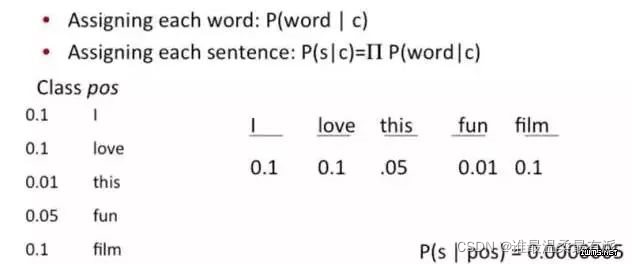
. The problem becomes, what is the probability of this sentence appearing in this category? Of course, don’t forget the formula The other two probabilities
Example: The probability of the word love appearing in the case of positive is 0.1, and the probability of appearing in the case of negative is 0.001
6. K nearest neighbor algorithm
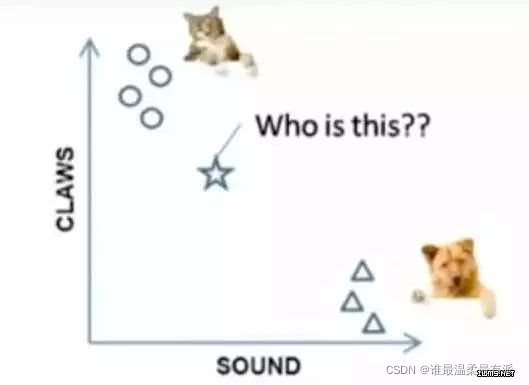
When a new data is given, among the nearest K points, which category is more, which category does this data belong to Example
: To distinguish cats and dogs, if judged by the two features of claws and sound, circles and triangles are It has already been classified, so which category does this star represent?
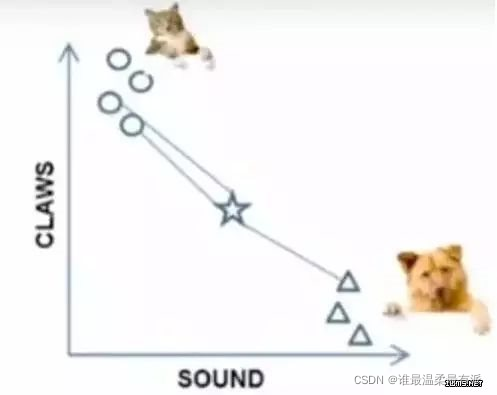
 When k=3, the points connected by these three lines are the nearest three points, so the circle is more, so this star belongs to the cat
7. K-means algorithm
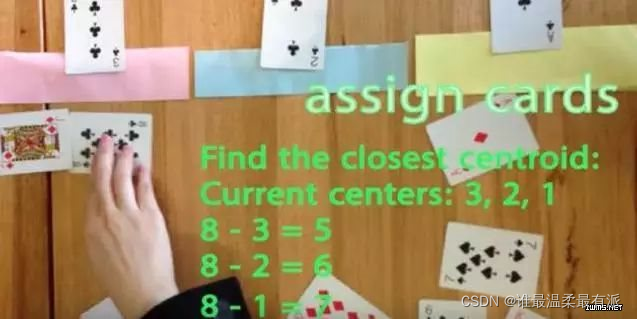
I want to divide a set of data into three categories, the pink value is large, and the yellow value is small. Initialize first, and choose the simplest 3, 2, 1 as the initial value of each type. In the remaining data, each of them is related to three Calculate the distance from each initial value, and then classify it into the category of the nearest initial value.
After classifying, calculate the average value of each category, as a new round of central store.
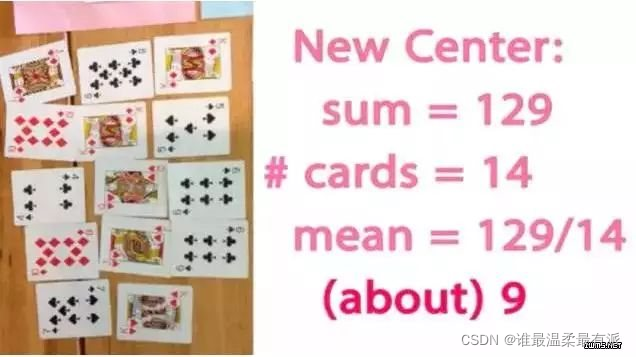
After a few rounds, the grouping is no longer changing, you can stop up


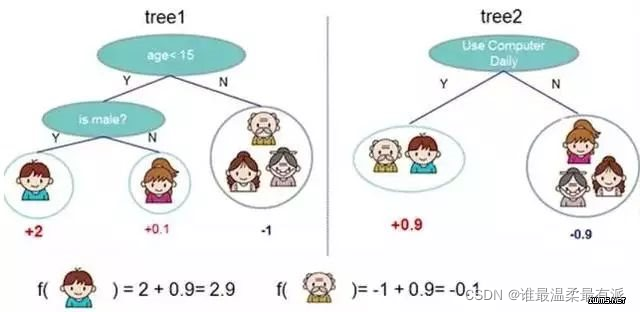
8. Adaboost
Adaboost is one of the methods of boosting.
Boosting is to combine several classifiers with poor classification effects into consideration, and you will get a classifier with a comparative effect
. Putting in the data and adding the two results together will increase the credibility
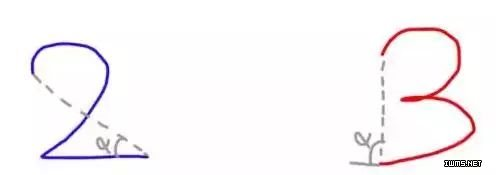
of the adaboost example. In handwriting recognition, many features can be captured on the drawing board, such as the direction of the starting point, the distance between the pilot point and the end point, etc.
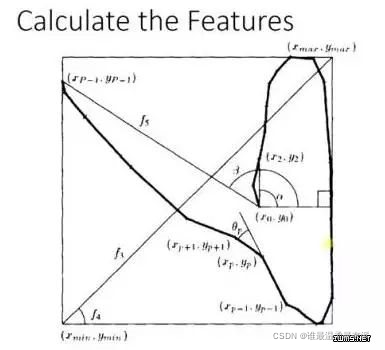
training When , you will get the weight of each feature. For example, the beginning of 2 and 3 are very similar. This feature has little effect on classification, and its weight will be small, and this alpha angle has a strong

recognition property, the weight of this feature will be larger, and the final prediction result is the result of comprehensive consideration of these features
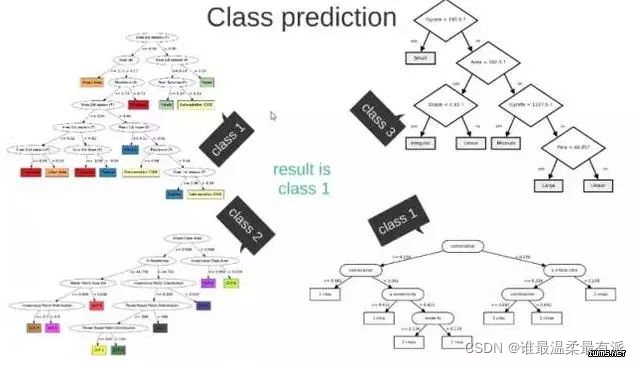
9. Neural Networks
Neural Networks is suitable for an input that may fall into at least two categories.
NN has several layers of neurons, and the connections between them. The
first layer is the input layer and the output layer has its own classifier.
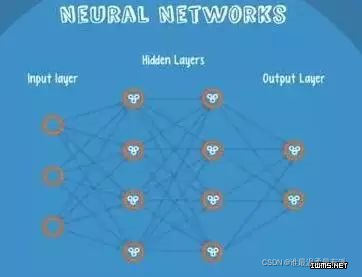
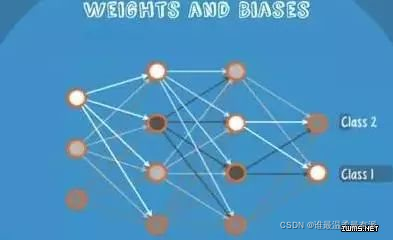
The input is input into the network and activated. The calculated score is passed to the next layer, and the subsequent neural layer is activated. Finally, the score on the node of the output layer represents the score belonging to each category. The example in the figure below shows that the classification result is class1. The same input is transmitted to different nodes
. So different results will be obtained because each child node has different weight and bias, which is forward propagation
10. Markov
Markov Chains are composed of states and transitions.
Example: According to the sentence "the quick brown fox jumps over the lazy dog", the
steps to get the markov chain: first set a state for each word, and then calculate the probability of transition between states
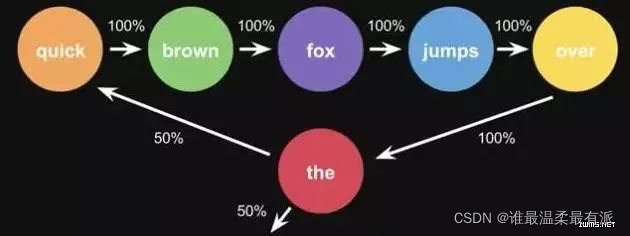
. It is the probability calculated by one sentence. When you use a large amount of text for statistics, you will get a larger state transition matrix, such as the words that can be connected after the, and the corresponding probability. The alternative results of the keyboard input method in life are
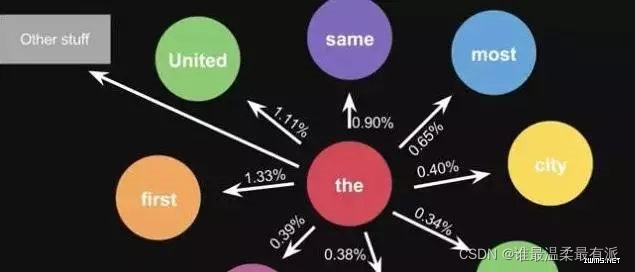
also The same principle, the model will be more advanced