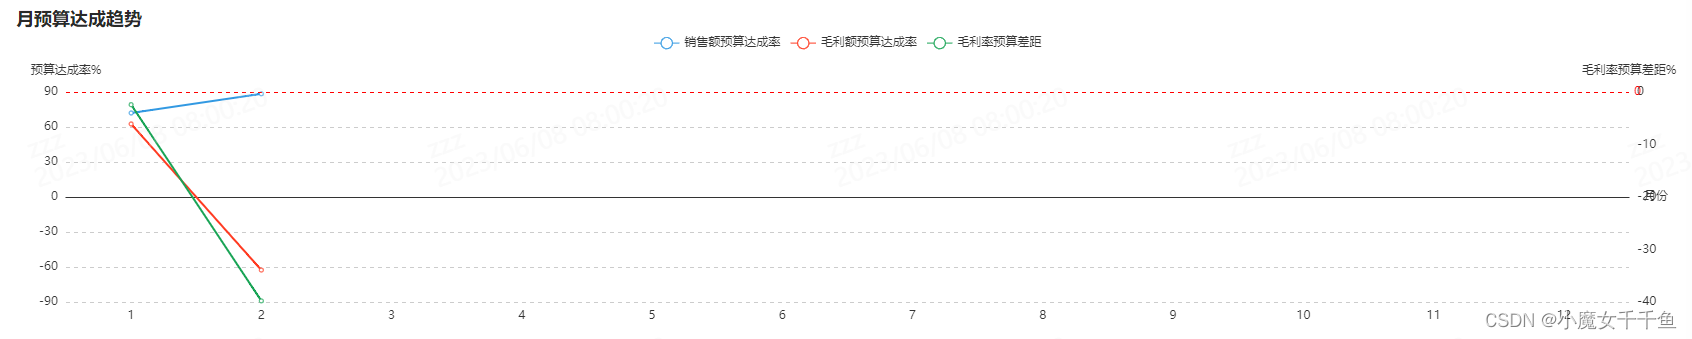
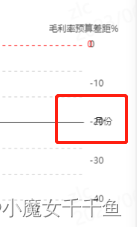
The problem is as follows:
        xAxis: {


          type: 'category',
          data: this.monthData,
          axisTick: {


            show: false
          },
          name:'月份',
          nameTextStyle: {


            padding: [0, 0, 0, 1550]
          },
          nameGap: 8, // x轴name与横坐标轴线的间距
          nameLocation: 'middle'
        },
code explanation
This code is an x-axis configuration of a histogram based on the echarts library, which includes the following properties:
- type: 'category' indicates that the type of the x-axis is category type, that is, the data is a discrete category.
- data: this.monthData indicates the data source of the x-axis, that is, each category on the abscissa.
- axisTick: { show: false } means that the axis tick marks are not displayed.
- name: 'month' indicates that the name of the x-axis is "month".
- nameTextStyle: { padding: [0, 0, 0, 1550] } Indicates the style of the x-axis name, where the padding attribute indicates the padding of the name, and [0, 0, 0, 1550] indicates the top, right, bottom, and left four The padding in each direction is 0, 0, 0, 1550 respectively.
- nameGap: 8 means that the distance between the x-axis name and the abscissa axis is 8 pixels.
- nameLocation: 'middle' indicates that the location of the x-axis name is in the middle.
This code is used to set the name style and position of the x-axis in the echarts chart. Among them, name represents the name of the x-axis, nameTextStyle represents the style of the name, padding represents the distance between the name and the chart, nameGap represents the distance between the name and the axis of the abscissa, nameLocation represents the position of the name, and here it is set to middle to represent the middle position of the x-axis .
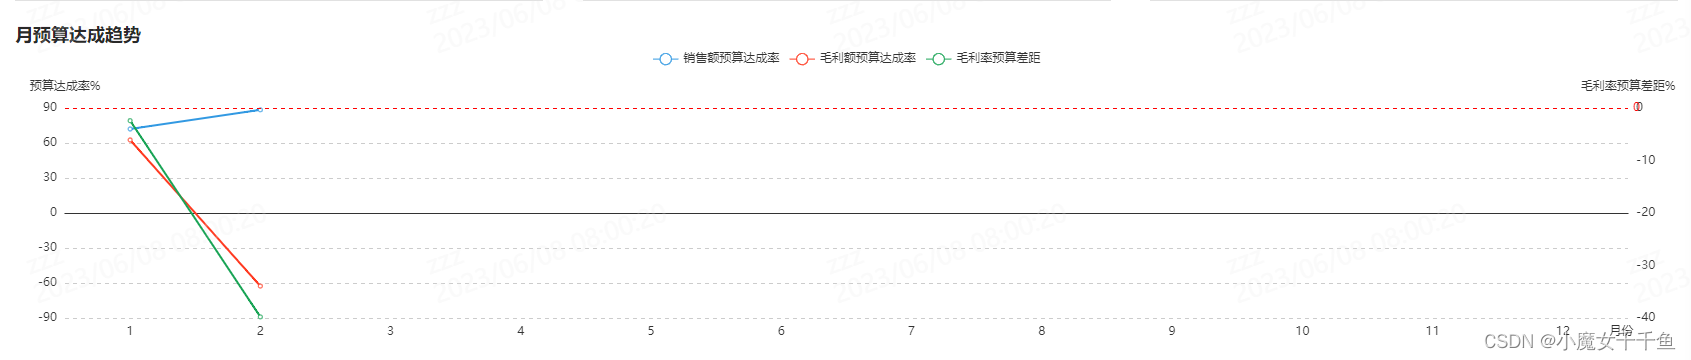
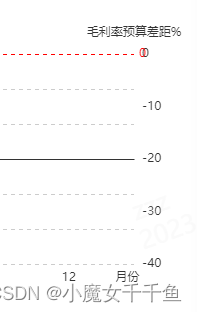
Adjusted effect:
write at the end
I hope my sharing can help more people. If you think my sharing is helpful, please support it with one click and three times. It is not easy to be
original, and I look forward to your attention and support.
Like ❤ + favorite ❤ + comment ❤
After that, I will continue to update the front-end learning knowledge, pay attention to me so that I don’t get lost~