Overview
For systems with elastic scaling and high availability, there is generally a large amount of indicator data that needs to be collected and stored. How to create a monitoring solution for such a system? This article describes how to build a monitoring system using Thanos+Prometheus+Grafana.
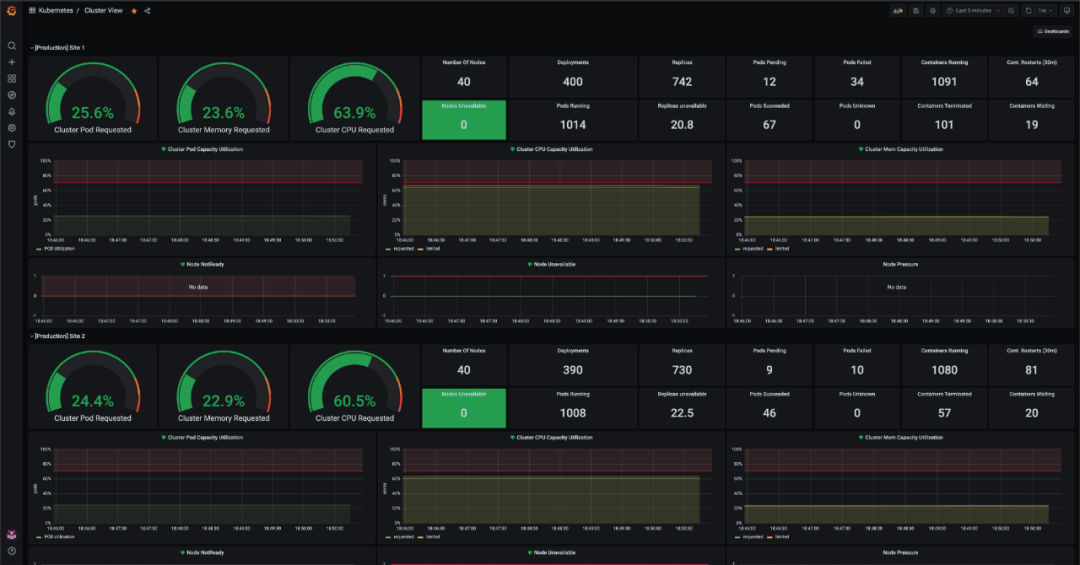
Overview of Cluster Capacity
user story
Until January of this year, I had been monitoring Kubernetes clusters with an enterprise-grade monitoring solution that was also used for APM. It feels natural to use, integrates with Kubernetes very easily with minor adjustments, and can integrate APM and infrastructure metrics.
While this monitoring solution can easily collect and store data, using metrics to create alerts has significant query limitations . Often the alerts we receive are different from what is displayed on the dashboard. Not to mention that we have 6 clusters and the number of metrics collected and stored is very high which adds to our economic cost to a large extent.
After some consideration, we realized that continuing to use this monitoring solution would do more harm than good. Time to replace our surveillance solution! But what product or tool to use? Grafana is the best option for visualization tools , but our "backend" needs to have elastic scalability and high availability. What tool should we use?
If you use OpenTSDB purely, the installation requires too much work and effort; stand-alone Prometheus does not provide replication capabilities, and you need to equip it with multiple databases; TimeScaleDB looks good, but I am not very good at using PostgreSQL.
After experimenting with some of the above solutions, I checked the CNCF website and finally found Thanos ! It meets all our needs: long-term data retention, replicable, highly available, suitable for microservices, has a global view of all clusters using the same database!
architecture
We have no persistent storage available on our cluster (all services remain stateless), so the default Prometheus + Thanos sidecar approach is not available and the metric storage must be placed outside the cluster. Furthermore, the clusters are isolated from each other, it is not possible to bind Thanos components to a specific set of clusters, and the clusters must be monitored from "outside".
To sum up, considering high availability and the possibility of Thanos running on a virtual machine, our final architecture is as follows:
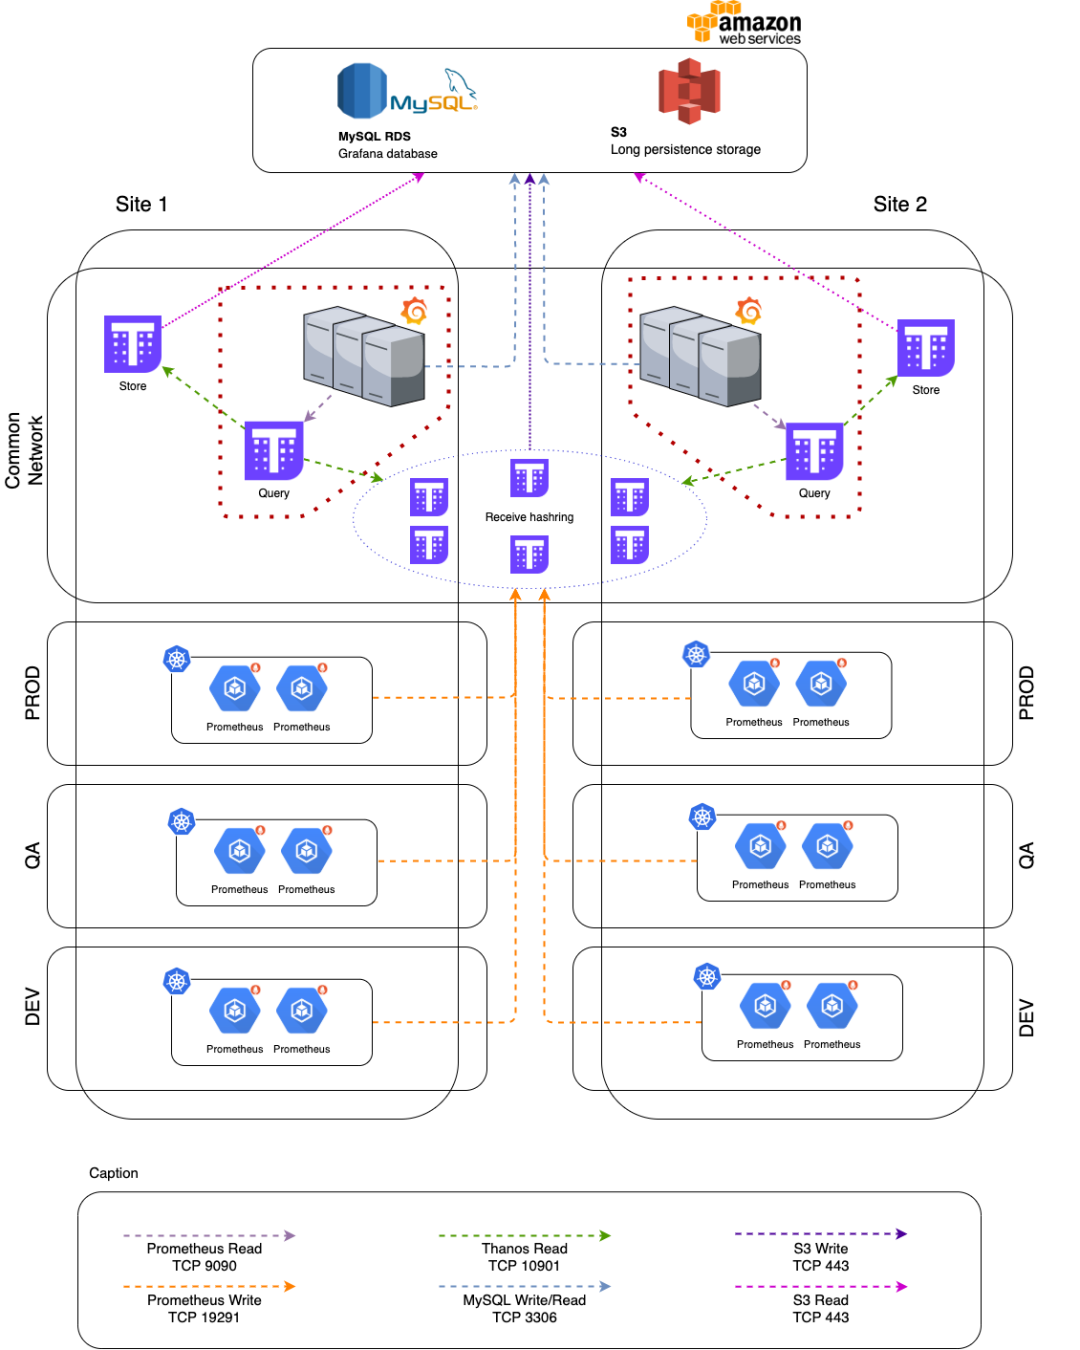
As shown in the figure, we have a multi-data center architecture. Each of these centers has a set of Grafana + Query servers, a set of storage servers and three Receive servers (half the number of clusters).
The database used by Grafana also has an AWS RDS. This database doesn't have to be huge (to keep costs down) and our team doesn't need to manage MySQL.
Among all the components provided by Thanos, we implemented 4 of them:
-
Receive : Responsible for TSDB, also manages replication between all servers running receive and upload of TSBD blocks to S3.
-
Query : Responsible for querying the receive database.
-
Store : Reads S3 for long-term metrics that are no longer stored in receive.
-
Compactor : Manages data downsampling and compression of TSDB blocks stored in S3.
data integration
Data ingestion for all clusters is managed by a dedicated Prometheus Pod running within the cluster . It collects metrics from the control plate (API server, controller, and scheduler), etcd cluster, and pods within the cluster with metrics related to the infrastructure and Kubernetes itself (Kube-proxy, Kubelet, Node Exporter, State Metrics , Metrics Server, and other Pods with scraping annotations).
The Prometheus Pod then sends the information to one of the receive servers that manage the TSDB with the remote storage configuration.
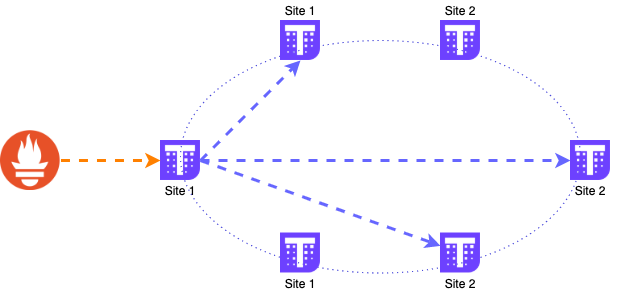
data ingestion
All data is sent to a single server and then replicated to other servers. The DNS address used by Prometheus is a DNS GSLB that probes each receive server and balances DNS resolution among healthy servers, sharing the load among all servers because DNS resolution only provides one IP for each DNS query.
It should be emphasized that the data must be sent to a single receive instance and let it manage the replication, sending the same metric will cause the replication to fail and misbehave .
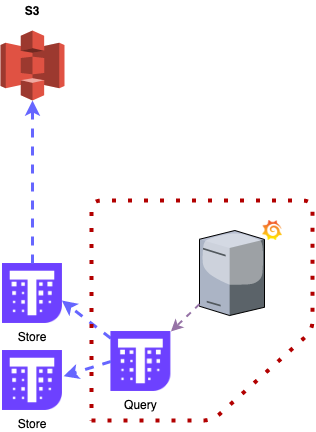
At this level, metrics are also uploaded to an S3 bucket for long-term retention. Receive uploads a block every 2 hours (when each TSDB block is closed), and these metrics can be used for queries using the Store component.
You can also set the retention time for local data. In this case, all local data is retained for 30 days for daily use and troubleshooting, which speeds up queries .
Data older than 30 days is only available on S3 and is retained for up to 1 year for long-term evaluation and comparison.
data query
Data is collected and stored in the receiver for querying. This part is also set to be available in multiple datacenters.
With each server running Grafana and Query, if one (or both) goes down, we can more easily identify and remove it from the load balancer. In Grafana, the data source is configured as localhost, so it always uses local Query to fetch data.
For query configuration, it must know all servers (Receiver and Store) that store metrics. The query component knows which servers are online and can collect metrics from them.
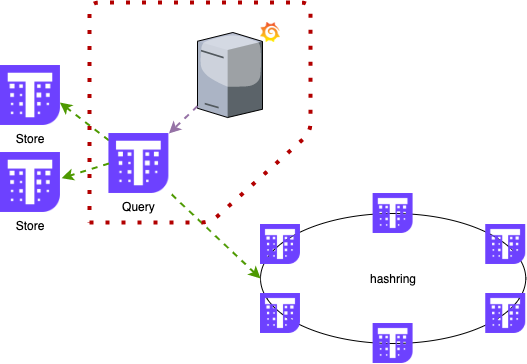
data query
It also manages deduplication, since it queries all servers and configures replication, all metrics have multiple copies. --query.replica-label=QUERY.REPLICA-LABELThis can be done using labels and query parameters ( ) assigned to metrics . With these configurations, the query component knows whether the metrics collected from Receiver and Store are duplicated and uses only one data point.
long term data
As mentioned earlier, data is kept locally for up to 30 days, everything else is stored on S3. This reduces the amount of space required on the Receiver and reduces costs since block storage is more expensive than object storage. Not to mention querying data longer than 30 days is not very common and is mostly used for resource usage history and forecasting.
remote data query
The Store also keeps a local copy of the index for each TSDB chunk stored on the S3 bucket, so if it needs to query more than 30 days of data, it knows which chunks to download and use to serve the data.
Data situation
Considering all clusters, the monitoring scheme:
-
Monitored 6 Kubernetes clusters;
-
Collected metrics of 670 services;
-
246 servers were monitored using Node Exporter;
-
Collect about 27w indicators per minute;
-
Ingest approximately 7.3 GB of data per day, or approximately 226.3 GB of data per month;
-
Created 40 dedicated dashboards for Kubernetes components;
-
116 alarms are created on Grafana.
For the monthly fee, with most components running on-premises, the cost was reduced by 90.61% , from $38,421.25 to $3,608.99 per month, which includes AWS service costs.
Summarize
It took about a month or so to configure and set up the above architecture, including testing some other solutions, validating the architecture, implementing, turning on collection on the cluster, and creating all the dashboards.
In the first week, the benefits were evident. Monitoring clusters has become easier, dashboards can be quickly built and customized, collecting metrics is almost plug-and-play, most applications export metrics in Prometheus format, and automatically collect based on annotations.
In addition, finer team permission control can be achieved by integrating Grafana's LDAP. Developers and SREs have access to a large number of dashboards with relevant metrics about their namespace, ingress, etc.