Article Directory
- foreword
- First met Sentinel
- Two test tools: Jmeter
- Three flow control
- 4 Isolation and downgrade
- Five Authorization Rules
- Six Rules for Persistence

foreword
- This article is learned from a dark horse programmer, and most of the content comes from the microservices course! ! !
- The significance of this article lies in the learning records. Although the learning documents of Dark Horse are very detailed, because the courses cannot be always up-to-date, there are certain differences in the versions of tools and content used for learning! !
- This article is based on the dark horse tutorial, and will record and supplement the details for later learners! ! !
- There are deficiencies in the article, thank you for your corrections! ! !
- In the second half of the article, the editor will not repeat the part about the actual operation! ! ! For the operating part, be sure to get your hands dirty! ! !
First met Sentinel
1.1 Avalanche problem
-
In microservices, the call relationship between services is intricate, and a microservice often depends on multiple other microservices
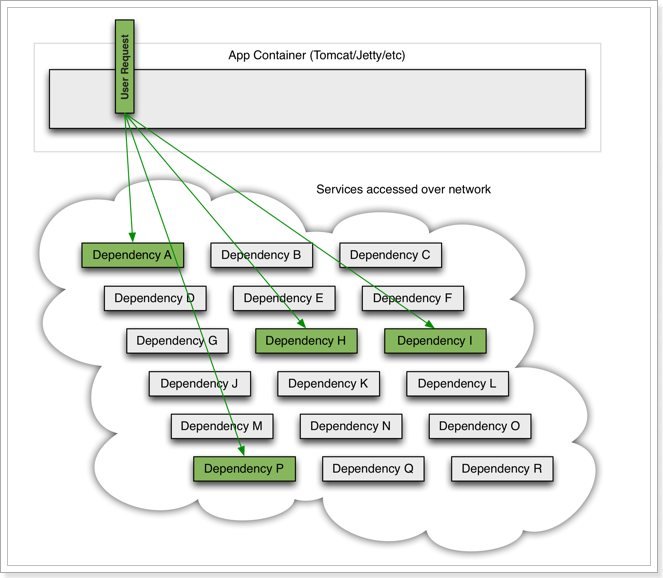
-
As shown in the figure, if service provider I fails, part of the business of the current application will also be blocked because it depends on service I. At this time, other services that do not depend on Service I seem to be unaffected.
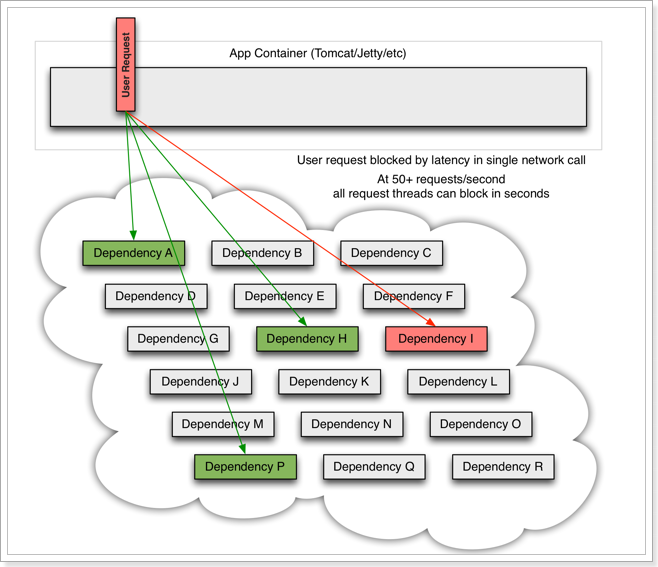
-
However, the business request that depends on service I is blocked, and the user will not get a response, so the thread of tomcat will not be released, so more and more user requests arrive, and more and more threads will be blocked:
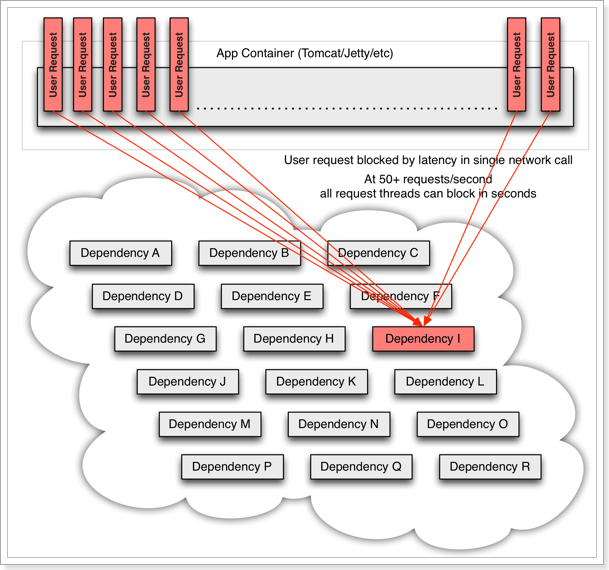
-
The number of threads and concurrency supported by the server is limited. If the request is blocked all the time, the server resources will be exhausted, and all other services will be unavailable, so the current service will also be unavailable. Then, other services that depend on the current service will eventually become unavailable over time, forming cascading failures, and an avalanche occurs
-
A service failure in the microservice call link causes all microservices in the entire link to be unavailable, which is an avalanche.

1.2 Solutions
- There are four common ways to solve the avalanche problem:
- Timeout processing : set the timeout period, the request will return an error message if there is no response after a certain period of time, and will not wait endlessly
- Bulkhead mode : Limit the number of threads that each business can use to avoid exhausting the resources of the entire tomcat, so it is also called thread isolation.
- Fuse degradation : The abnormal proportion of business execution is counted by the circuit breaker. If the threshold is exceeded, the business will be fused and all requests to access the business will be intercepted.
- Flow control : QPS to limit business access to avoid service failure due to sudden increase in traffic.
- Timeout processing
- Set the timeout period, the request will return an error message if there is no response after a certain period of time, and will not wait endlessly

- Set the timeout period, the request will return an error message if there is no response after a certain period of time, and will not wait endlessly
- Silo mode
- The cabin wall mode comes from the design of the cabin: the cabin will be separated into multiple independent spaces by partitions. When the hull is damaged, only part of the space will enter, and the failure will be controlled within a certain range to prevent the entire hull from being submerged.
- Limit the number of threads that each business can use to avoid exhausting the resources of the entire tomcat, so it is also called thread isolation.

- breaker
- The abnormal proportion of business execution is counted by the circuit breaker. If the threshold is exceeded , the business will be fused and all requests to access the business will be intercepted.
- The circuit breaker will count the number of requests to access a certain service and the abnormal ratio. When the abnormal ratio of requests to access service D is found to be too high, it believes that service D has the risk of causing an avalanche, and will intercept all requests to access service D to form a circuit breaker.

- flow control
- QPS that restricts business access to avoid service failures due to traffic surges.

- QPS that restricts business access to avoid service failures due to traffic surges.
1.3 Summary
- Avalanche problem: Microservices call each other, because a service failure in the call chain causes the entire link to be inaccessible.
- Current limiting is the protection of services, avoiding service failures caused by instantaneous high concurrent traffic, thereby avoiding avalanches. is a precautionary measure.
- Timeout processing, thread isolation, and downgrade fuse are used to control the fault within a certain range and avoid avalanches when some services fail. is a remedy .
1.4 Comparison of Service Protection Technologies
Multiple service protection technologies are supported in Spring Cloud:
The Hystrix framework was more popular in the early days, but currently the most widely used in China is the Sentinel framework of Alibaba. Here we make a comparison:
| Sentinel | Hystrix | |
|---|---|---|
| isolation strategy | Semaphore isolation | Thread pool isolation/semaphore isolation |
| Circuit breaker downgrade strategy | Based on slow call ratio or abnormal ratio | Based on failure rate |
| Real-time indicator implementation | sliding window | Sliding window (based on RxJava) |
| rule configuration | Support multiple data sources | Support multiple data sources |
| Scalability | multiple extension points | plug-in form |
| Annotation-based support | support | support |
| Limiting | Based on QPS, support current limiting based on call relationship | limited support |
| traffic shaping | Support slow start, uniform queuing mode | not support |
| System Adaptive Protection | support | not support |
| console | Out of the box, you can configure rules, view second-level monitoring, machine discovery, etc. | imperfect |
| Adaptation to Common Frameworks | Servlet、Spring Cloud、Dubbo、gRPC 等 | Servlet、Spring Cloud Netflix |
1.5 Introduction to Sentinel
- Sentinel is a microservice traffic control component open sourced by Alibaba. Official website address
- Sentinel has the following characteristics:
• Rich application scenarios : Sentinel has undertaken the core scenarios of Alibaba's Double Eleven traffic promotion in the past 10 years, such as seckill (that is, burst traffic is controlled within the range that the system capacity can bear), message peak shaving Valley filling, cluster flow control, real-time fusing of downstream unavailable applications, etc.
• Complete real-time monitoring : Sentinel also provides real-time monitoring functions. In the console, you can see the second-level data of a single machine connected to the application, or even the aggregated running status of a cluster with a scale of less than 500.
• Extensive open source ecosystem : Sentinel provides out-of-the-box integration modules with other open source frameworks/libraries, such as integration with Spring Cloud, Dubbo, and gRPC. You only need to introduce the corresponding dependencies and perform simple configurations to quickly access Sentinel.
• Perfect SPI extension point : Sentinel provides easy-to-use and complete SPI extension interface. You can quickly customize the logic by implementing the extension interface. For example, custom rule management, adaptation of dynamic data sources, etc.
1.6 Sentinel installation
- Sentinel version selection:
- If the JDK you are using is 1.8, you can use the jar package in the data
- If your JDK is newer, please go to GitHub to download the latest version! ! !
- run
- Put the jar package in any non-Chinese directory and execute the command:
java -jar sentinel-dashboard-x.x.x.jar- If you want to modify Sentinel's default port, account, and password, you can use the following configuration:
| configuration item | Defaults | illustrate |
|---|---|---|
| server.port | 8080 | service port |
| sentinel.dashboard.auth.username | sentinel | default username |
| sentinel.dashboard.auth.password | sentinel | default password |
- For example, to modify the port:
java -Dserver.port=8090 -jar sentinel-dashboard-x.x.x.jar
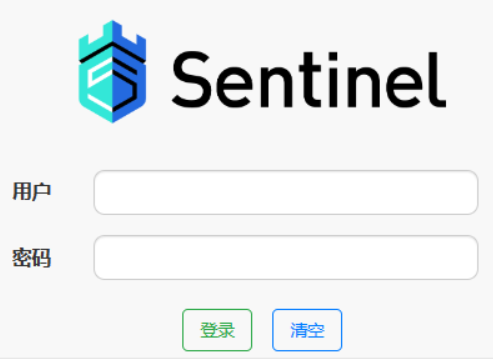
- access
- Visit the http://localhost:8080 page, you can see the sentinel console
- You need to enter the account number and password, the default is: sentinel
- After logging in, I found a blank, nothing: because it has not been integrated with microservices
1.7 Microservice Integration Sentinel
- To integrate sentinel in the microservice project and connect to sentinel's console, the steps are as follows:
- Introduce sentinel dependency
<!--sentinel--> <dependency> <groupId>com.alibaba.cloud</groupId> <artifactId>spring-cloud-starter-alibaba-sentinel</artifactId> </dependency> - configuration console
- Modify the application.yaml file and add the following content
server: port: 8088 spring: cloud: sentinel: transport: dashboard: localhost:8080 #连接到sentinel 如果你的sentinel是在linux中启动的,请修改为linux的IP - Access any endpoint of a microservice project
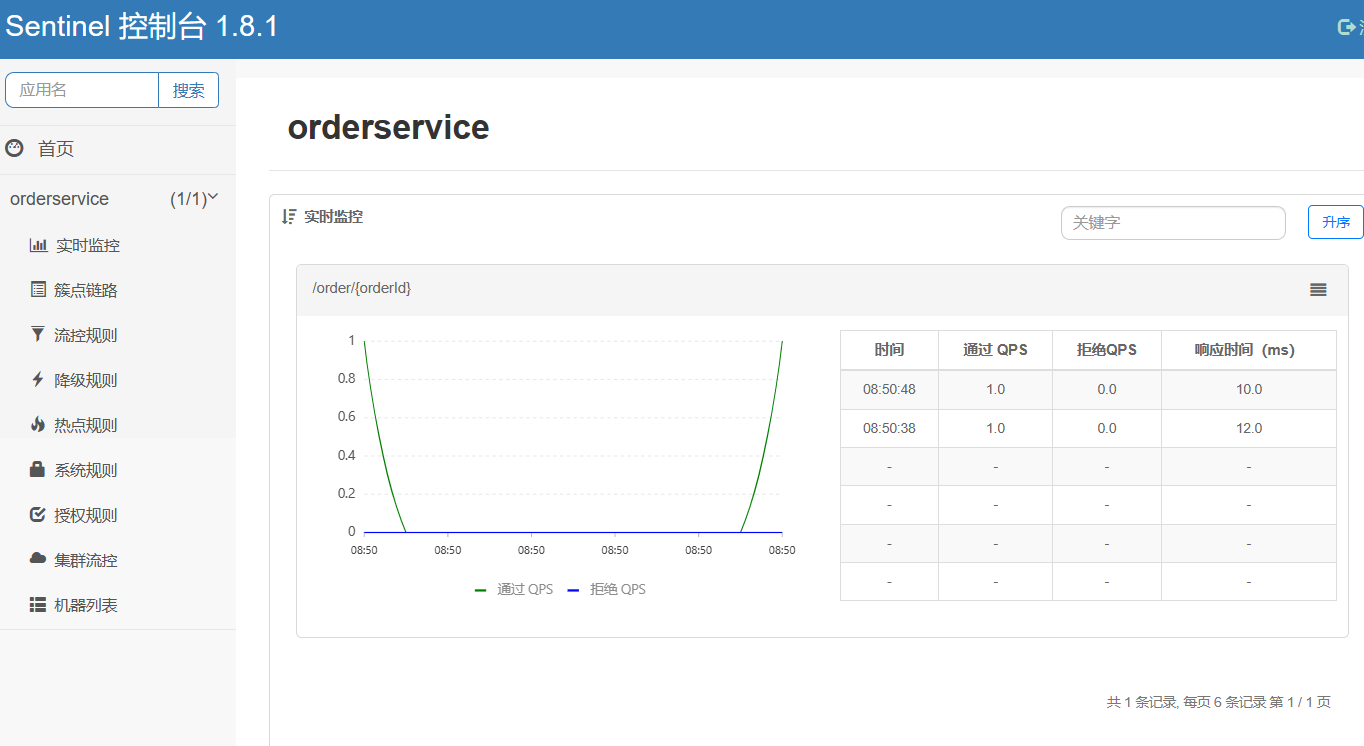
- Open the browser and visit http://localhost:8088/order/101, so as to trigger the monitoring of sentinel.
- Then visit the sentinel console to see the effect
- For follow-up testing, the testing tool used is Jmeter, so learn the following installation and use of Jmeter
Two test tools: Jmeter
- Jmeter depends on JDK, so you must ensure that JDK is installed on the current computer and the environment variables are configured
2.1 Jmeter installation and configuration
- It can be downloaded from Apache Jmeter official website, address
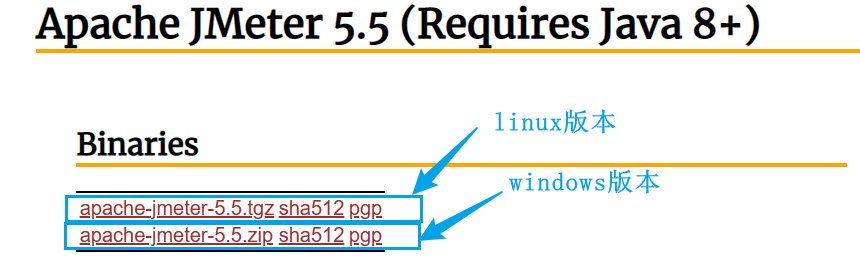
- decompress
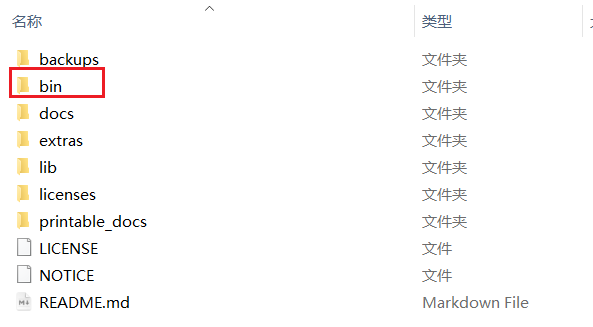
- The bin directory is the executed script, which contains the startup script:
- Double-click to run, but there are two points to note:
- The startup speed is relatively slow, so be patient
- The black window cannot be closed after startup, otherwise Jmeter will also be closed
2.2 JMeter quick start
2.2.1 Set Chinese language
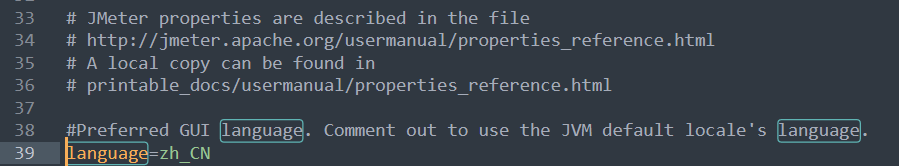
- 方式一:永久中文,打开jmeter文件夹,在bin目录中找到 **jmeter.properties**,添加下面配置:
- **注意:前面不要出现#,#代表注释,另外这里是下划线,不是中划线**
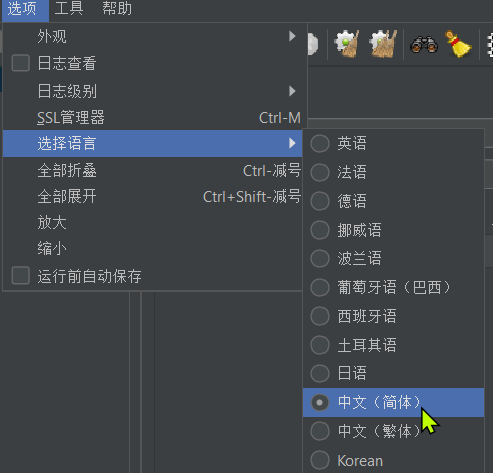
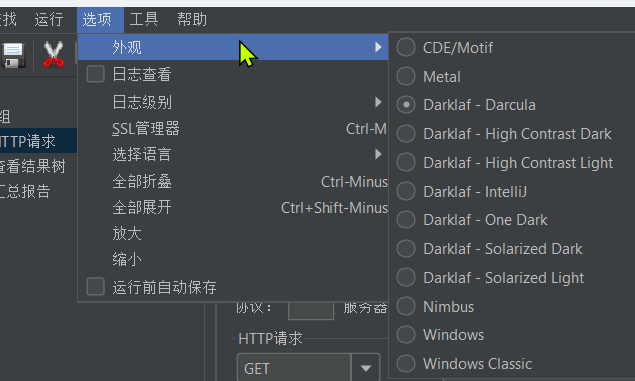
- Method 2: Temporarily set, select Potions->Choose Language->English in the graphical interface
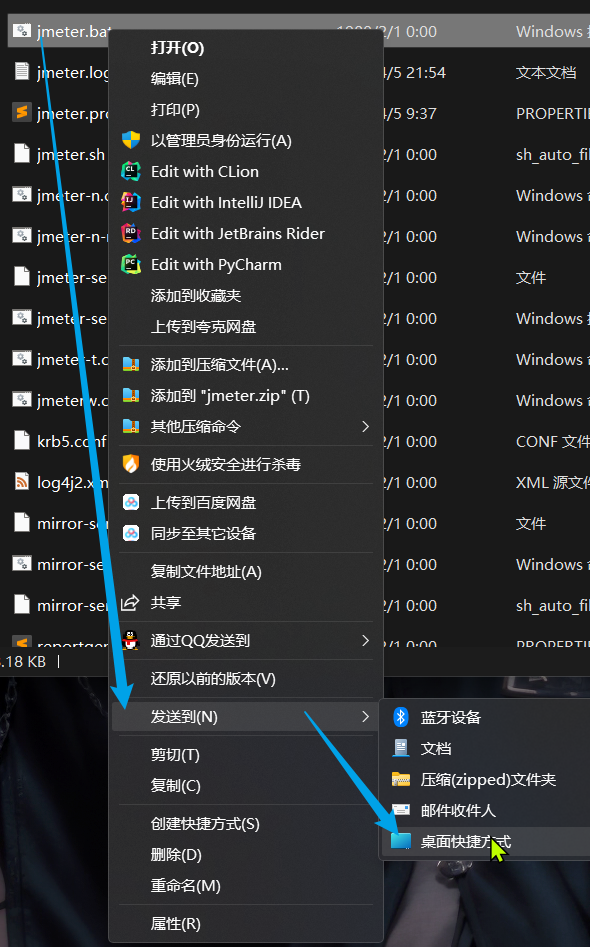
2.2.2 Set Jmeter desktop shortcut icon
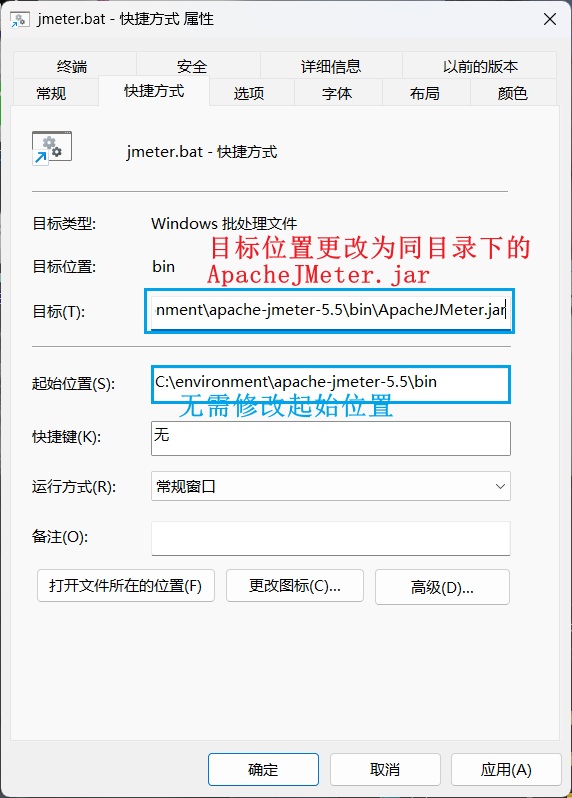
- For the bin directory of the jmeter file—>jmeter.bat file, right-click to create a desktop shortcut
- Modify shortcut properties
- Make jmeter shortcut icon
- Enter
apache-jmeter-5.5\docs\imagesthe directory, choose a suitable icon, and then open the online generation transparent ICO icon website - Upload an image, make an ico icon, and put it into
apache-jmeter-5.5\docs\imagesthe directory - Finally, right-click the shortcut on the desktop, modify properties->change icon->browse
apache-jmeter-5.5\docs\imagesthe directory and select the ico icon file
- Enter
2.3 The problem that Jmeter cannot save the test
- Set the appearance to window in jmeter5.4.1, and restart it to solve it
- There is no such problem in the latest jmeter5.5, it is recommended that you try the latest version
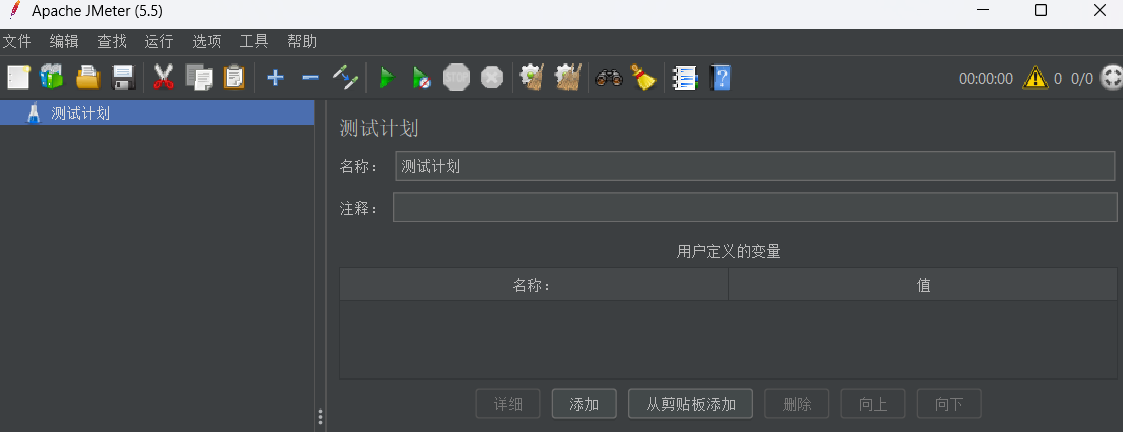
- The test plan can be saved normally in the default Darcula style
- The test plan can be saved normally in the default Darcula style
2.4 Basic usage of jmeter
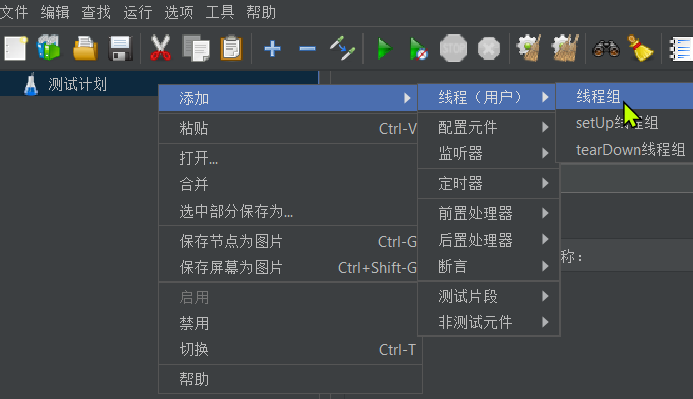
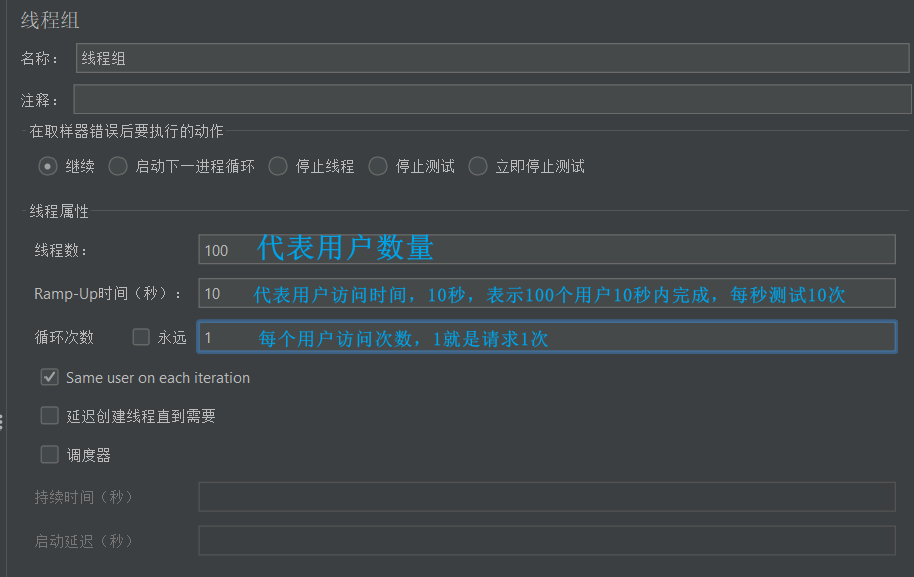
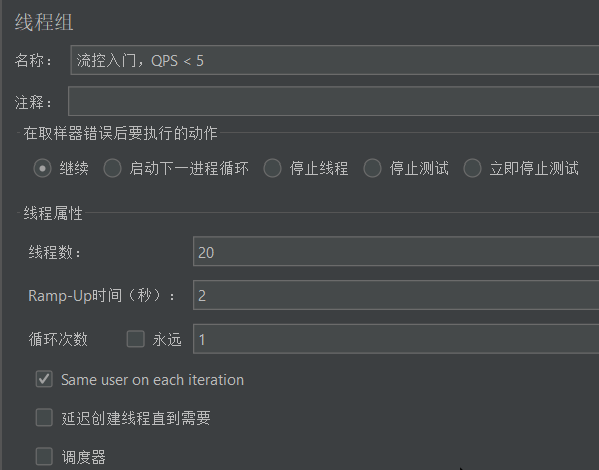
- Right-click on the test plan and select Add > Thread (User) > Thread Group:
- In the newly added thread group, fill in the thread information:
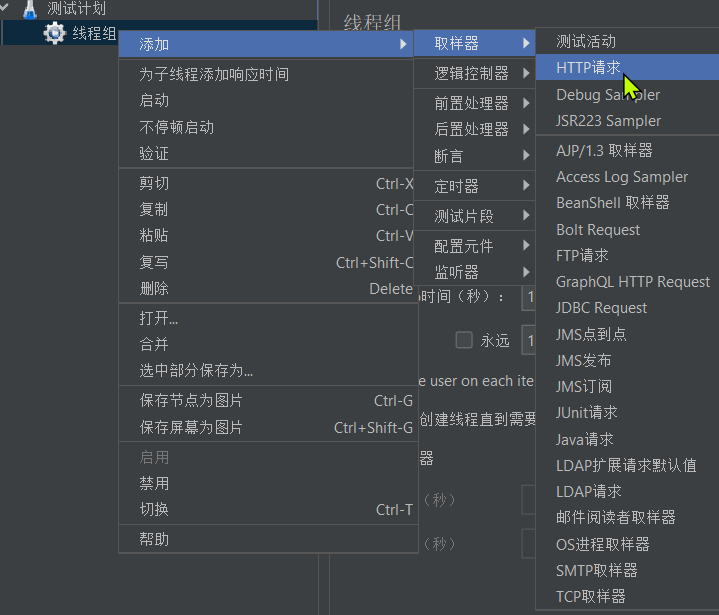
- Right-click the thread group and add an http sampler:
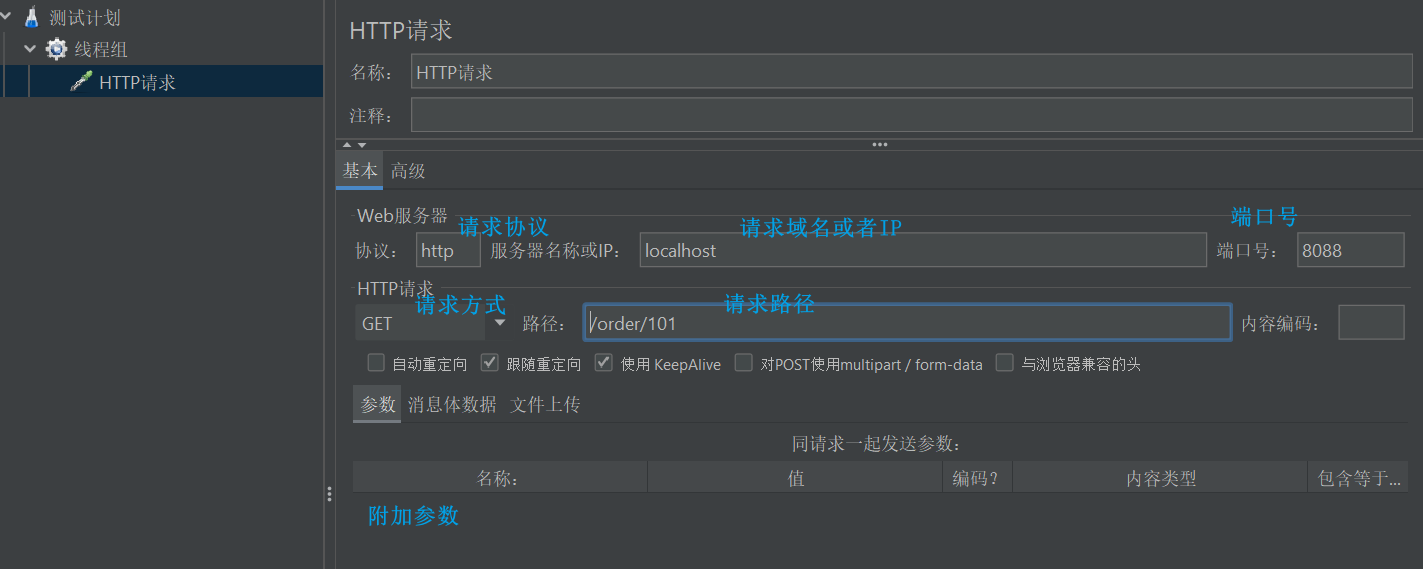
- Write sampler content:
- Add monitoring report:
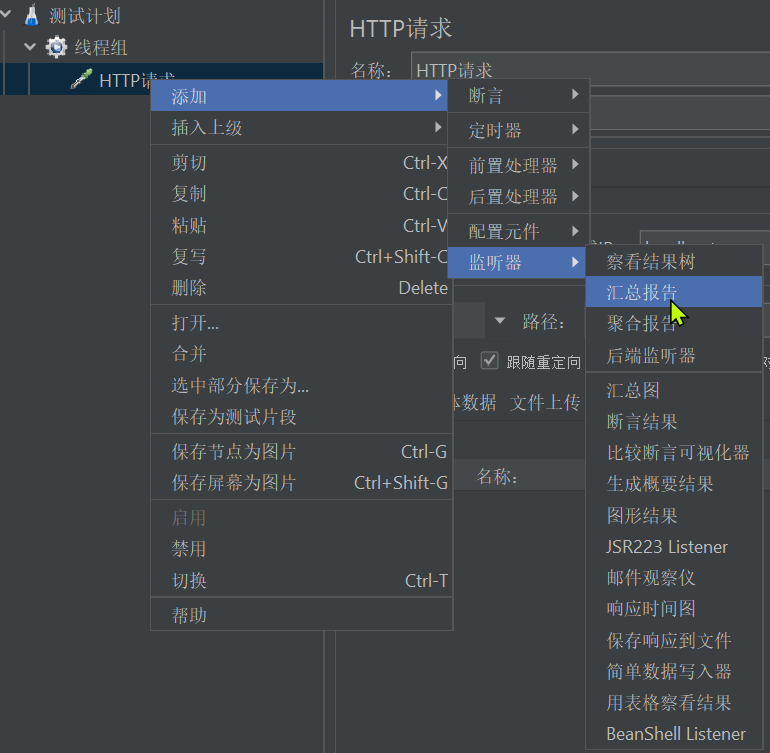
- Add monitoring result tree:
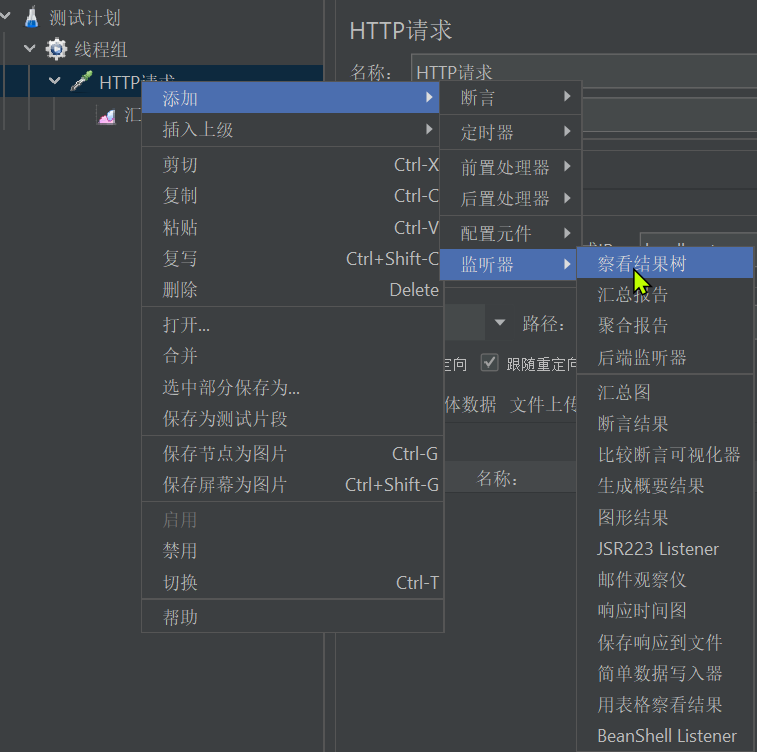
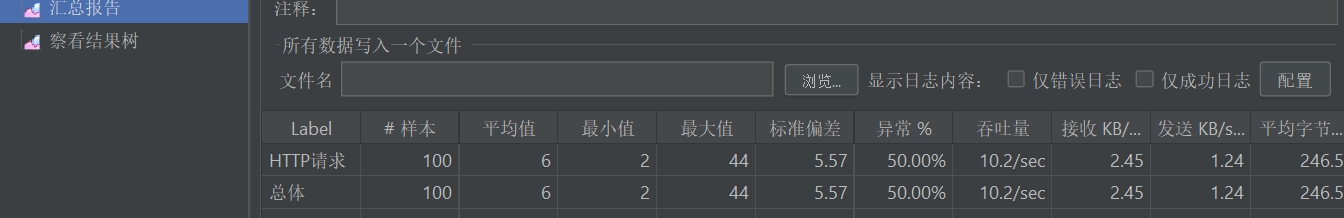
- Summary report results:
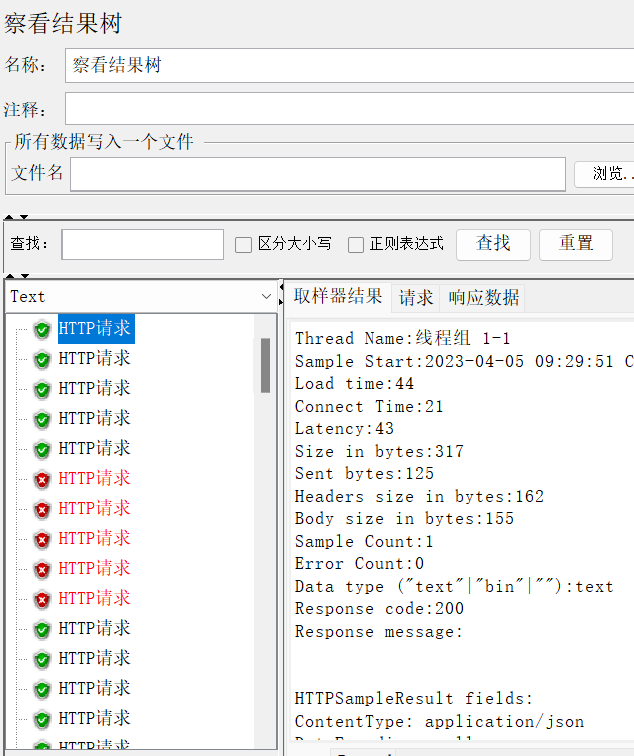
- result tree results
Three flow control
3.1 Cluster link
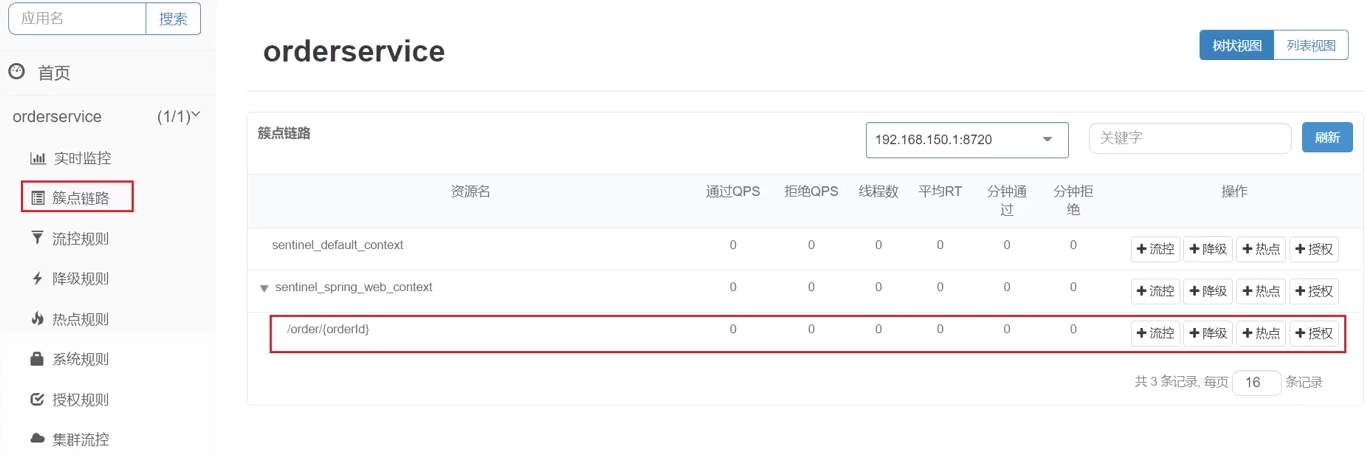
- When a request enters a microservice, it first accesses the DispatcherServlet, and then enters the Controller, Service, and Mapper. Such a call chain is called a cluster point link . Each interface monitored in the cluster link is a resource .
- By default, sentinel will monitor each endpoint (Endpoint, which is the method in the controller) of SpringMVC, so each endpoint (Endpoint) of SpringMVC is a resource in the call link.
- For example: the endpoint in the OrderController in the order-service you just visited: /order/{orderId}

- For example: the endpoint in the OrderController in the order-service you just visited: /order/{orderId}
- Flow control, fuse, etc. are all set for the resources in the cluster link, so we can click the button behind the corresponding resource to set the rules:
- flow control: flow control
- Downgrade: downgrade fuse
- Hotspot: hotspot parameter current limit, which is a kind of current limit
- Authorization: request permission control
3.2 Quick Start
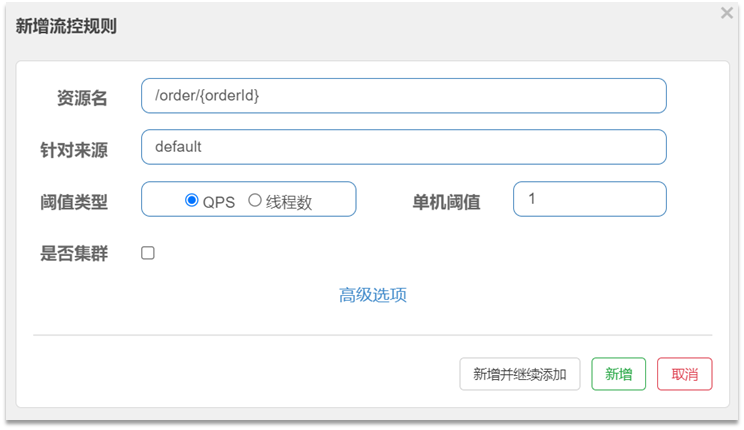
- Click the flow control button behind resource/order/{orderId} to pop up the form
- Limiting rules can be filled in the form
- Test with jmeter
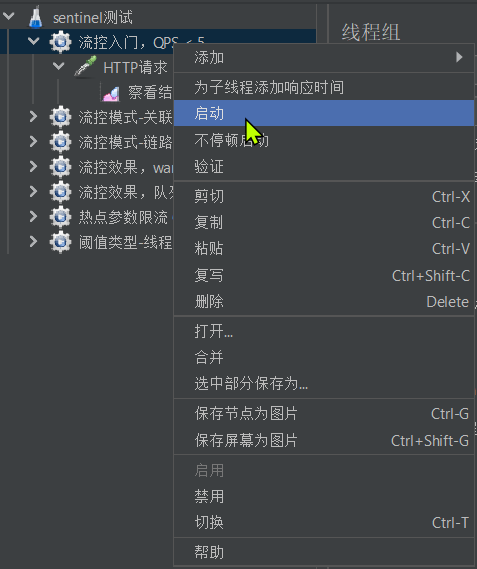
- Note: Do not click the Execute button in the menu to run
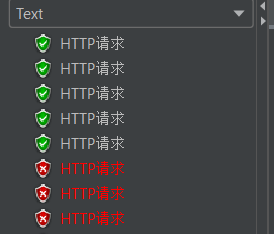
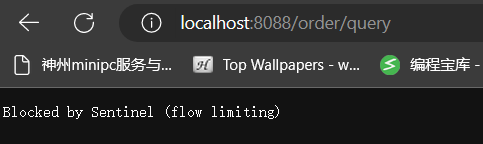
- Results of the
3.3 Flow Control Mode
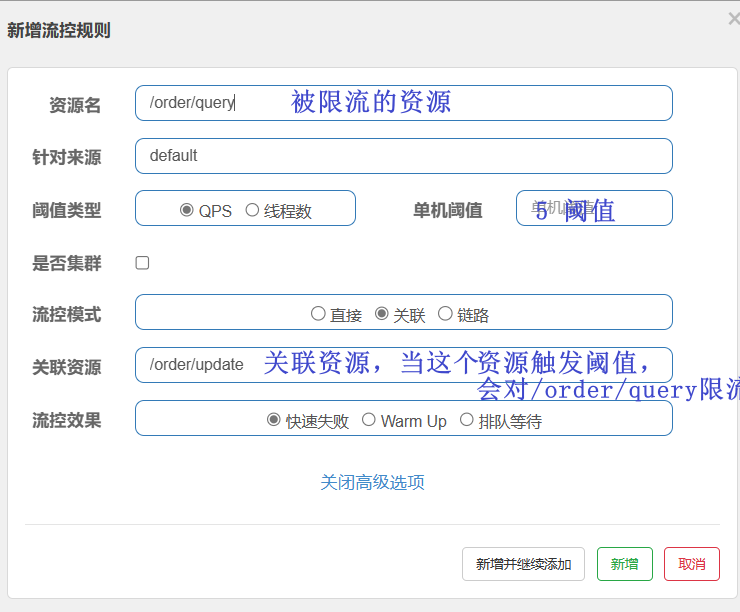
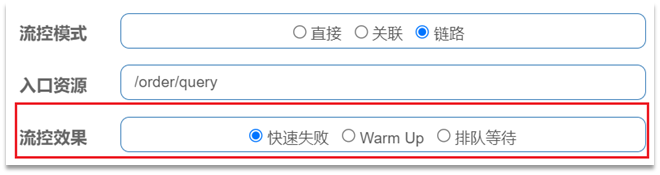
- When adding a flow-limiting rule, click Advanced Options to choose from three flow-control modes :
- Direct: Statistical requests for current resources, and directly limit the flow of current resources when the threshold is triggered, which is also the default mode
- Association: count another resource related to the current resource, and limit the flow of the current resource when the threshold is triggered
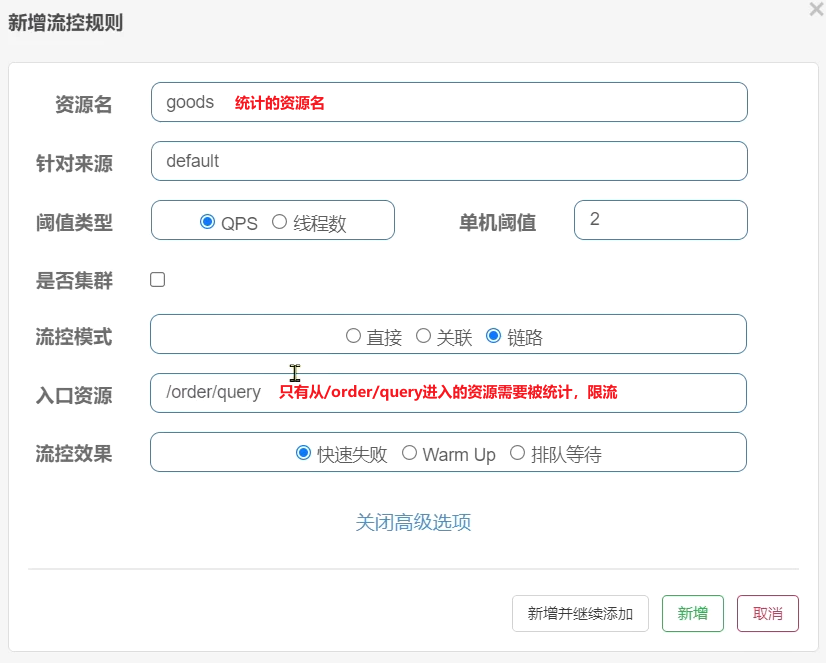
- Link: Count the requests to access this resource from the specified link, and limit the flow of the specified link when the threshold is triggered
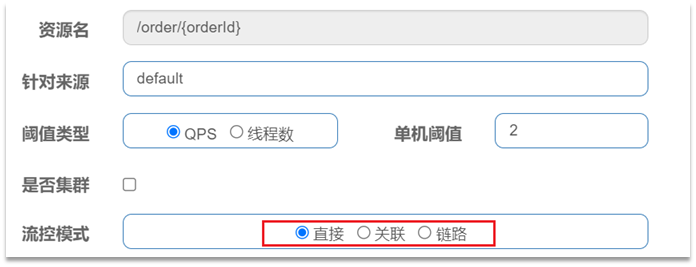
- Description of requirements :
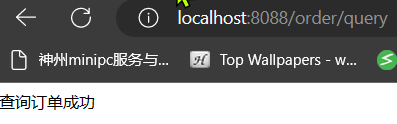
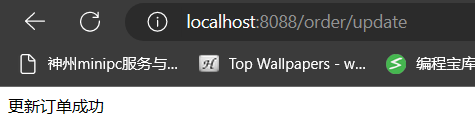
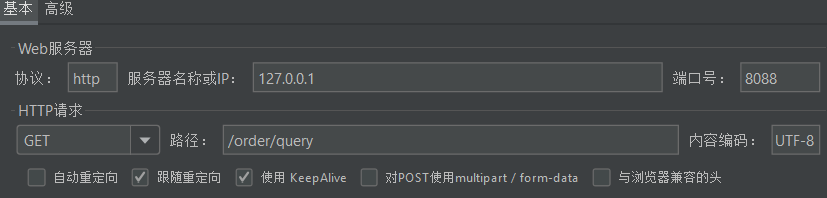
- Create two endpoints in OrderController: /order/query and /order/update, no need to implement business
- Configure flow control rules, when the QPS accessed by the /order/ update resource exceeds 5, limit the flow of /order/query requests
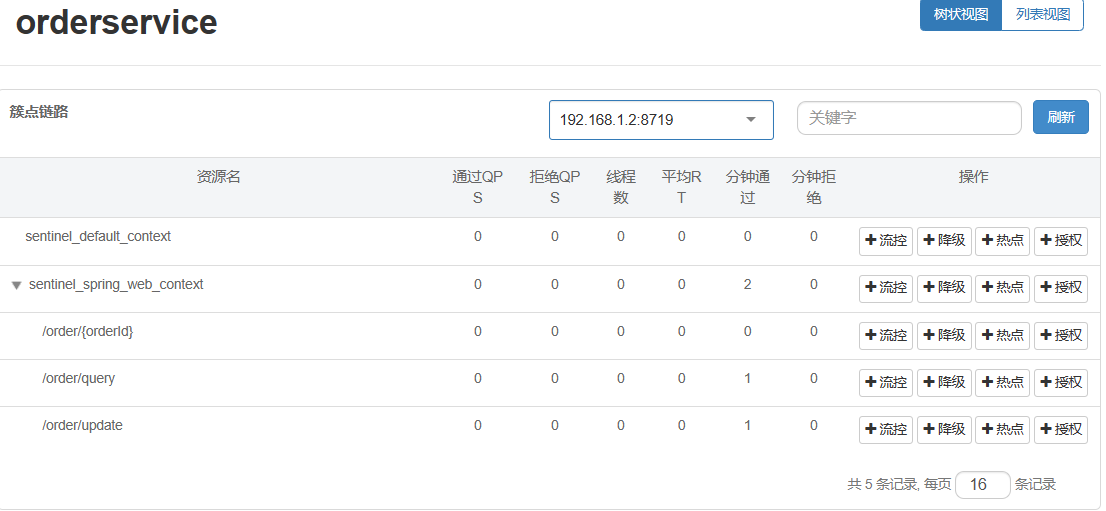
- Note that after restarting the service, remember to visit once before sentinel can display the cluster point link
- Restart the service and view the cluster link of the sentinel console:
- Configure flow control rules

- Test in Jmeter
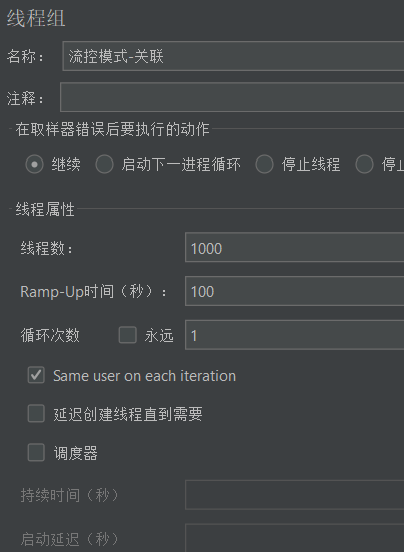
- 1000 users, 100 seconds, so the QPS is 10, which exceeds the threshold we set: 5
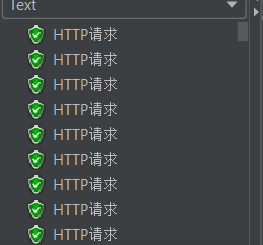
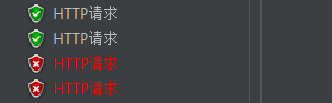
- View http request:
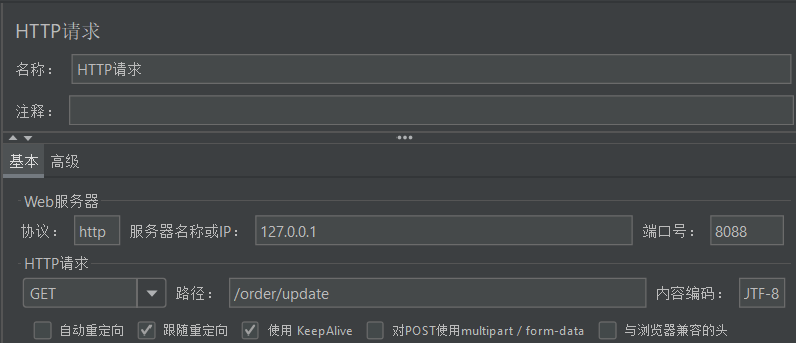
- The target of the request is /order/update, so this breakpoint will trigger the threshold but the target of the current limit is /order/query
- The association mode can be used if the following conditions are met:
- two competing resources
- One with higher priority and one with lower priority
3.4 Link mode
- Link mode : Only make statistics on the requests to access this resource from the specified link, and judge whether it exceeds the threshold.
- For example: set two links to access the same resource
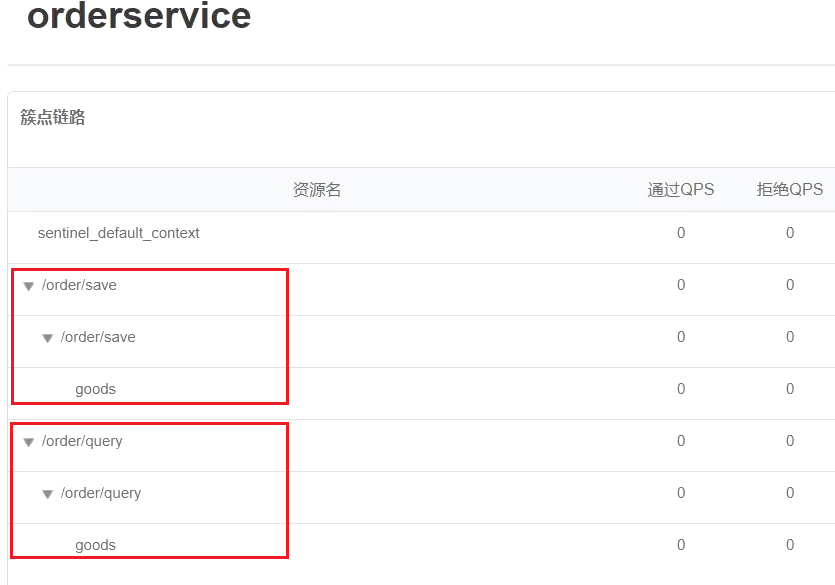
- Add flow control rules
- Jmeter test
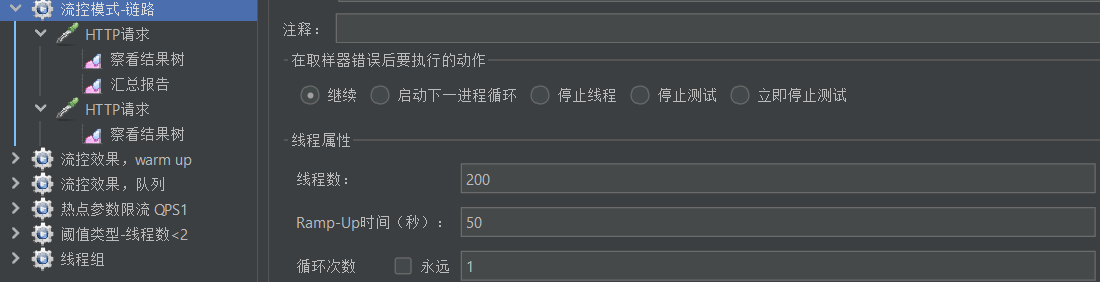
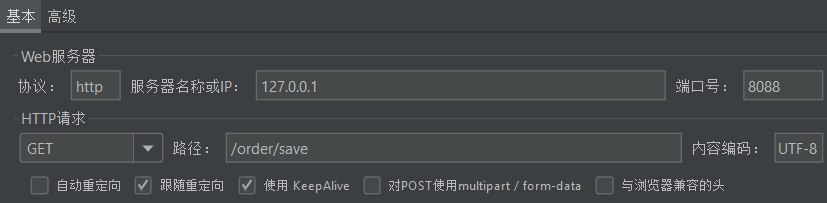
- An http request is to access /order/save:
- The result of the operation: completely unaffected
- The other is to access /order/query:
- Running result: only 2 passes each time
- An http request is to access /order/save:
3.5 Flow control effect
- The flow control effect refers to the measures that should be taken when the request reaches the flow control threshold, including three types:
- Fail fast: Once the threshold is reached, new requests are rejected immediately and a FlowException is thrown. is the default processing method.
- warm up: warm up mode, requests exceeding the threshold are also rejected and an exception is thrown. But this mode threshold will change dynamically, gradually increasing from a small value to a maximum threshold.
- Waiting in queue: Let all requests be executed in a queue in order, and the interval between two requests cannot be less than the specified time
3.5.1 warm up
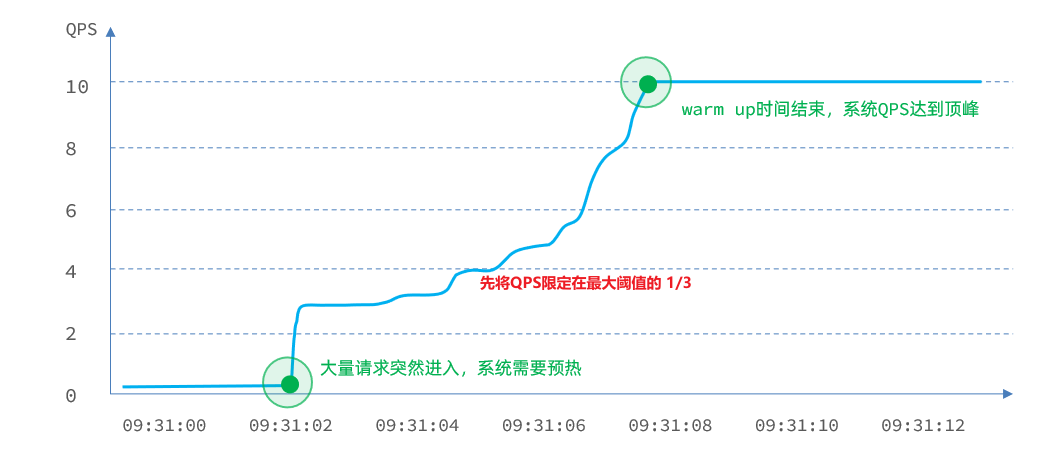
- The threshold is generally the maximum QPS that a microservice can undertake. However, when a service is just started, all resources have not been initialized ( cold start ). If the QPS is directly run to the maximum value, it may cause the service to go down instantly.
- Warm up is also called warm-up mode , which is a solution to cold start of services. The initial value of the request threshold is maxThreshold / coldFactor, and after a specified duration, it will gradually increase to the maxThreshold value. The default value of coldFactor is 3.
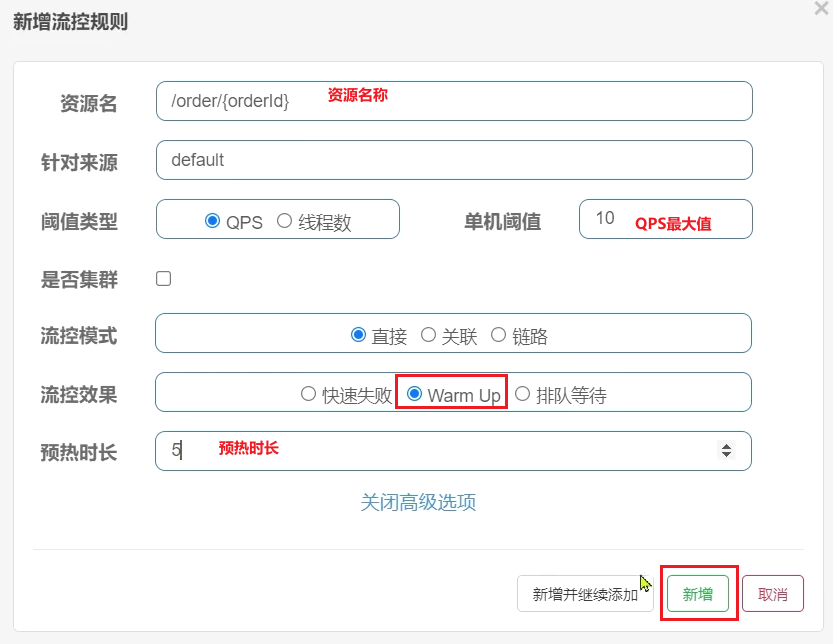
- For example, if I set the maxThreshold of QPS to 10 and the warm-up time to 5 seconds, then the initial threshold is 10 / 3, which is 3, and then gradually increases to 10 after 5 seconds.
- Configure flow control rules
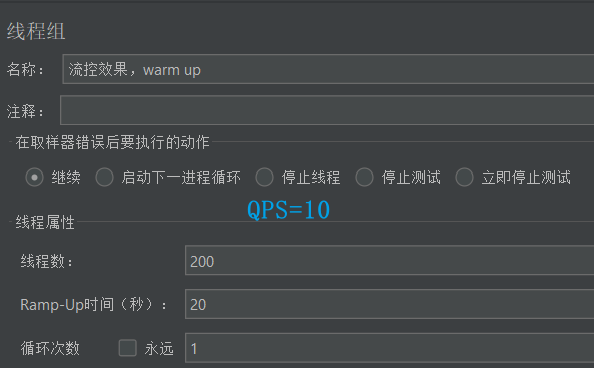
- Jmeter test
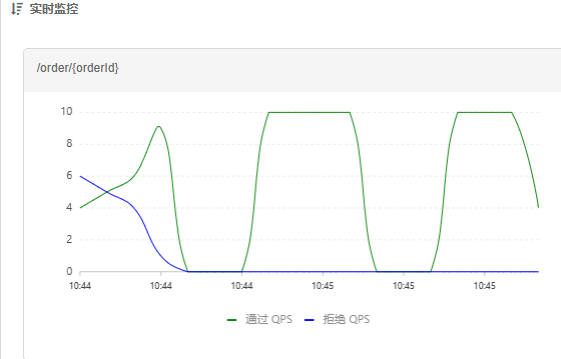
- Sentinel console to view real-time monitoring:
3.5.2 Waiting in line
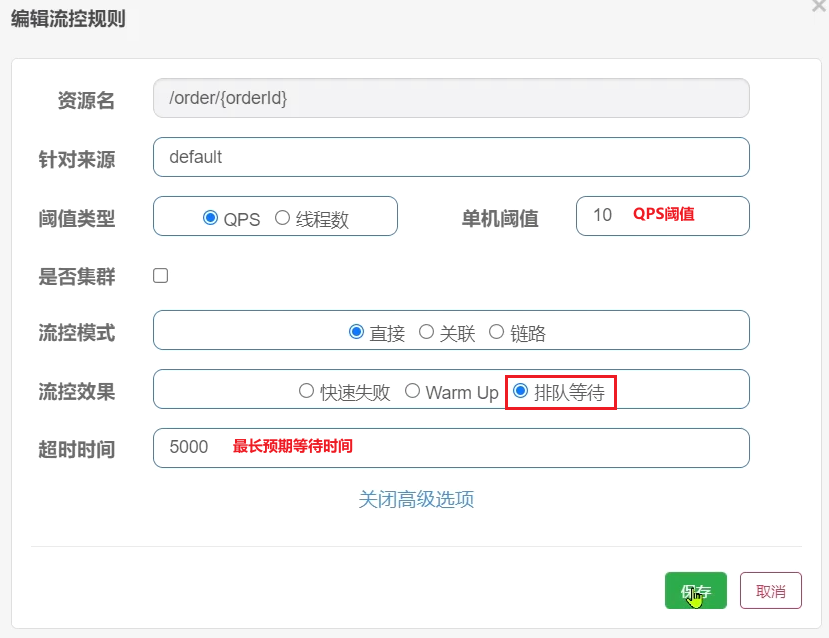
- Queuing is to let all requests enter a queue, and then execute them sequentially according to the time interval allowed by the threshold. Subsequent requests must wait for previous executions to complete, and will be rejected if the expected waiting time for the request exceeds the maximum duration.
- working principle
- For example: QPS = 5, means that a request in the queue is processed every 200ms; timeout = 2000, means that requests with an expected waiting time of more than 2000ms will be rejected and an exception will be thrown.
- So what is the expected waiting time? For example, 12 requests come at once, because one request is executed every 200ms, then:
- Expected waiting time for the 6th request = 200 * (6 - 1) = 1000ms
- Expected waiting time for the 12th request = 200 * (12-1) = 2200ms
- Now, 10 requests are received at the same time in the first second, but only one request is received in the second second. At this time, the QPS curve looks like this:
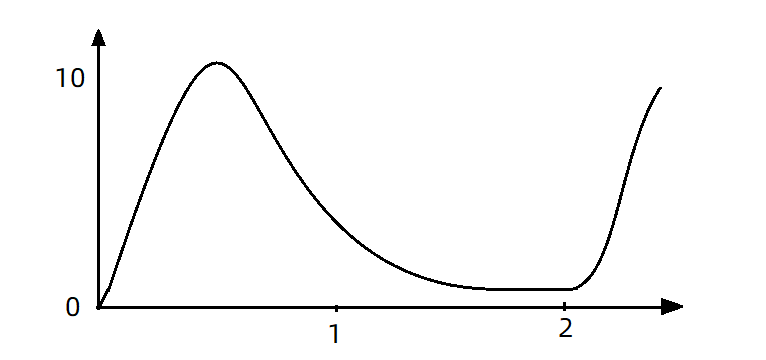
- If you use the queue mode for flow control, all incoming requests must be queued and executed at a fixed interval of 200ms, and the QPS will become very smooth:
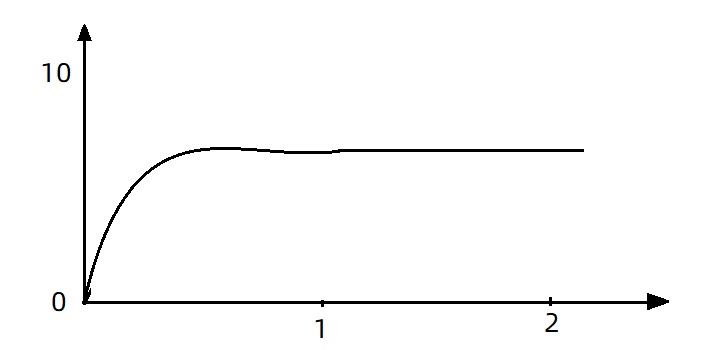
- Animation explanation:

- Add flow control rules
- Jmeter test test results
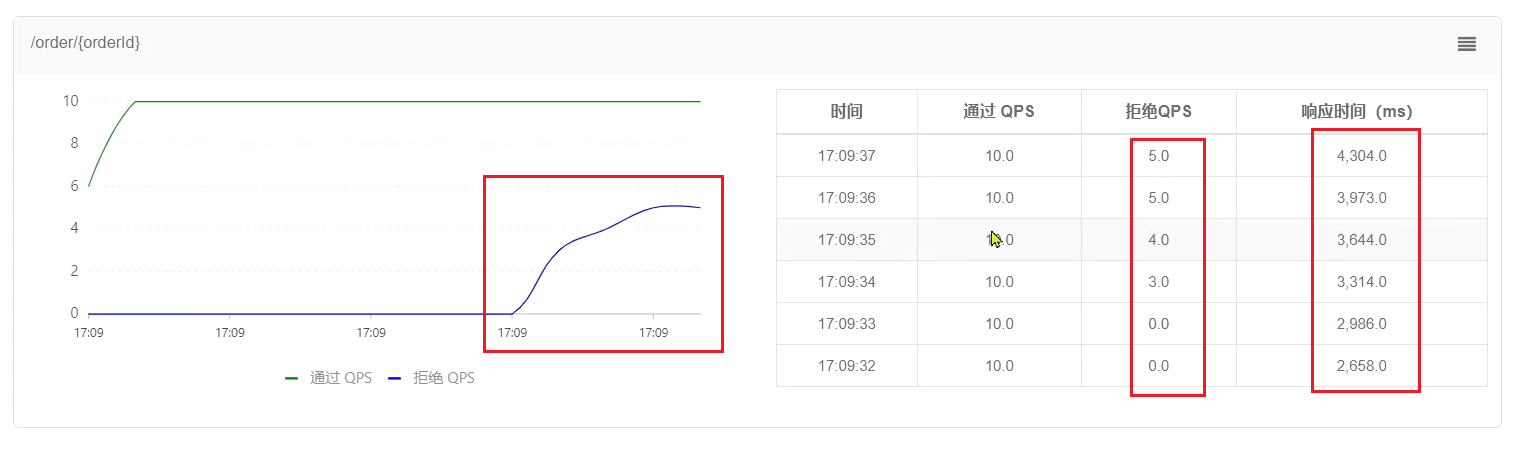
- QPS is very smooth and consistently maintained at 10, but the excess requests are not rejected, but put into the queue. So the response time (waiting time) will be longer and longer. When the queue is full, some requests will fail.
3.6 Current Limiting of Hotspot Parameters
- Hotspot parameter current limiting is to count requests with the same parameter value separately to determine whether it exceeds the QPS threshold.
3.6.1 Global parameter current limit
- In the request to access /goods/{id}, the value of the id parameter will change, and the hotspot parameter current limit will count the QPS respectively according to the parameter value. The statistical result: when the request with id=1 triggers the threshold to be limited, the id value is not 1 requests are not affected.

- Configuration example:
- Make statistics on parameter 0 (the first parameter) of the hot resource, and the number of requests for the same parameter value per second cannot exceed 5
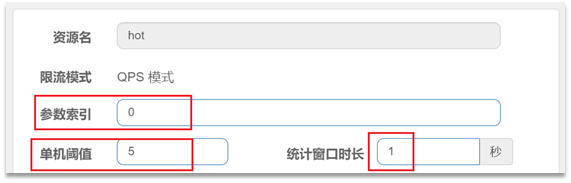
- Make statistics on parameter 0 (the first parameter) of the hot resource, and the number of requests for the same parameter value per second cannot exceed 5
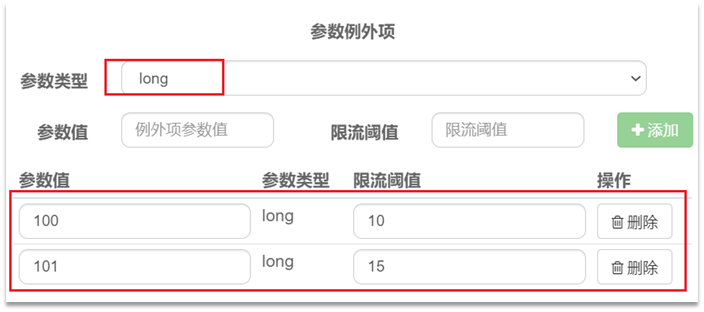
3.6.2 Current limiting of hotspot parameters
- In actual development, some products may be hot products, such as flash sale products. We hope that the QPS limit of these products is different from other products and higher. Then you need to configure the advanced options of hotspot parameter current limit
4 Isolation and downgrade
-
Current limiting is a preventive measure. Although current limiting can try to avoid service failures caused by high concurrency, services may also fail due to other reasons. To control these faults within a certain range and avoid avalanches, it is necessary to rely on thread isolation (bulkwall mode) and fuse downgrade
-
Thread isolation : When calling the service provider, the caller allocates an independent thread pool for each call request. When a failure occurs, at most the resources in this thread pool are consumed to avoid exhausting all the resources of the caller.

-
Fuse downgrading : add a circuit breaker on the caller's side to count the calls to the service provider. If the failure rate of the call is too high, the service will be broken and access to the service provider will not be allowed.

-
Whether it is thread isolation or fuse downgrade, it is the protection of the client (caller). It is necessary to perform thread isolation or service fusing when the caller initiates a remote call.
-
And our microservice remote calls are all based on Feign, so we need to integrate Feign with Sentinel, and implement thread isolation and service fuse in Feign.
4.1 FeignClient integrates Sentinel
- In Spring Cloud, microservice calls are all implemented through Feign, so Feign and Sentinel must be integrated for client protection.
4.1.1 Modify the configuration and enable the sentinel function
-
Modify the application.yml file of OrderService to enable Feign's Sentinel function:
feign:
  sentinel:
    enabled: true # 开启feign对sentinel的支持
4.1.2 Writing failure downgrade logic
- After a business failure, an error cannot be reported directly, but a friendly prompt or default result should be returned to the user. This is the failure downgrade logic.
- Write downgrade logic for FeignClient after failure
① Method 1: FallbackClass, unable to handle remote call exceptions
② Method 2: FallbackFactory, can handle remote call exceptions [Adopted]
- Here is a demonstration of the failure downgrade processing of the second method.
-
Step 1 : Define classes in the feeding-api project to implement FallbackFactory:
- code:
@Slf4j public class UserClientFallbackFactory implements FallbackFactory<UserClient> { @Override public UserClient create(Throwable throwable) { return new UserClient() { @Override public User findById(Long id) { log.error("查询用户异常", throwable); return new User(); } }; } } -
Step 2 : Register UserClientFallbackFactory as a Bean in the DefaultFeignConfiguration class in the feeding-api project:
@Bean public UserClientFallbackFactory userClientFallbackFactory(){ return new UserClientFallbackFactory(); } -
Step 3 : Use UserClientFallbackFactory in the UserClient interface in the feeding-api project:
@FeignClient(value = "userservice", fallbackFactory = UserClientFallbackFactory.class) public interface UserClient { @GetMapping("/user/{id}") User findById(@PathVariable("id") Long id); } -
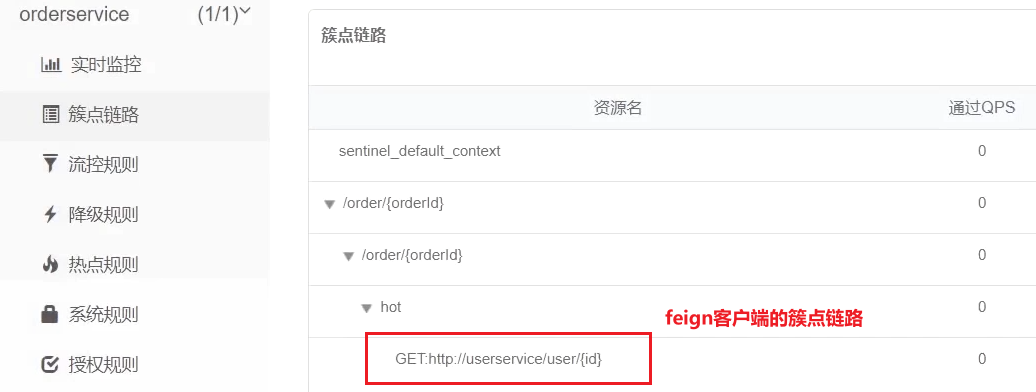
After restarting, visit the order query service once, and then check the sentinel console, you can see the new cluster point link:
4.1.3 Summary
-
Avalanche solutions supported by Sentinel:
- Thread isolation (silo wall mode)
- downgrade circuit breaker
-
Steps for Feign to integrate Sentinel:
- Configure in application.yml: feign.sentienl.enable=true
- Write a FallbackFactory for FeignClient and register it as a Bean
- Configure FallbackFactory to FeignClient
4.2 Thread Isolation (Bulkhead Mode)
4.2.1 Implementation of thread isolation
- Thread isolation can be achieved in two ways:
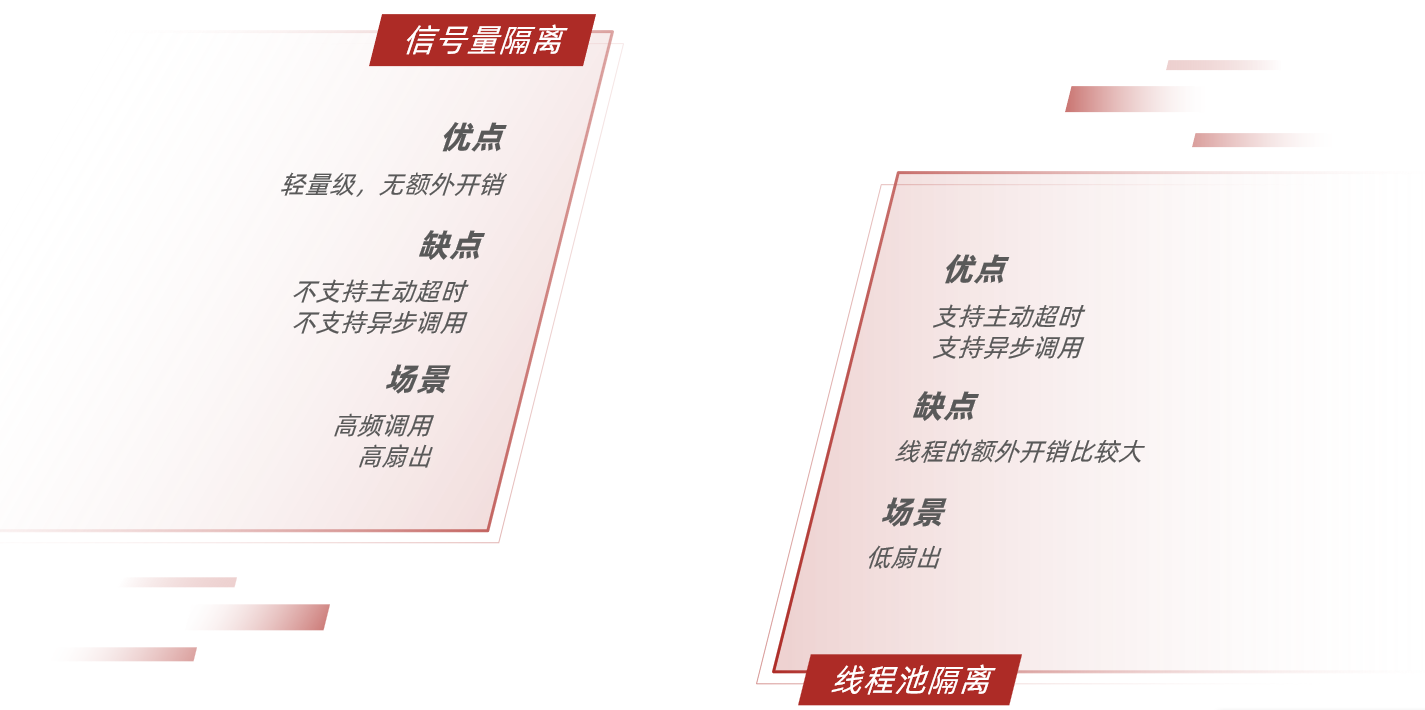
- thread pool isolation
- Semaphore isolation (Sentinel uses it by default)

- Thread pool isolation : assign a thread pool to each service call business, and use the thread pool itself to achieve the isolation effect
- Semaphore isolation : Instead of creating a thread pool, it uses a counter mode to record the number of threads used by the business. When the upper limit of the semaphore is reached, new requests are prohibited.
- Pros and cons of both:
4.2.2 Thread isolation of sentinel
- When adding a throttling rule, you can choose two threshold types:
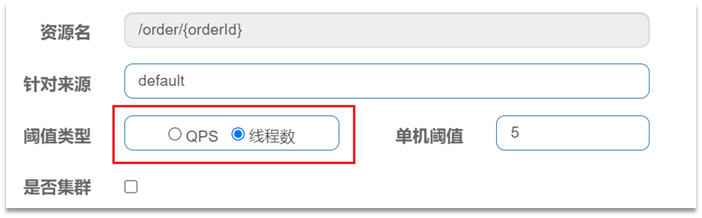
- QPS: the number of requests per second
- Number of threads: The maximum number of tomcat threads that can be used by this resource. That is, by limiting the number of threads, thread isolation is achieved (bulkwall mode)
4.3 Fuse degradation
-
Fuse downgrade is an important means to solve the avalanche problem . The idea is that the circuit breaker counts the abnormal proportion of service calls and the proportion of slow requests, and if the threshold is exceeded, the service will be broken . That is, all requests to access the service are intercepted; and when the service is restored, the circuit breaker will release the request to access the service.
-
The following demonstrates the execution diagram of the circuit breaker:

the state machine includes three states: -
closed: closed state, the circuit breaker releases all requests, and starts to count the proportion of exceptions and slow requests. If the threshold is exceeded, switch to the open state
-
open: In the open state, the service call is interrupted , and the request to access the interrupted service will be rejected, fail fast, and go directly to the downgrade logic. After 5 seconds in the Open state, it will enter the half-open state
-
half-open: In the half-open state, a request is released, and the next operation is judged according to the execution result.
- If the request is successful: switch to the closed state
- If the request fails: switch to the open state -
There are three types of circuit breaker fusing strategies: slow call, abnormal ratio, abnormal number
4.3.1 Slow calls
- Slow call : A request whose service response time (RT) is longer than the specified time is considered a slow call request. Within the specified time, if the number of requests exceeds the set minimum number and the proportion of slow calls is greater than the set threshold, a circuit breaker will be triggered.
- demo
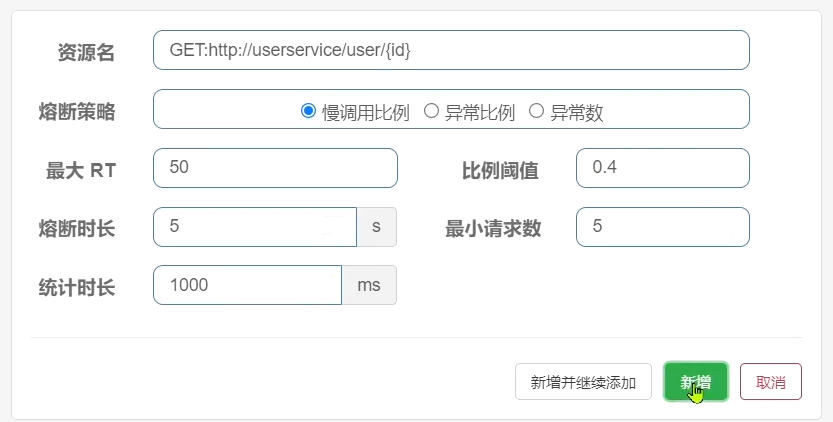
- The RT threshold for slow calls is 50ms, the statistics time is 1 second, the minimum number of requests is 5, the failure threshold ratio is 0.4, and the circuit breaker duration is 5. Requests exceeding 50ms are considered slow requests.
4.3.2 Abnormal proportion, abnormal number
- Abnormal ratio or abnormal number : Count calls within a specified time period. If the number of calls exceeds the specified number of requests, and the proportion of abnormalities reaches the set ratio threshold (or exceeds the specified abnormal number), a circuit breaker will be triggered.
- For example, an unusual scale setting:
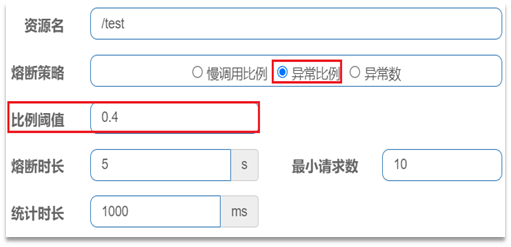
- Interpretation: Count the requests within the last 1000ms. If the number of requests exceeds 10 and the abnormality ratio is not less than 0.4, a circuit breaker will be triggered.
- An exception number setting:
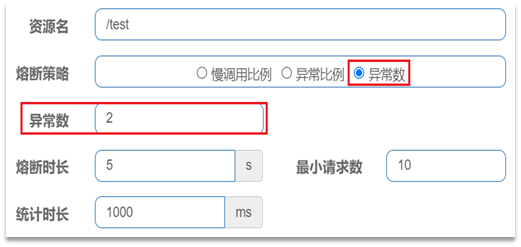
- Interpretation: Count the requests within the last 1000ms. If the number of requests exceeds 10 and the abnormal ratio is not less than 2, a circuit breaker will be triggered.
Five Authorization Rules
- Authorization rules can judge and control the source of the requester.
5.1 Authorization rules
-
Authorization rules can control the source of the caller, and there are two ways: white list and black list.
- Whitelist: callers whose origin is in the whitelist are allowed to access
- Blacklist: Callers whose origin is in the blacklist are not allowed to access
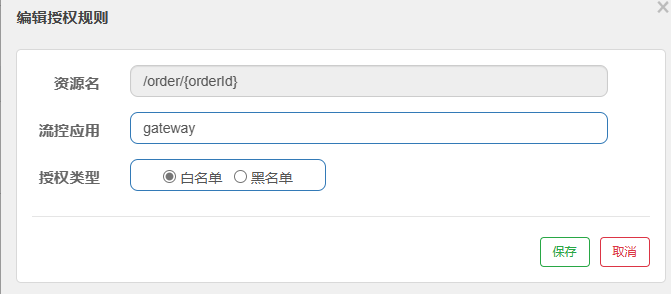
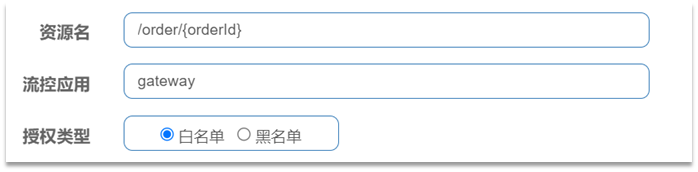
- Resource name: It is the protected resource, such as /order/{orderId}
- Flow control application: is the list of sources,
- If the white list is checked, the sources in the list are allowed to access.
- If the blacklist is checked, the sources in the list are prohibited from accessing.
-
Demonstration: [skip about microservice operations]
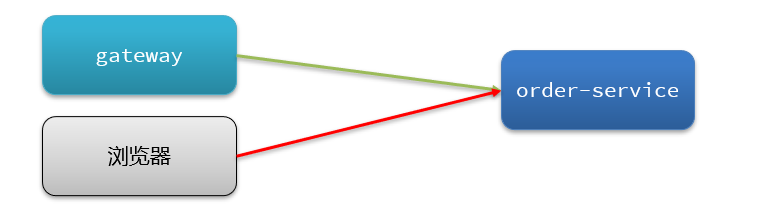
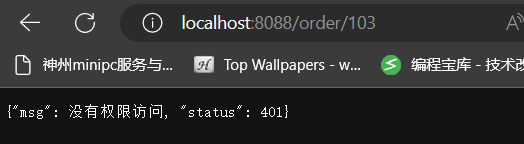
- Only the gateway is allowed to access the service
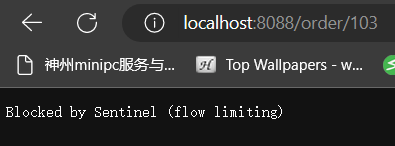
- direct access error
- Access through the gateway:
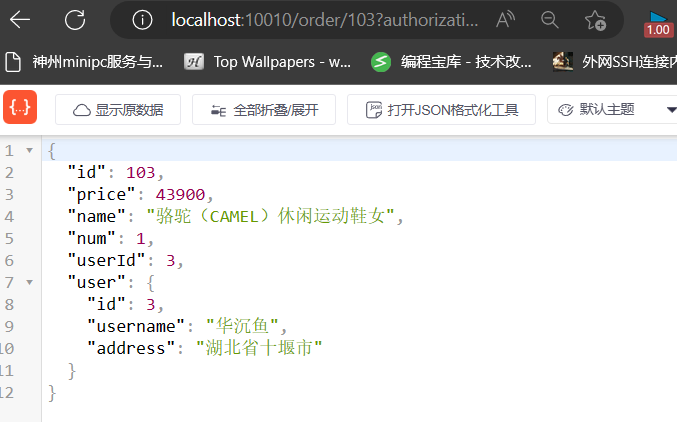
- Only the gateway is allowed to access the service
5.2 Custom exception results
- By default, when current limiting, downgrading, or authorization interception occurs, an exception will be thrown to the caller. Abnormal results are flow limiting (current limiting). This is not friendly enough, and it is impossible to know whether it is current limiting, downgrading or authorized interception.
- exception type
- If you want to customize the return result when an exception occurs, you need to implement the BlockExceptionHandler interface:
public interface BlockExceptionHandler { /** * 处理请求被限流、降级、授权拦截时抛出的异常:BlockException */ void handle(HttpServletRequest request, HttpServletResponse response, BlockException e) throws Exception; }- This method has three parameters:
- HttpServletRequest request:request对象
- HttpServletResponse response:response对象
- BlockException e: the exception thrown when intercepted by sentinel
- BlockException contains several different subclasses:
| abnormal | illustrate |
|---|---|
| FlowException | Current limit exception |
| ParamFlowException | Abnormal hotspot parameter current limit |
| DegradeException | downgrade exception |
| AuthorityException | Authorization rule exception |
| SystemBlockException | System rule exception |
5.3 Custom exception handling
@Component
public class SentinelExceptionHandler implements BlockExceptionHandler {


    @Override
    public void handle(HttpServletRequest request, HttpServletResponse response, BlockException e) throws Exception {


        String msg = "未知异常";
        int status = 429;

        if (e instanceof FlowException) {


            msg = "请求被限流了";
        } else if (e instanceof ParamFlowException) {


            msg = "请求被热点参数限流";
        } else if (e instanceof DegradeException) {


            msg = "请求被降级了";
        } else if (e instanceof AuthorityException) {


            msg = "没有权限访问";
            status = 401;
        }

        response.setContentType("application/json;charset=utf-8");
        response.setStatus(status);
        response.getWriter().println("{\"msg\": " + msg + ", \"status\": " + status + "}");
    }
}
- Authorization interception:
Six Rules for Persistence
- All sentinel rules are stored in memory, and all rules will be lost after restarting. In a production environment, we must ensure the persistence of these rules to avoid loss.
6.1 Rule Management Mode
-
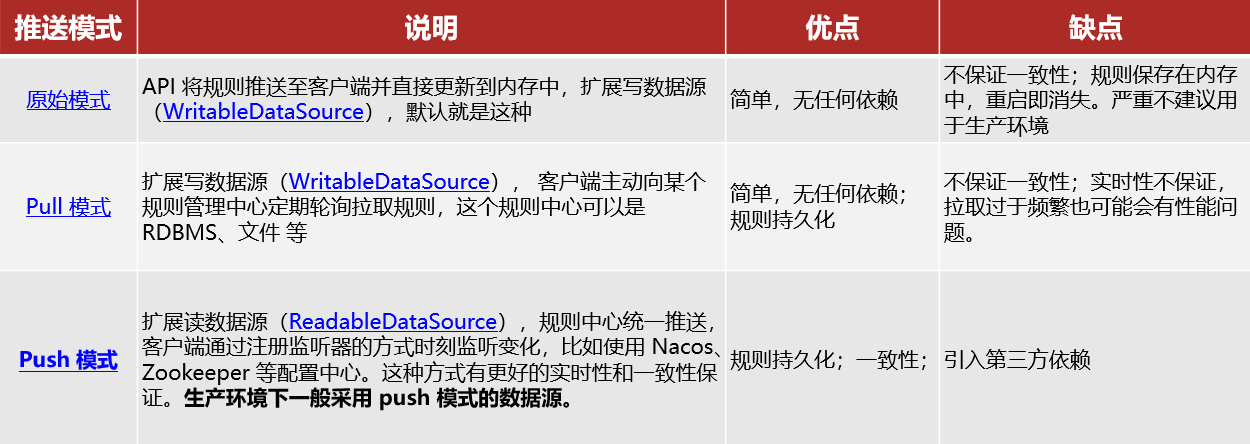
Whether the rules can be persisted depends on the rule management mode. Sentinel supports three rule management modes:
-
Original mode: The default mode of Sentinel, the rules are saved in memory, and the service will be lost after restarting the service.
- pull mode
- push mode
6.2 pull mode
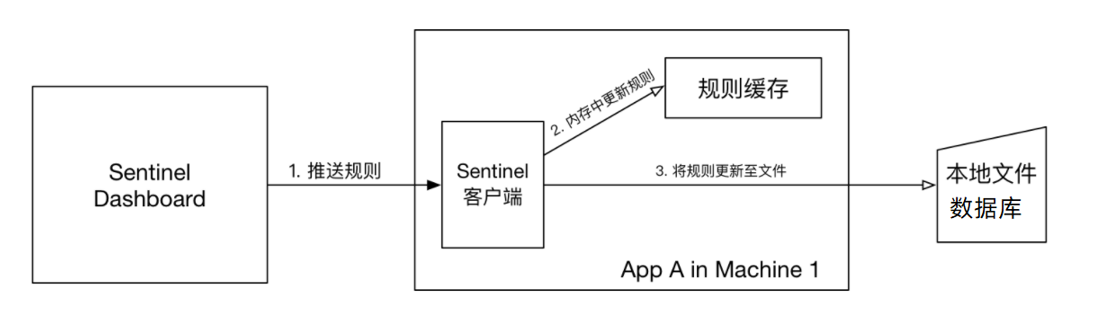
- Pull mode: The console pushes the configured rules to the Sentinel client, and the client saves the configured rules in a local file or database. In the future, we will regularly query local files or databases to update local rules.
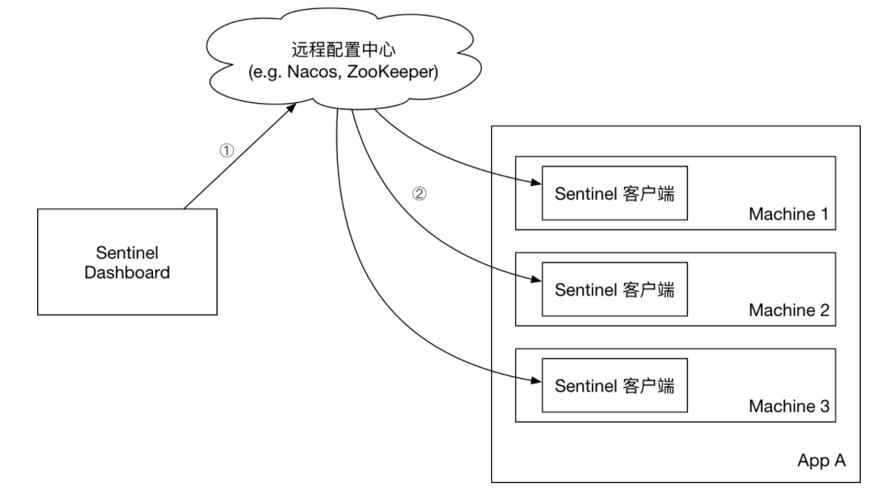
6.3 push mode
- Push mode: The console pushes configuration rules to a remote configuration center, such as Nacos. The Sentinel client monitors Nacos, obtains push messages of configuration changes, and completes local configuration updates.
6.4 Implement push mode
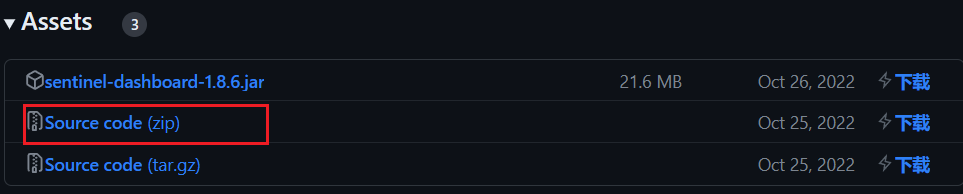
6.4.1 Download and decompress Sentinel source code
- Sentinel download address
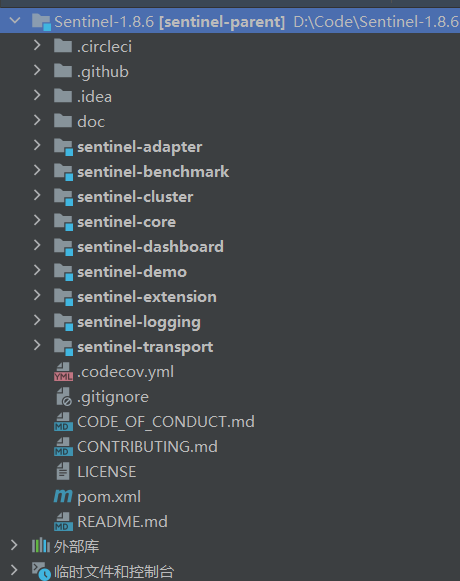
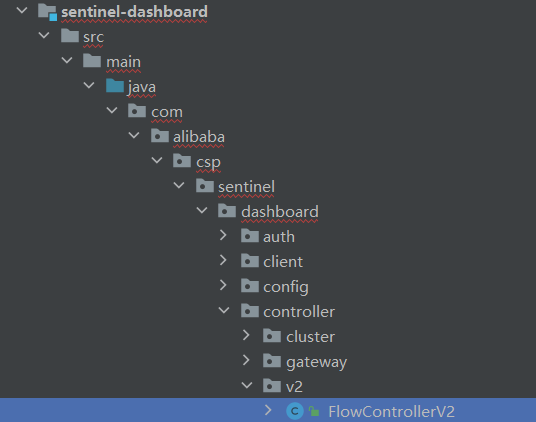
- Then open the project with IDEA, the structure is as follows:
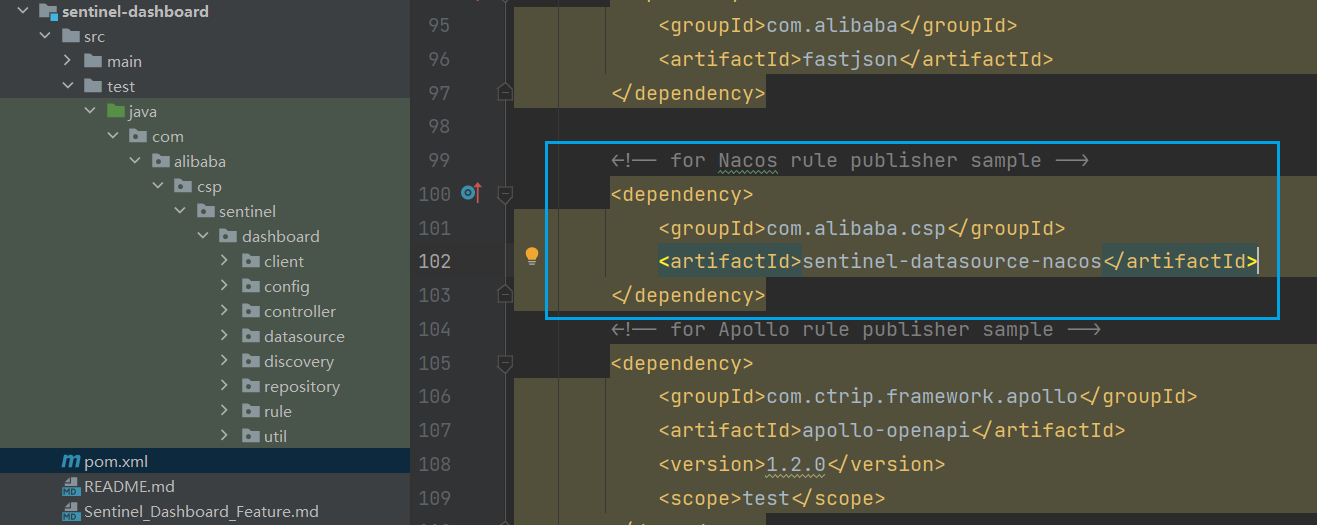
6.4.2 Modify nacos dependencies
- In
sentinel-dashboardthe pom file of the source code folder, nacos depends on the default scope of test, which can only be used during testing. Here it needs to be removed:
6.4.3 Add nacos support
-
Under the test package of sentinel-dashboard, support for nacos has been written, we need to copy it to main
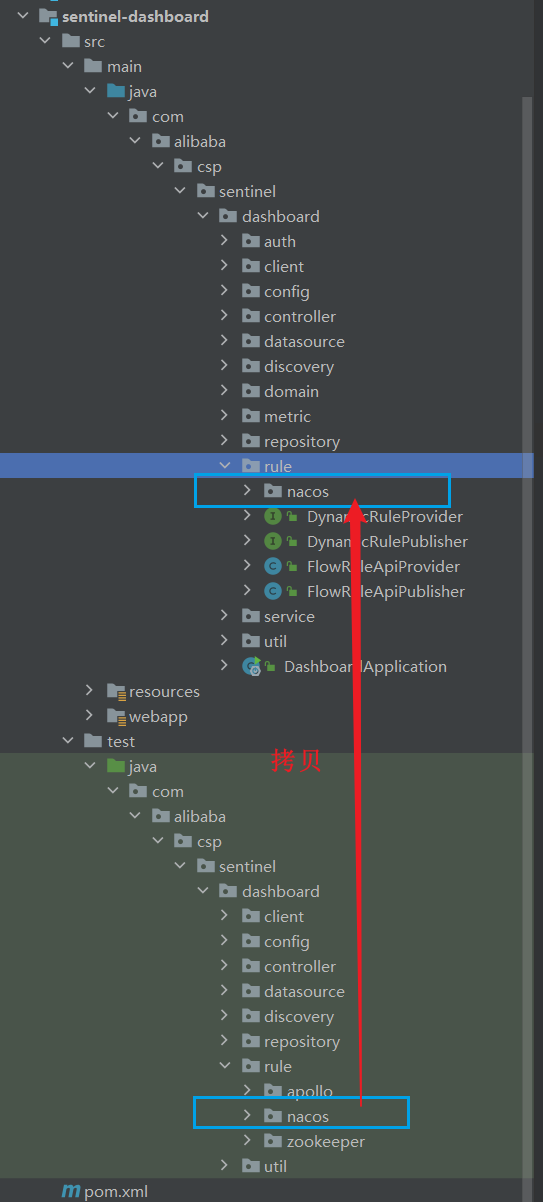
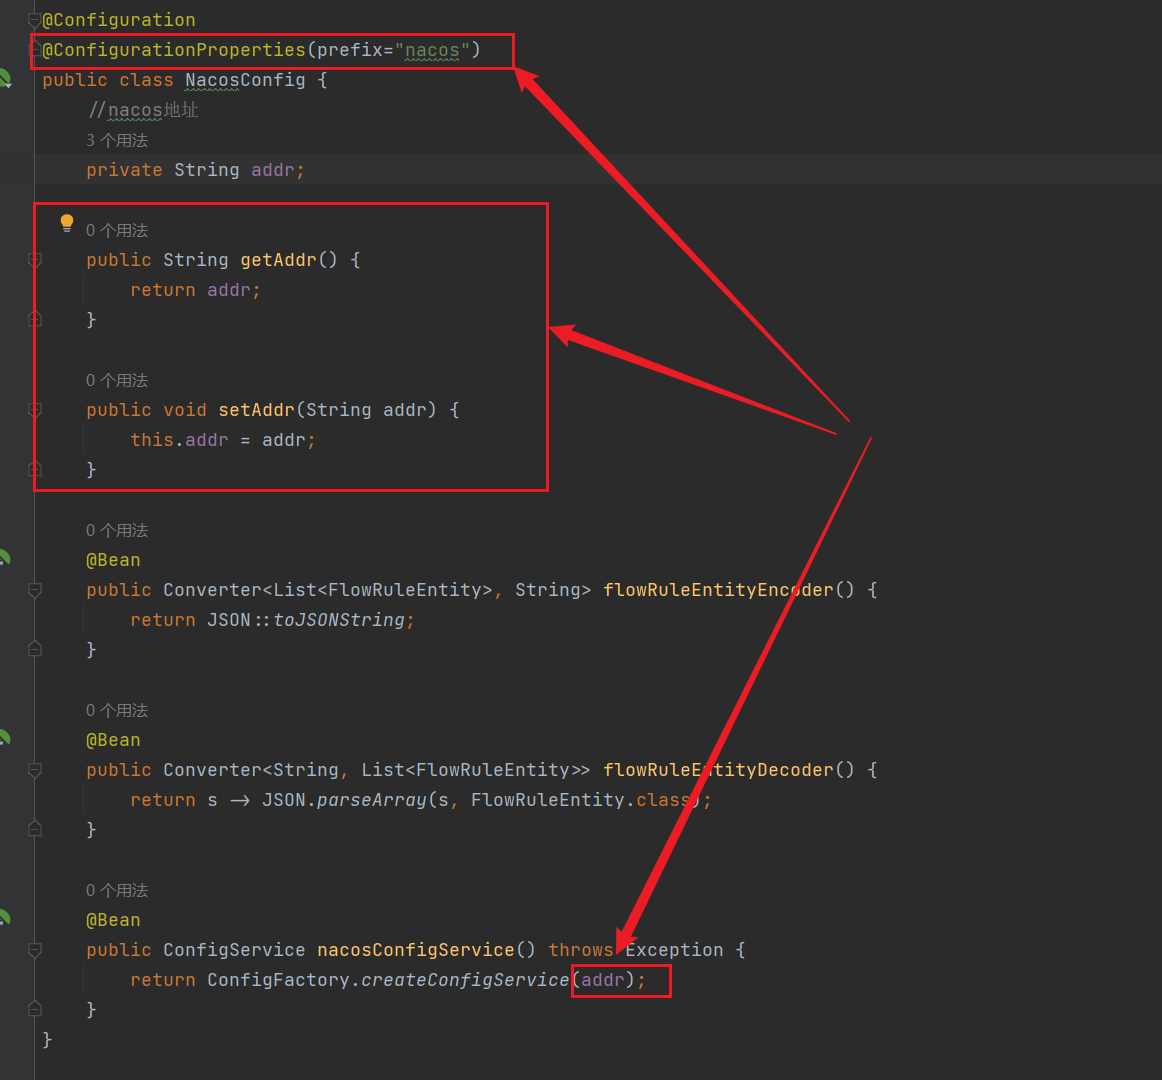
-
Modify the nacos address and let it read the configuration in application.properties:
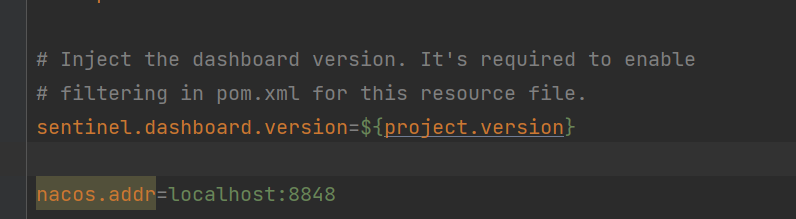
-
Add nacos address configuration in application.properties of sentinel-dashboard:
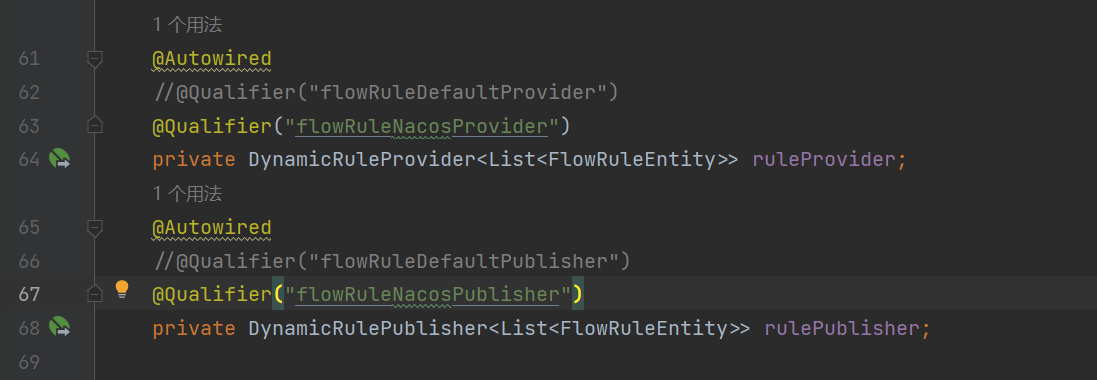
6.4.4 Configure nacos data source
6.4.5 Modify the front-end page
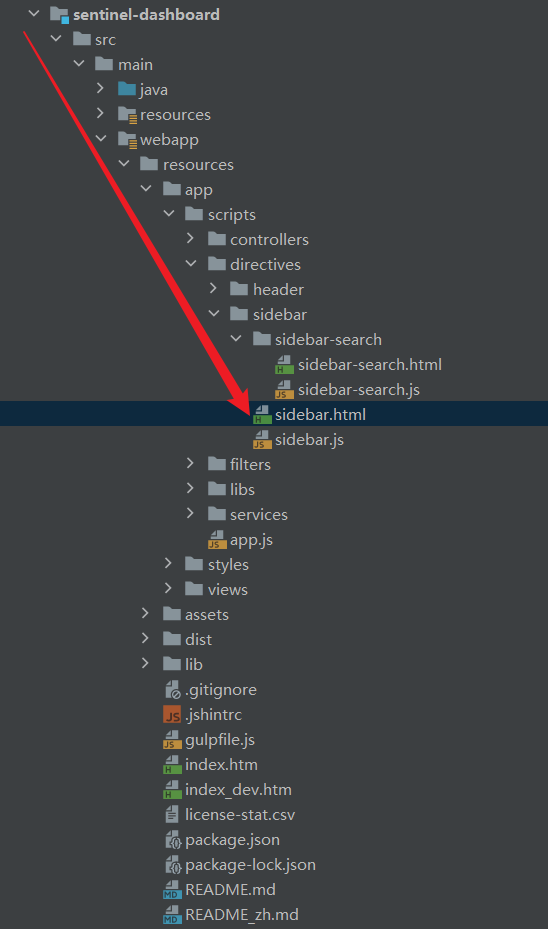
- Also modify the front-end page and add a menu that supports nacos
- Modify the sidebar.html file in the src/main/webapp/resources/app/scripts/directives/sidebar/ directory
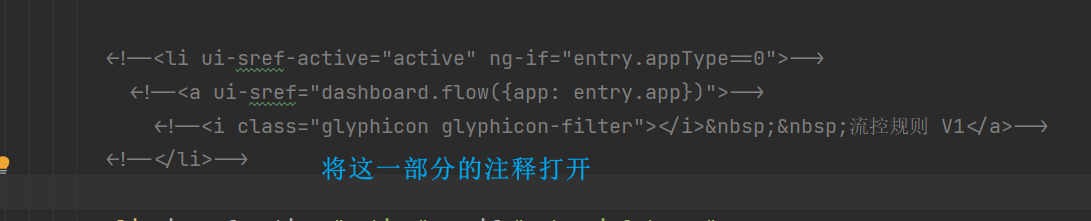
-
modify the text in
<li ui-sref-active="active" ng-if="entry.appType==0"> <a ui-sref="dashboard.flow({app: entry.app})"> <i class="glyphicon glyphicon-filter"></i> 流控规则-NACOS</a> </li>
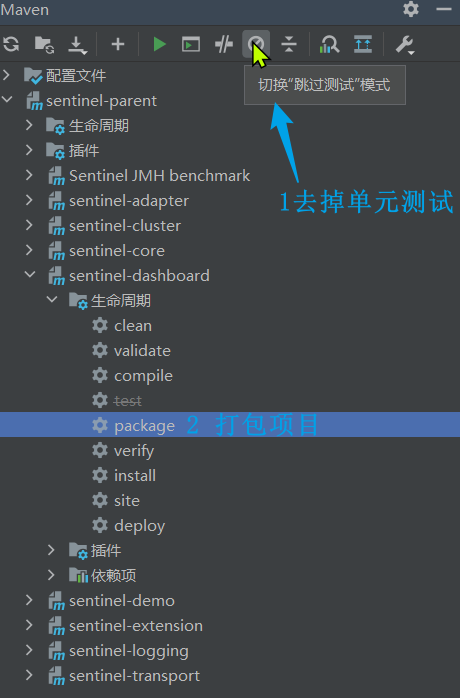
6.4.6 Recompile and package the project
- Run the maven plug-in in IDEA, compile and package the modified Sentinel-Dashboard:
6.4.7 Start
- The startup method is the same as the official one:
java -jar sentinel-dashboard.jar - If you want to modify the nacos address, you need to add parameters:
java -jar -Dnacos.addr=localhost:8848 sentinel-dashboard.jar