Table of contents
1. Basic concepts and comparison of the scope of application of the two
1. What is correlation analysis
2. What is the correlation coefficient
3. Comparison of scope of application
3. Find the correlation coefficient
1. Rank correlation coefficient
3. Find the correlation coefficient
foreword
Get ready for Mathematical Modeling! Start with correlation analysis!
1. Basic concepts and comparison of the scope of application of the two
1. What is correlation analysis
Correlation analysis refers to the analysis of two or more correlated variable elements, so as to measure the closeness of the two factors. There must be a certain connection or probability between the correlated elements before correlation analysis can be performed.
2. What is the correlation coefficient
The correlation coefficient is an indicator that reflects the degree of linear correlation between two variables .
- Pearson correlation: used to measure the correlation coefficient between two continuous random variables
- Spearman correlation coefficient (Spearman correlation): Rank correlation coefficient, which is solved according to the rank order of the original data, also known as the Pearson correlation coefficient between rank variables
(There is also a Kendall correlation coefficient that is not understood yet)
The above two coefficients are the direction and degree of the change trend between the two variables, and the value range is [-1, 1] . When it is close to 1, it means that the two have a strong positive correlation; when it is close to -1, it means that there is a strong negative correlation; and when the value is close to 0, it means that the correlation is very low.
3. Comparison of scope of application
Selection of Spearman correlation coefficient and Pearson correlation coefficient:
1. For continuous data , normal distribution , and linear relationship , it is most appropriate to use pearson correlation coefficient. Spearman correlation coefficient can also be used, but the efficiency is not as high as pearson correlation coefficient.
2. Only when the above three conditions are met can the pearson correlation coefficient be used, otherwise the spearman correlation coefficient will be used.
3. Only the spearman correlation coefficient is used between the sequenced data , and the pearson correlation coefficient cannot be used.
Note: (1) Ordinal data refers to the data that only reflects the level and sequence relationship of the observed objects. It is formed by the measurement of the ordinal scale. It is expressed as a category and can be sorted. It belongs to quality data.
For example, once grades are ranked, it doesn't make sense to do math on the ranks. The most important meaning of ordinal data represents the logical order in a set of data.
(2) The applicable conditions of Spearman's correlation coefficient are wider than those of Pearson's correlation coefficient, as long as the data satisfy a monotonic relationship (such as linear function, exponential function, logarithmic function, etc.), it can be used.
2. Correlation coefficient
1. Pearson correlation
When two variables are normal continuous variables and there is a linear relationship between them, Pearson can be used to calculate the correlation coefficient. The value range is [-1,1] . Calculated as follows:

Formally, it is the correlation coefficient learned in probability theory.
Variable Correlation Strength :
| Relevance | Strong correlation | strong correlation | Moderately related | weak correlation | Very weak or no correlation |
| Absolute value of correlation coefficient | 0.8——1 | 0.6——0.8 | 0.4——0.6 | 0.2——0.4 | 0——0.2 |
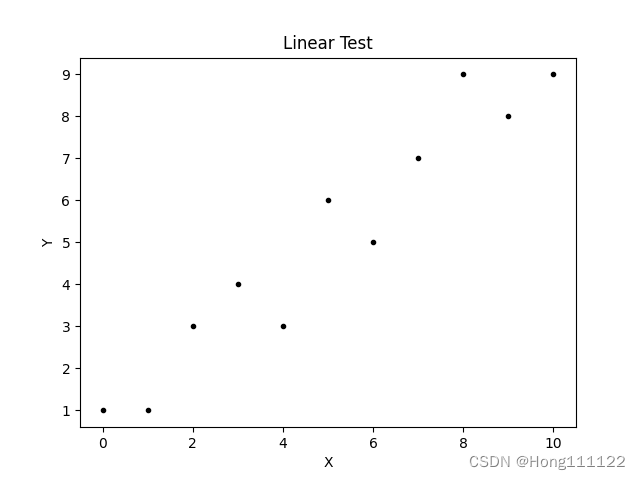
1. Linearity test
Generally, a scatterplot is used for linearity testing:
import numpy as np
from matplotlib import pyplot as plt


def linear_test():

    #为显示线性关系手动输入的数据
    x = np.array([0, 1, 2, 3, 4, 5, 6, 7, 8, 9, 10])
    y = np.array([1, 1, 3, 4, 3, 6, 5, 7, 9, 8, 9])

    fig = plt.figure()
    ax1 = fig.add_subplot(1, 1, 1)
    ax1.set_title('Linear Test')
    ax1.set_xlabel('X')
    ax1.set_ylabel('Y')
    ax1.scatter(x, y, c='k', marker='.')
    plt.savefig('linear_test.png')


linear_test()
2. Normality test
The kstest method of the scipy module is used here , and the specific code is as follows:
def normal_test():

    data = np.array([1, 2, 5, 4, 4, 6, 7, 3, 9, 5, 4, 7, 1, 2, 9])
    u = data.mean()
    std = data.std()
    result = stats.kstest(data, 'norm', (u, std))
    print(result)
Result: KstestResult(statistic=0.12726344134326134, pvalue=0.9427504251048978)
The result returns two values: statistic → D value, pvalue → P value
H0: The sample meets
H1: The sample does not meet
the p value > 0.05 , accept H0, and the data is normally distributed.
3. Find the correlation coefficient
If the above verifications are all successful , the Pearson correlation coefficient is used for correlation analysis:
import pandas as pd


# 读取数据
df = pd.read_excel('spearman_data.xlsx')
df = pd.DataFrame(df)
# print(df)

# 生成相关性矩阵
rho = df.corr(method='pearson')
print(rho)
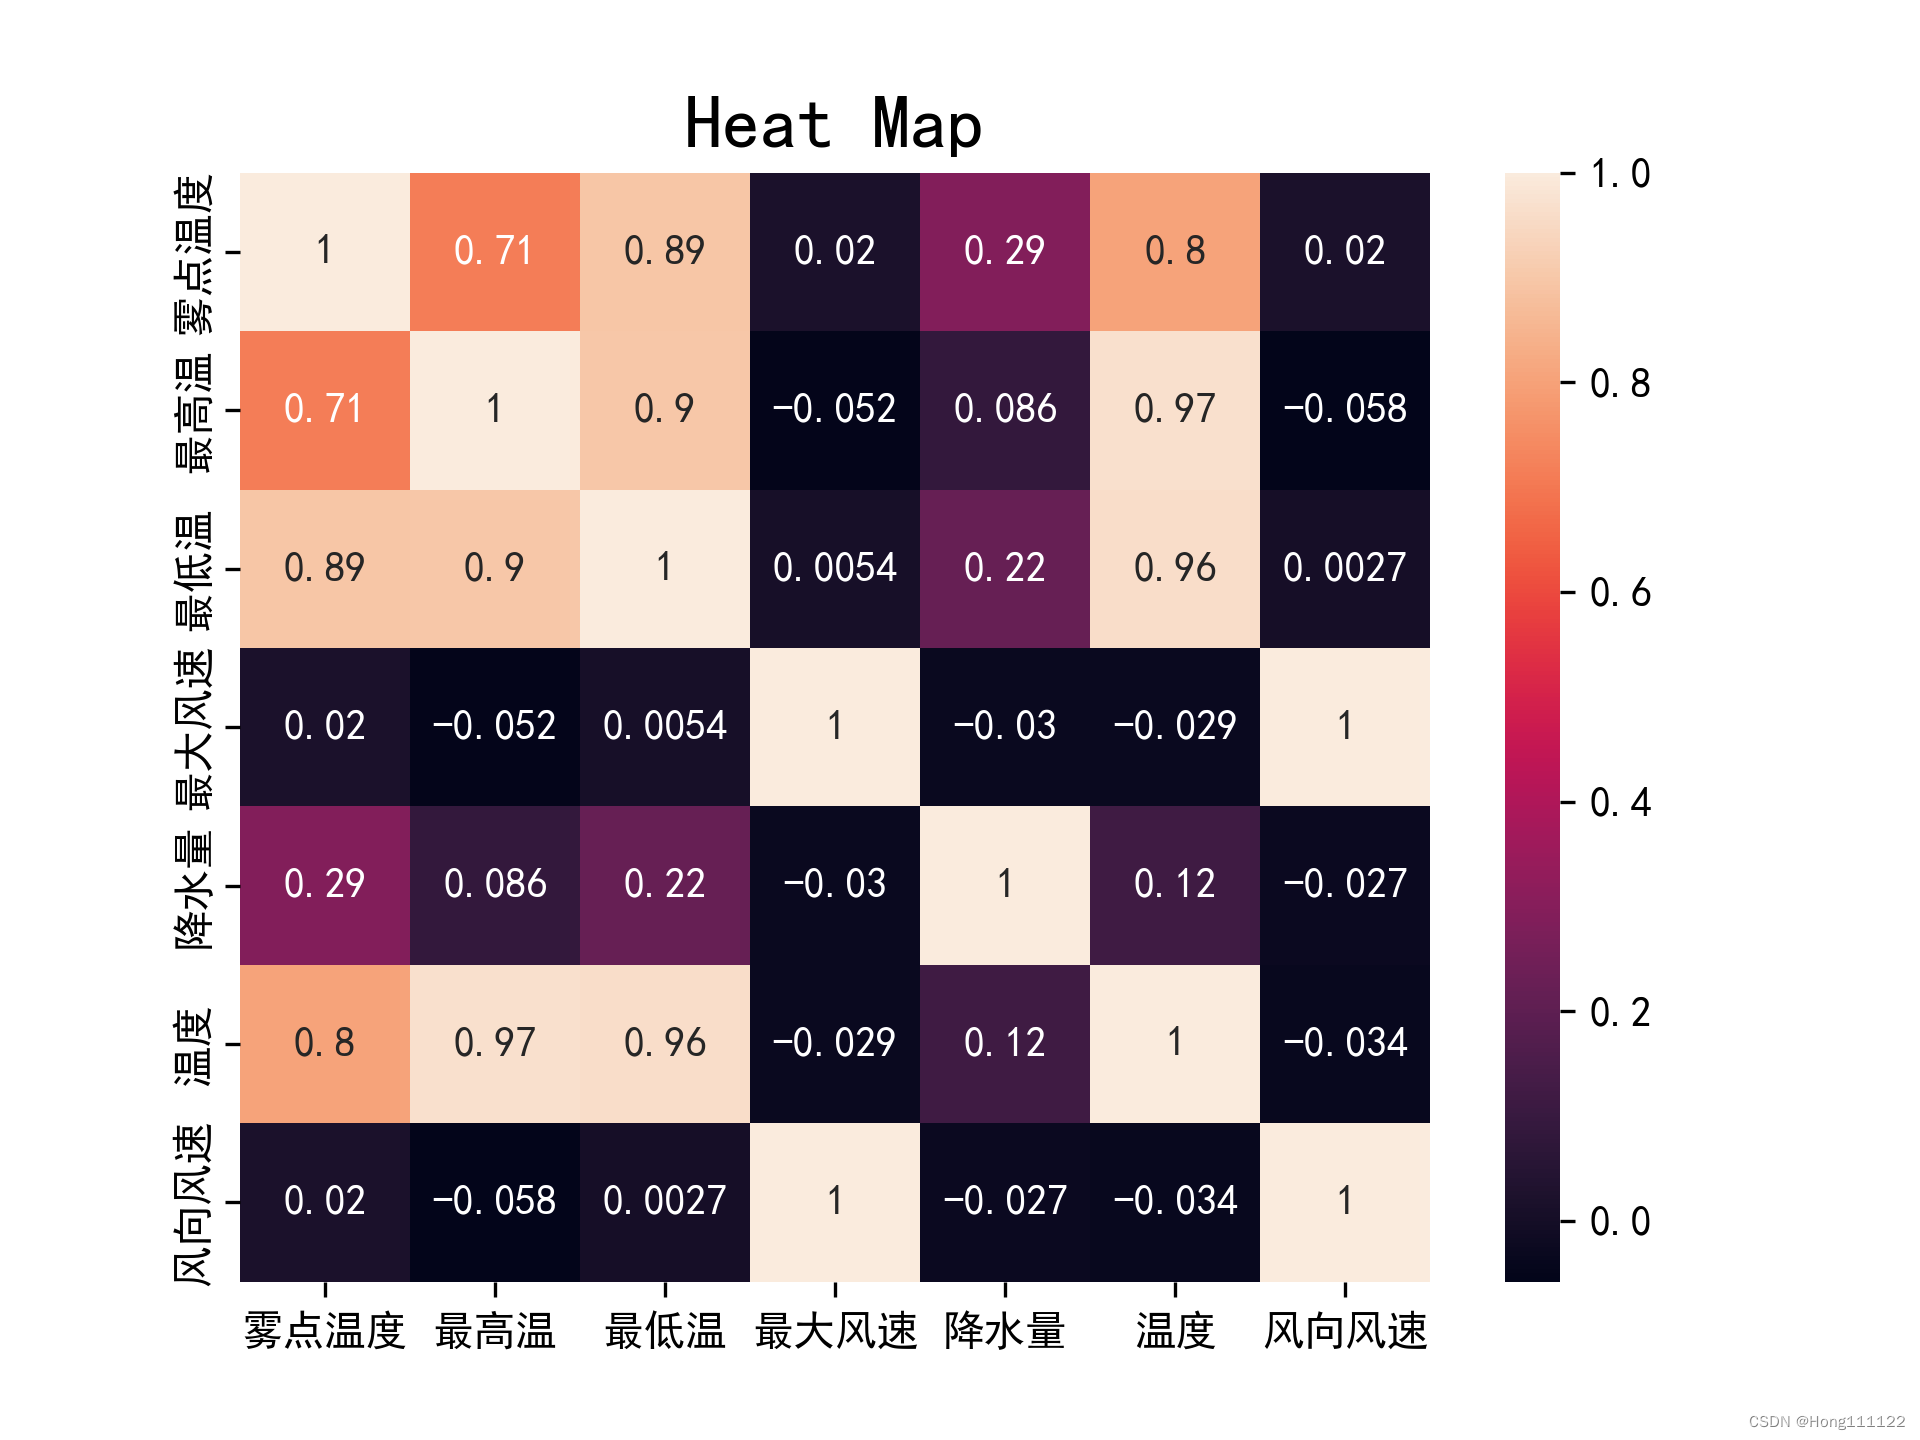
Visualize the generated correlation coefficient matrix (generate a heat map ):
def heatmapplot():

    plt.rcParams['font.family'] = ['SimHei']
    plt.rcParams['axes.unicode_minus'] = False
    sns.heatmap(rho, annot=True)
    plt.title('Heat Map', fontsize=18)
    plt.savefig('heatmap1.png', dpi=300)

2. Spearman correlation
1. Rank correlation coefficient
The rank correlation coefficient (Coefficient of Rank Correlation), also known as the rank correlation coefficient, reflects the relationship between the direction and strength of the change trend of two random variables. Times , a statistic obtained by replacing the actual data with the order of the sample values of each element . It is a statistical analysis index that reflects the degree of rank correlation. The commonly used rank correlation analysis methods include Spearman correlation coefficient and Kendall rank correlation coefficient. Mainly used for data analysis. The Spearman correlation coefficient was defined as the Pearson correlation coefficient between the rank variables.
2. Conditions of use
- Data is nonlinear or nonnormal
- At least one set of data is grade type , such as ranking, position
- There are outliers or wrong values in the data , the Spearman correlation coefficient is not very sensitive to outliers, because it is calculated based on the ranking, and the difference between the actual values has no direct impact on the calculation results
3. Find the correlation coefficient
The more common and simple calculation formula is as follows:
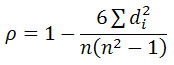
Indicates the difference between the ranking values of the i-th data pair
- nTotal number of observed samples
Using python to solve is similar to the above (metho = 'spearman')
3. Comparison of results
Heat map comparison of two correlation coefficients:
pearson:
spearman:
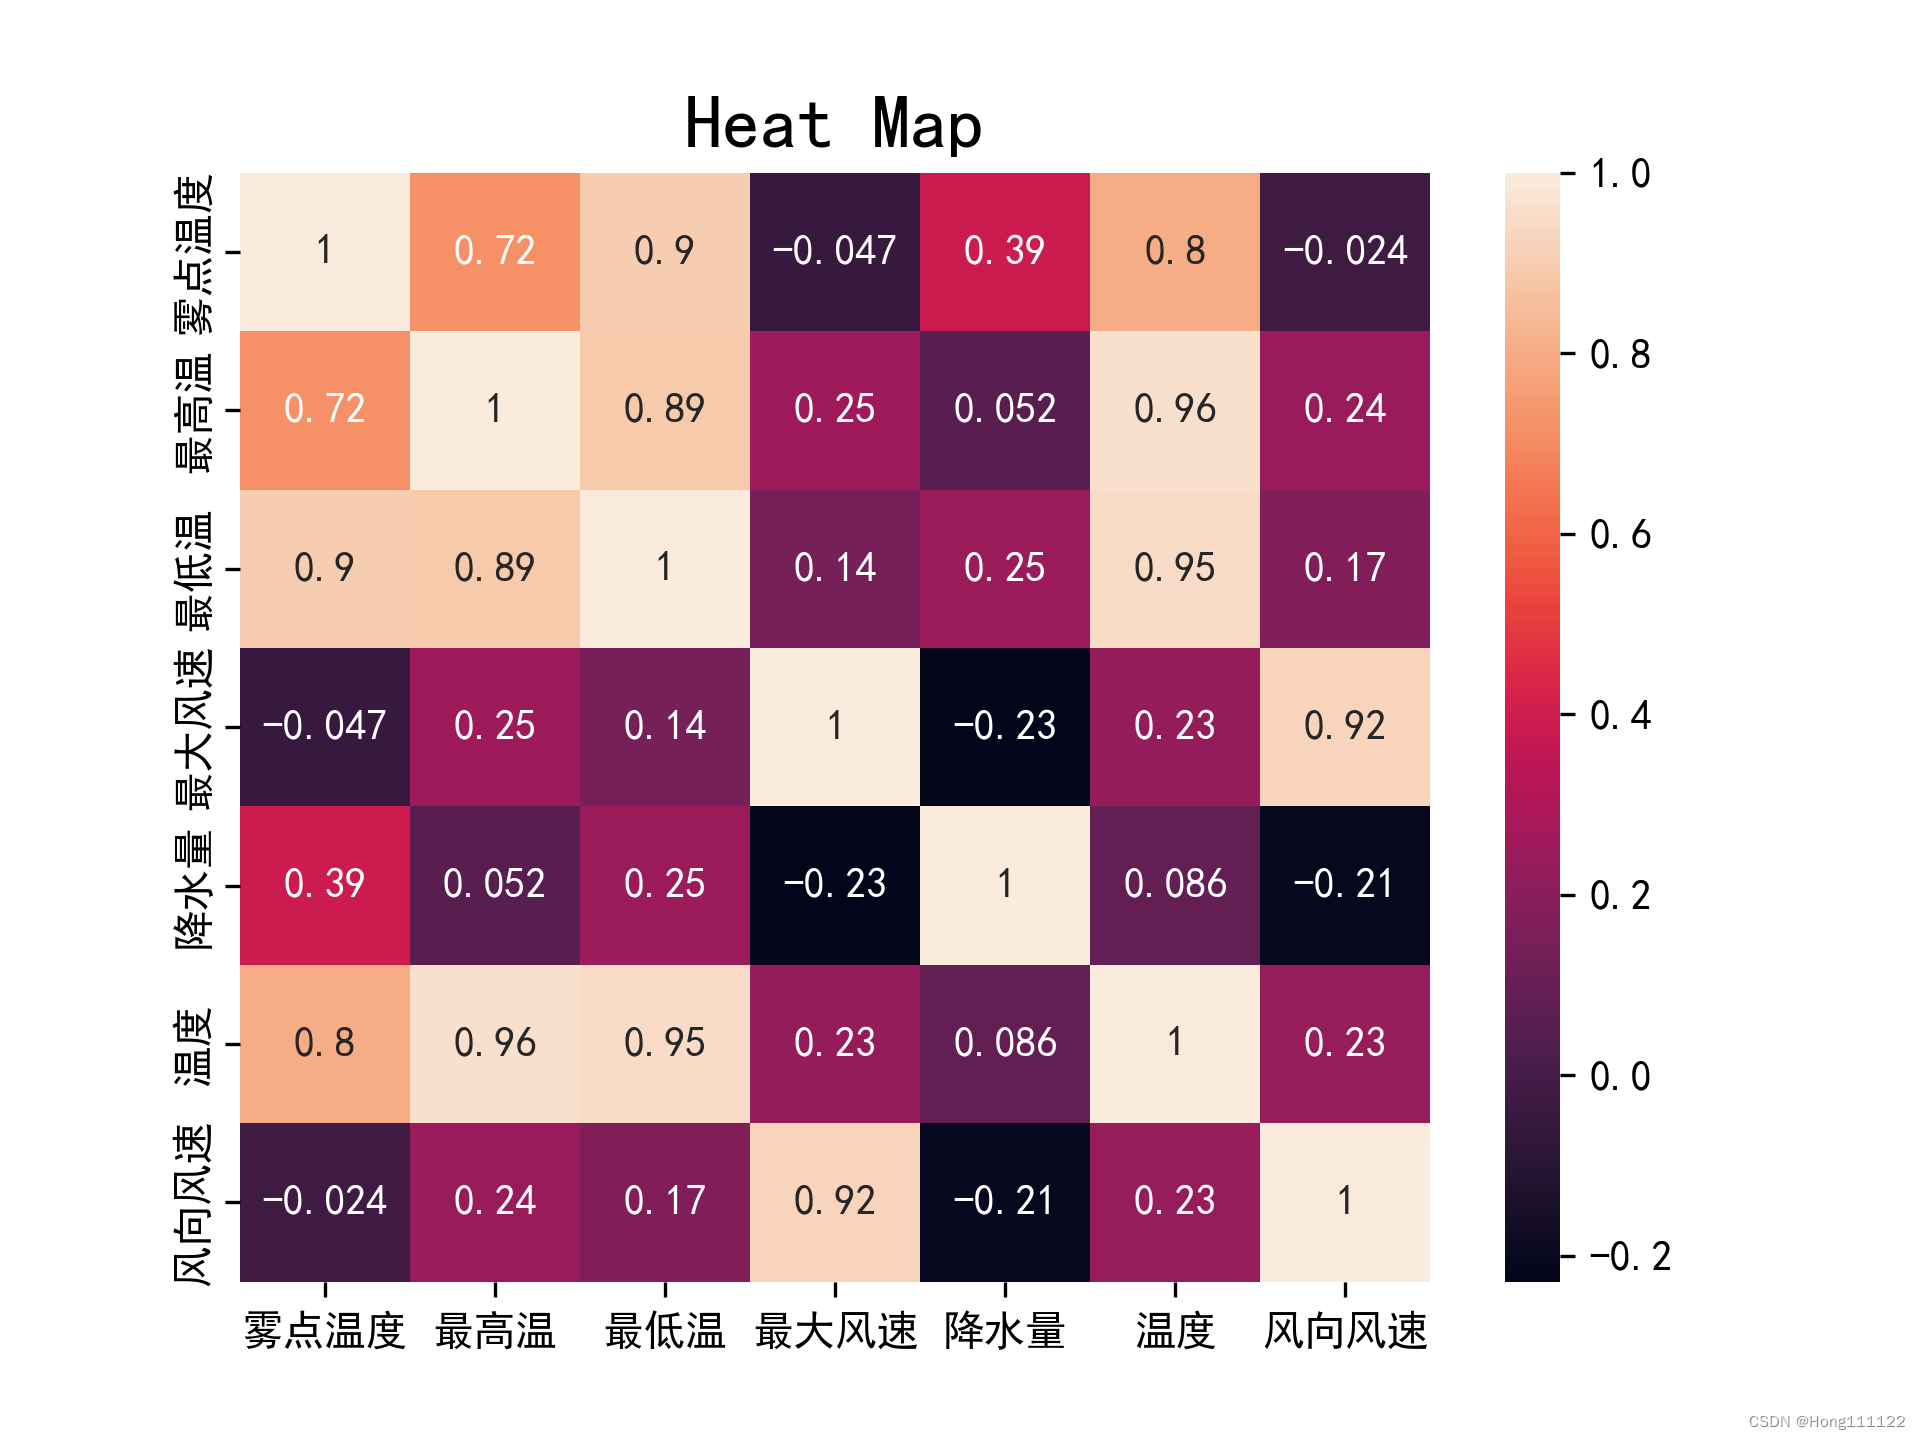
It can be seen that for the same group of data, under the conditions of normality and linearity test, the results obtained by Pearson will be more accurate and strict than those obtained by Spearman.
Summarize
This is the first time I write study notes, if I make any mistakes, I hope you can enlighten me!
Everyone, please give a thumbs up .
It will be released first, and then the significance test will be supplemented later.