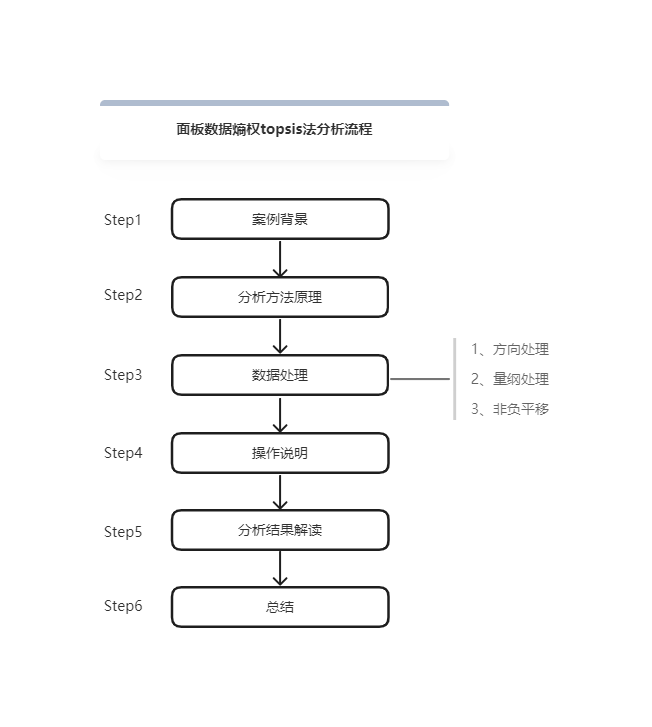
Analysis process of panel data entropy weight topsis method
1. Case background
Currently, there are 9 companies' financial indicator data for 5 consecutive years (2018-2022), and I want to use this data to determine the financial ranking of 9 companies. Because the weights of various financial indicators are different, we choose to use the entropy weight topsis method for research.
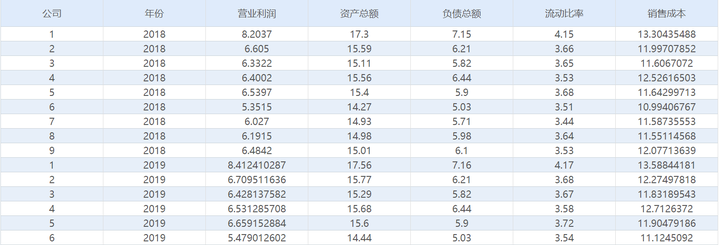
The data is the data of 5 financial indicators of 9 companies for 5 consecutive years. Because it contains both time series data and cross-sectional data, it belongs to panel data. There should be 9*5=45 rows of data, each of the 5 financial indicators occupies a column, and the company number and year each occupy a column. Finally, there should be 45 rows*7 columns of data. Finally, the data should be organized into the following format:
2. Principle of analysis method
The basic principle of the entropy weight method is: the stronger the variability of the index, the higher the degree of dispersion, and it will be given a greater weight, which has a more significant impact on the evaluation target.
The basic principle of the topsis method is to sort the research goals according to the degree of vision from the ideal goal, so as to realize the criticism of the pros and cons of the research goals.
The entropy weight topsis method includes the entropy weight method and the topsis method; the entropy weight method is used to calculate the weight of each evaluation index, and then the weight value is multiplied by the original data to obtain new data, and then the new data is used to calculate the topsis method, and finally the weight of each evaluation object is calculated. Sort by merit.
3. Data processing
Using the entropy weight topsis method for analysis requires three aspects of data processing, namely direction processing, dimension processing, and non-negative translation of data. Next, the operation will be introduced respectively.
(1) Direction processing
The five financial indicators are operating profit, total assets, total liabilities, current ratio, and cost of sales. Among the five indicators, there are both positive indicators (the bigger the better, such as profit), and reverse indicators (the smaller the better, such as cost). In the operation rules of the entropy weight topsis method, the larger the forward index, the better, and the smaller the reverse index, the better, so the data needs to be processed in the direction.
The positive indicators "operating profit", "total assets" and "current ratio" are positively processed by SPSSAU; the reverse indicators "total liabilities" and "cost of sales" are reversely processed by SPSSAU.
SPSSAU [Generate Variables] -> Forward/Reverse -> Confirmation processing, the operation is as shown in the figure below:
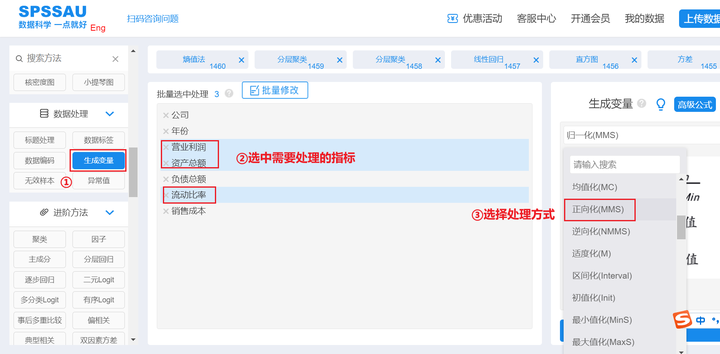
Similarly, the other two indicators can be reversed.
(2) Dimensional processing
After eliminating the influence of data direction, it is also necessary to eliminate the influence caused by different data units, that is, perform dimensional processing. SPSSAU provides more than a dozen dimensional processing methods. Common standardized processing methods include "normalization" to compress data at 0 between 1 and 1; "intervalization" compresses the data within the interval set by itself, and so on. Researchers can choose dimensional processing methods by combining references and their own data characteristics. Different processing methods may lead to different analysis results, but generally there will not be too much deviation.
In this case, because the forward/reverse processing has been carried out in the above analysis, and the forward/reverse processing can solve the problem of direction and dimension at the same time, so there is no need to perform normalization processing again.
(3) Non-negative translation
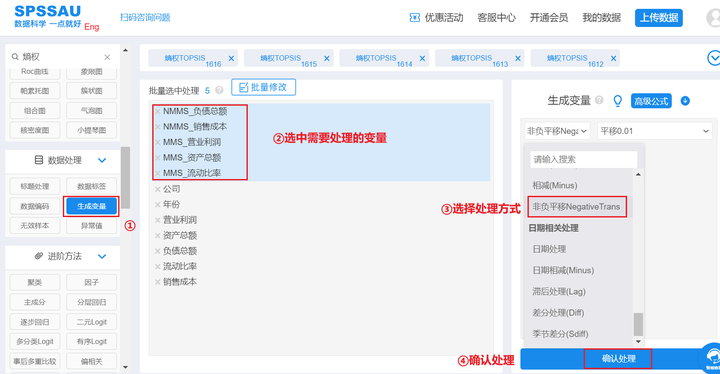
After the data is normalized, some data will be equal to 0, which makes it meaningless to take the logarithmic value when using the entropy method to calculate the weight, which will affect the research results. Therefore, it is necessary to perform non-negative processing on the evaluation index and use SPSSAU to generate The non-negative translation function of the variable is performed. The default translation value of SPSSAU is "the absolute value of the minimum value plus 0.01", and researchers can replace it with 0.001, 0.0001, 0.00001, and 0.1.
SPSSAU operates as follows:
After the data processing is completed, the next step is to introduce how to use SPSSAU to analyze the panel data entropy weight topsis method.
4. Operating Instructions
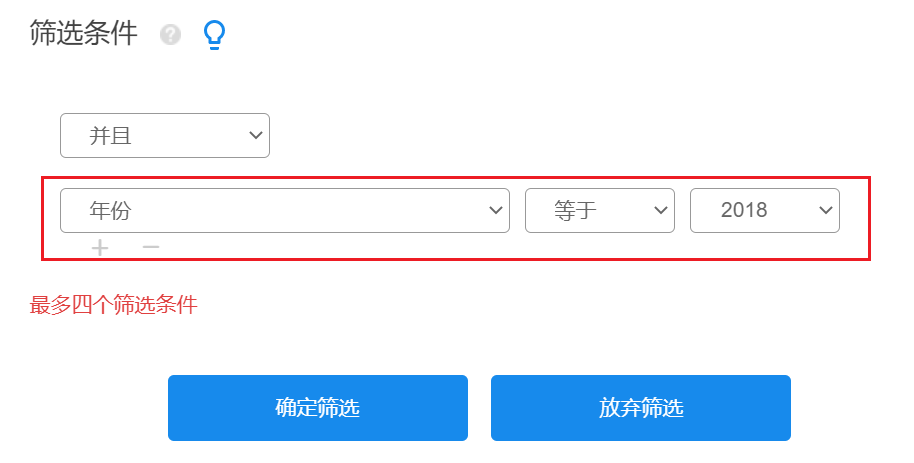
The panel data entropy weight topsis method analysis can be carried out by screening the year, and the analysis is carried out in units of years, and finally the average value is taken as the final analysis result.
The data from 2018-2022 were screened out respectively, and the entropy weight topsis method was analyzed five times. The operation is as follows:
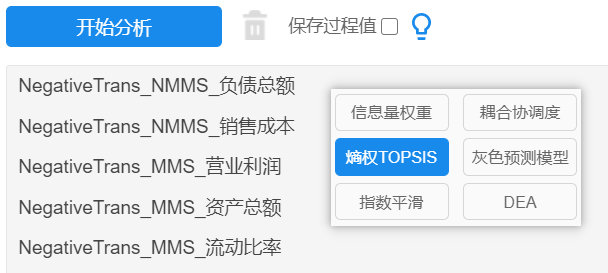
After filtering, use SPSSAU->entropy weight topsis method, drag the indicator into the analysis box, and click to start the analysis, as shown in the figure below:
According to the above analysis process, the data of 5 years were screened sequentially, 5 analyzes were performed, and the results of 5 analyzes were obtained.
5. Interpretation of analysis results
The entropy weight topsis method actually obtains new data after the entropy weight method, and then uses the new data to conduct TOPSIS method research. Therefore, the entropy method calculation weight result table and the topsis method evaluation calculation result table will be output. However, the core of the entropy weight topsis method is to conduct research on the topsis method, and finally to obtain the ranking of the evaluation objects, so the calculation result of the entropy value method is only used as an intermediate calculation process, and it is more important to pay attention to the analysis results of the topsis method.
SPSSAU outputs the calculation results of topsis evaluation in 2018 as follows:
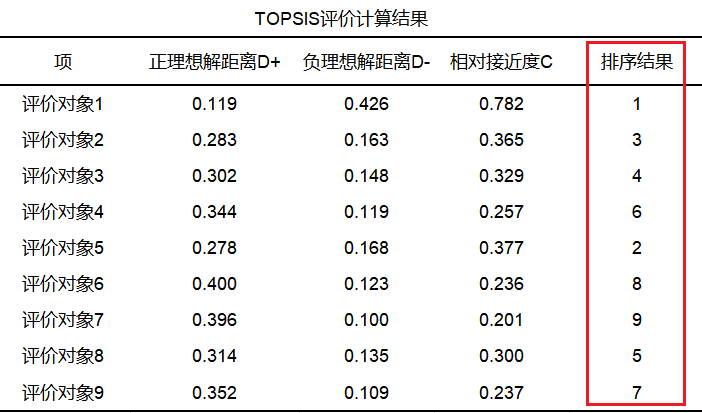
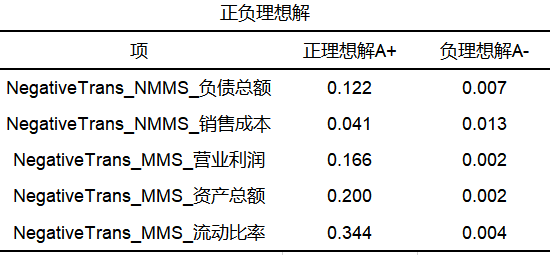
From the table above, the topsis method analysis (automatically completed by the SPSSAU algorithm) is performed on the data generated by entropy weight method, and the financial level of 9 companies is evaluated for 5 financial indicators; the topsis method first finds out the positive value of the evaluation indicators Negative ideal solutions A+ and A- (intermediate calculation process, generally not concerned), and then calculate the distances D+ and D- between each evaluation object and the positive and negative ideal solutions, and finally calculate the relative proximity of each evaluation object to the optimal solution C value, and sorted against the C value.
The above is the analysis result of an entropy weight topsis method in 2018. The panel data takes the average of the relative proximity C values obtained from the five analysis results and sorts them to obtain the final analysis result.
After screening the years, five analyzes were carried out, and the relative proximity C values of the five years were summarized in the following table:
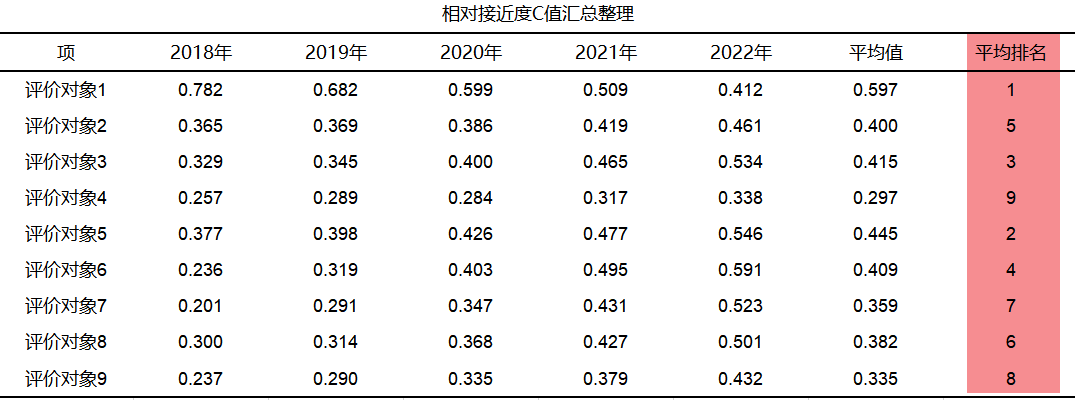
From the summary results in the above table, it can be seen that evaluation object 1, namely company 1, has the highest relative proximity C value, indicating that company 1 has the best performance in financial indicators, followed by company 5, and company 4 has a relative proximity C value Lowest, worst performer on financial metrics.
6. Summary
The entropy weight topsis method is to use the entropy weight method to first obtain the index weight, and then use the weight value to multiply the original data to obtain new data, use the new data to analyze the topsis method, and finally obtain the relative proximity C value of each evaluation object to judge and measure Ranking of the pros and cons of each evaluation object. Analysis, in turn, requires forward/inverse normalization, normalization, and non-negative translation of the data. For panel data, it is necessary to screen the years in turn to obtain the relative proximity C value of each year, and finally obtain the ranking of each evaluation object by calculating the average value.