Table of contents
-
- In order to track method calls more accurately and optimize performance, you can generate instrumentation logs through the Debug class and import them in the Profiler panel for analysis.
- 1. Generate instrumentation logs
- 2. Export logs and analyze data
-
- 1. Find the xxx.trace file in your application directory in the Device File Explorer panel, right-click Save as and save it to a directory you specify, such as the desktop
- 2. Then open the Profiler panel, click the "+" sign, select "Load from file...", import the above file, and then you can analyze the log
- 3. Legend after successful import
- 4. Analyze data
- The above is just a simple example. In actual complex scenarios, we can add instrumentation logs where needed, so that we can analyze performance more conveniently and intuitively, thereby improving the application experience.
- Attached Github source code
In order to track method calls more accurately and optimize performance, you can generate instrumentation logs through the Debug class and import them in the Profiler panel for analysis.
1. Generate instrumentation logs
1. Tool class encapsulation
/**
 * 在需要开始跟踪的地方调用如下代码,将生成的文件保存在指定目录中
 * @param context 使用指定的上下文生成跟踪文件目录和名称
 */
fun startTrack(context: Context) {


    val name = context.javaClass.simpleName
    val path: String = context.filesDir.path + "/track-${

      System.currentTimeMillis()}-$name.trace"
    "path====> $path".logD()
    Debug.startMethodTracing(path)
}

/**
 * 结束跟踪
 */
fun stopTrack() {


    Debug.stopMethodTracing()
}
2. Called in the example
/** 点击界面上的一个按钮,开始追踪 */
viewBinding.button.setOnClickListener {


    startTrack(this)
    viewModel.sleepOnMainThread()
    stopTrack()
}
3. Time-consuming simulation
/** 在主线程睡眠2秒,模拟耗时操作 */
fun sleepOnMainThread() {


     kotlin.runCatching {


         Thread.sleep(2000)
     }
}
2. Export logs and analyze data
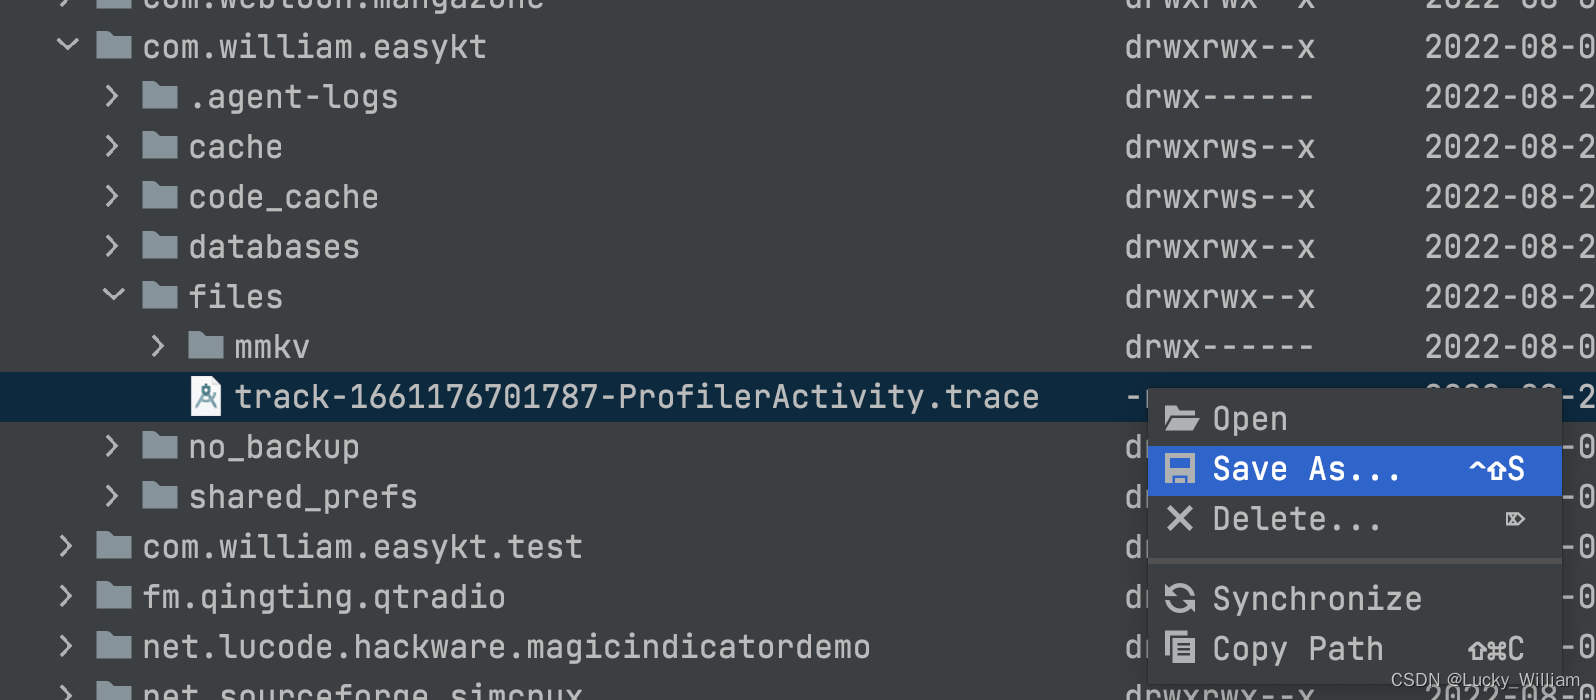
1. Find the xxx.trace file in your application directory in the Device File Explorer panel, right-click Save as and save it to a directory you specify, such as the desktop
// 例如我在示例中生成的文件路径
/data/data/com.william.easykt/files/track-1661176701787-ProfilerActivity.trace
The export operation is as follows:
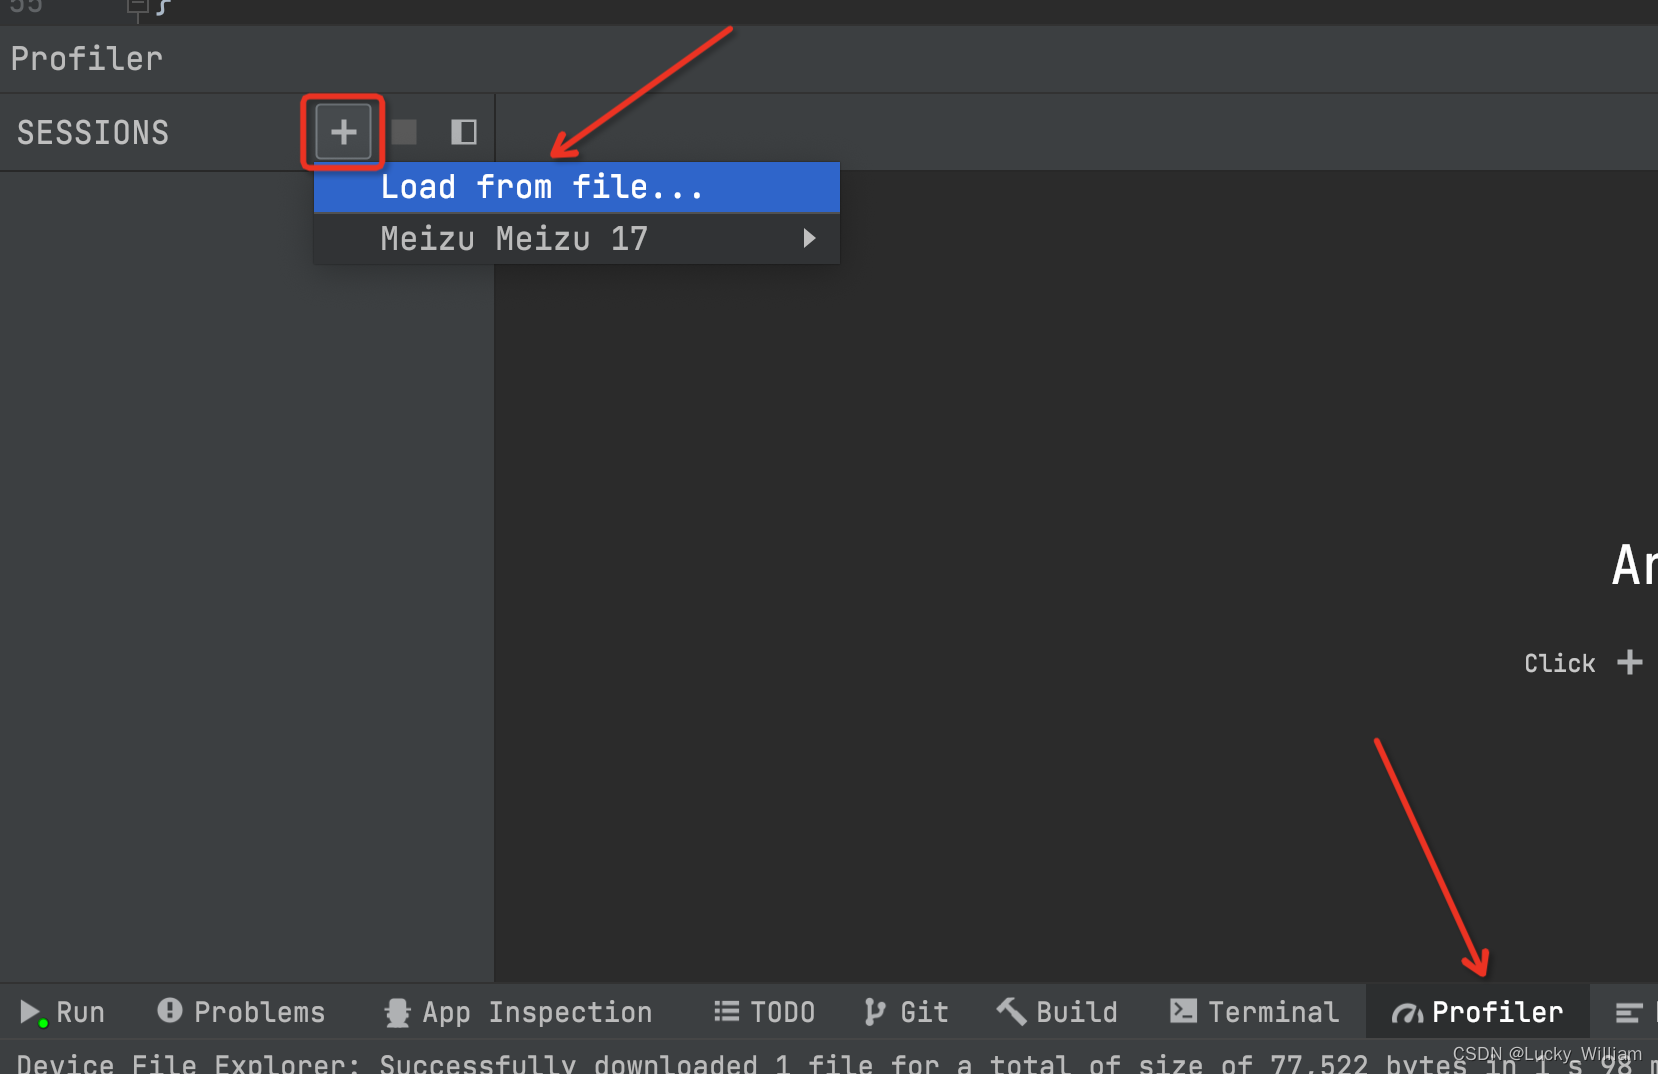
2. Then open the Profiler panel, click the "+" sign, select "Load from file...", import the above file, and then you can analyze the log
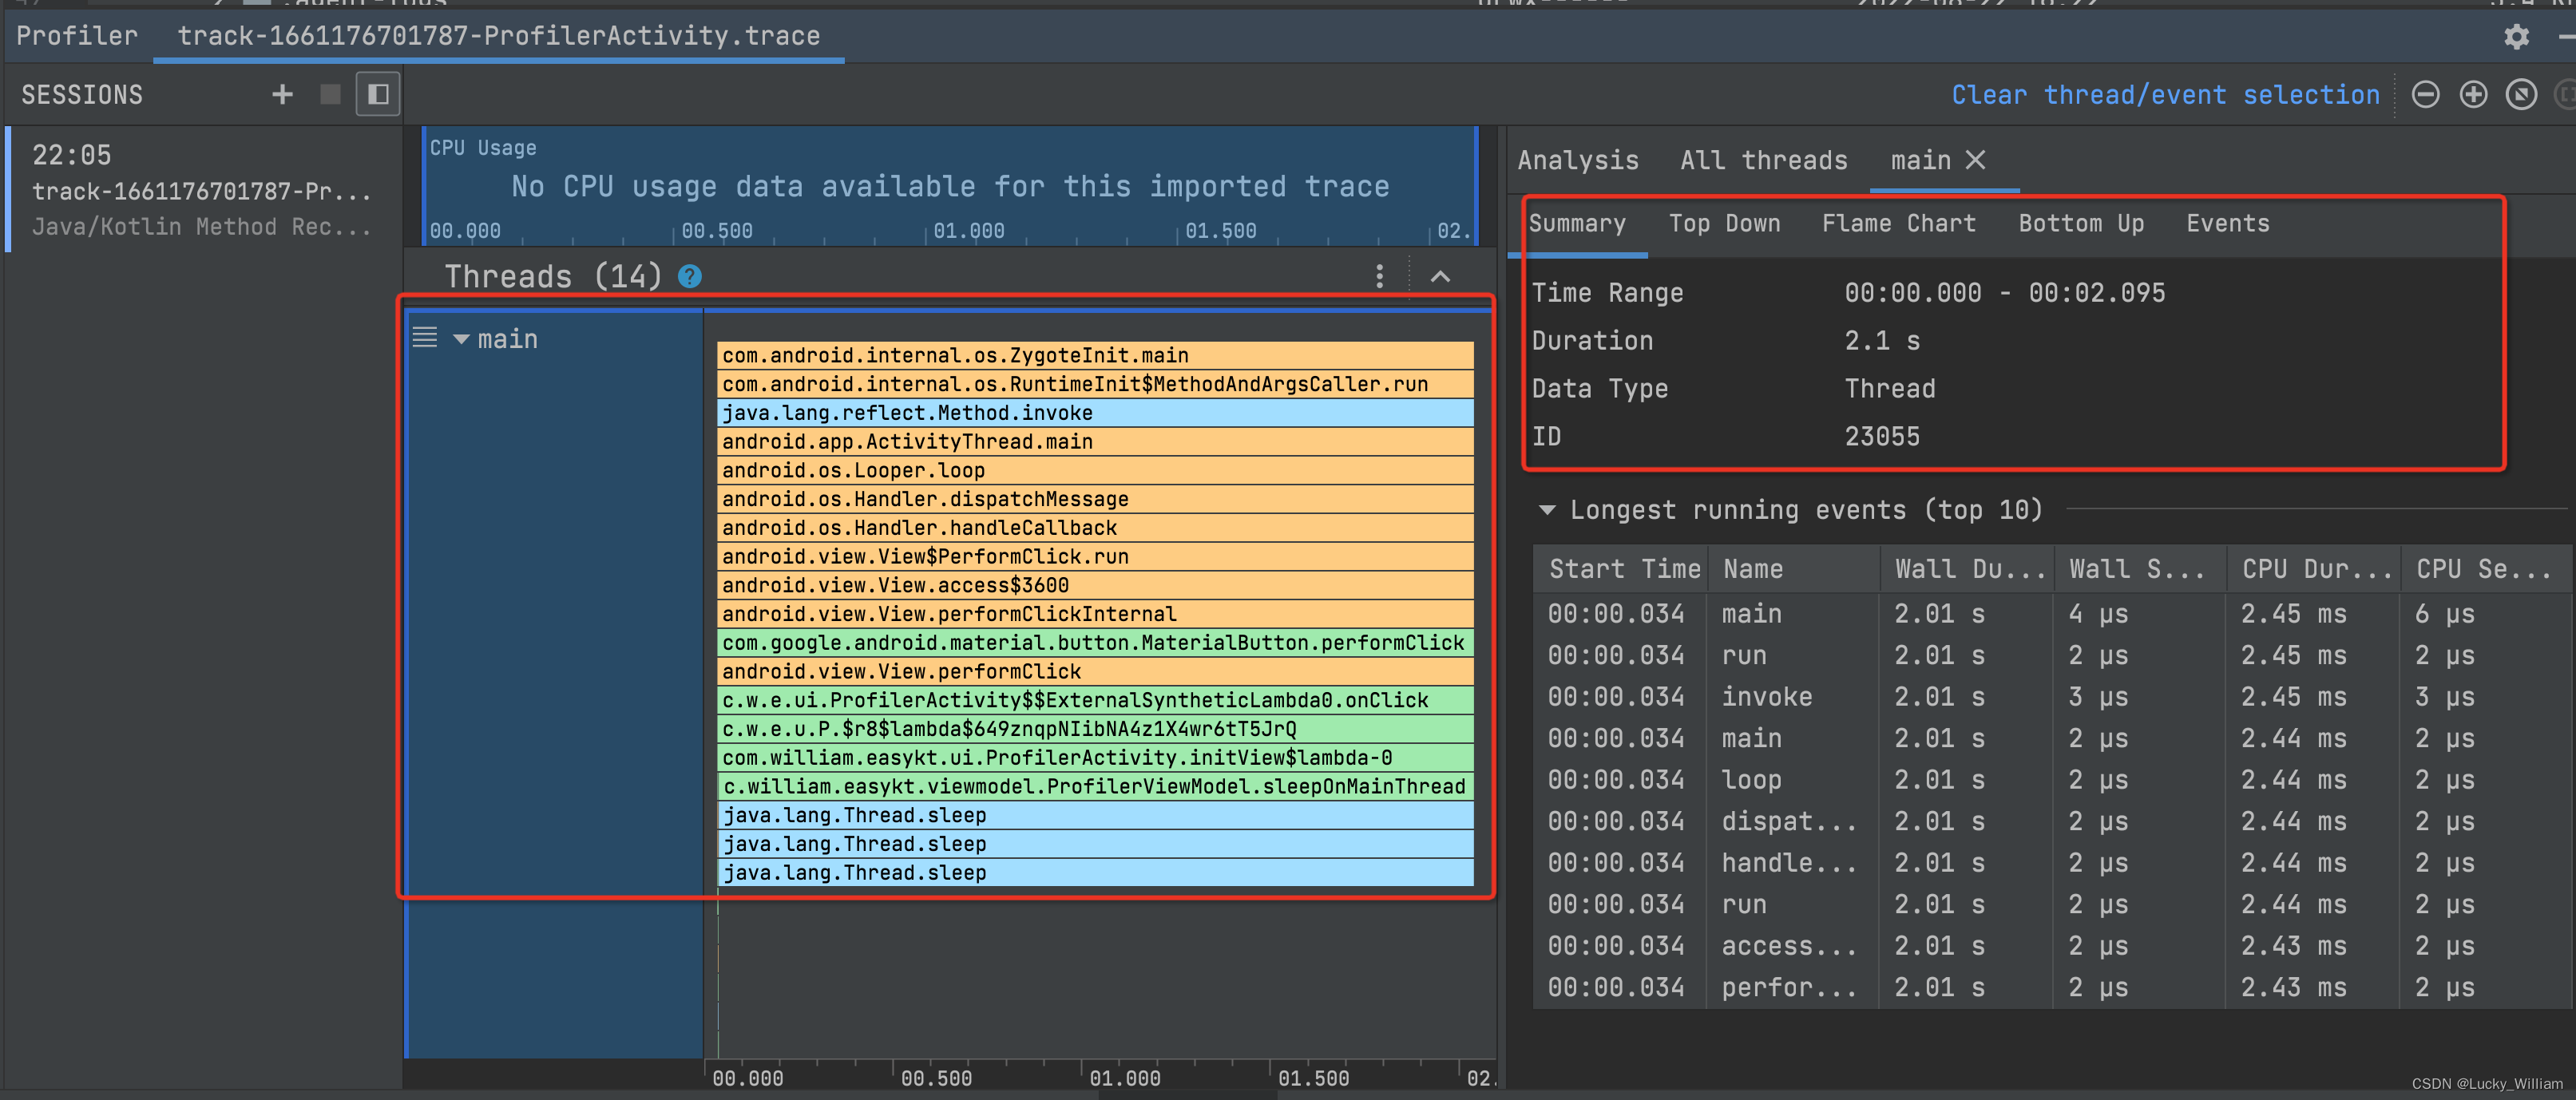
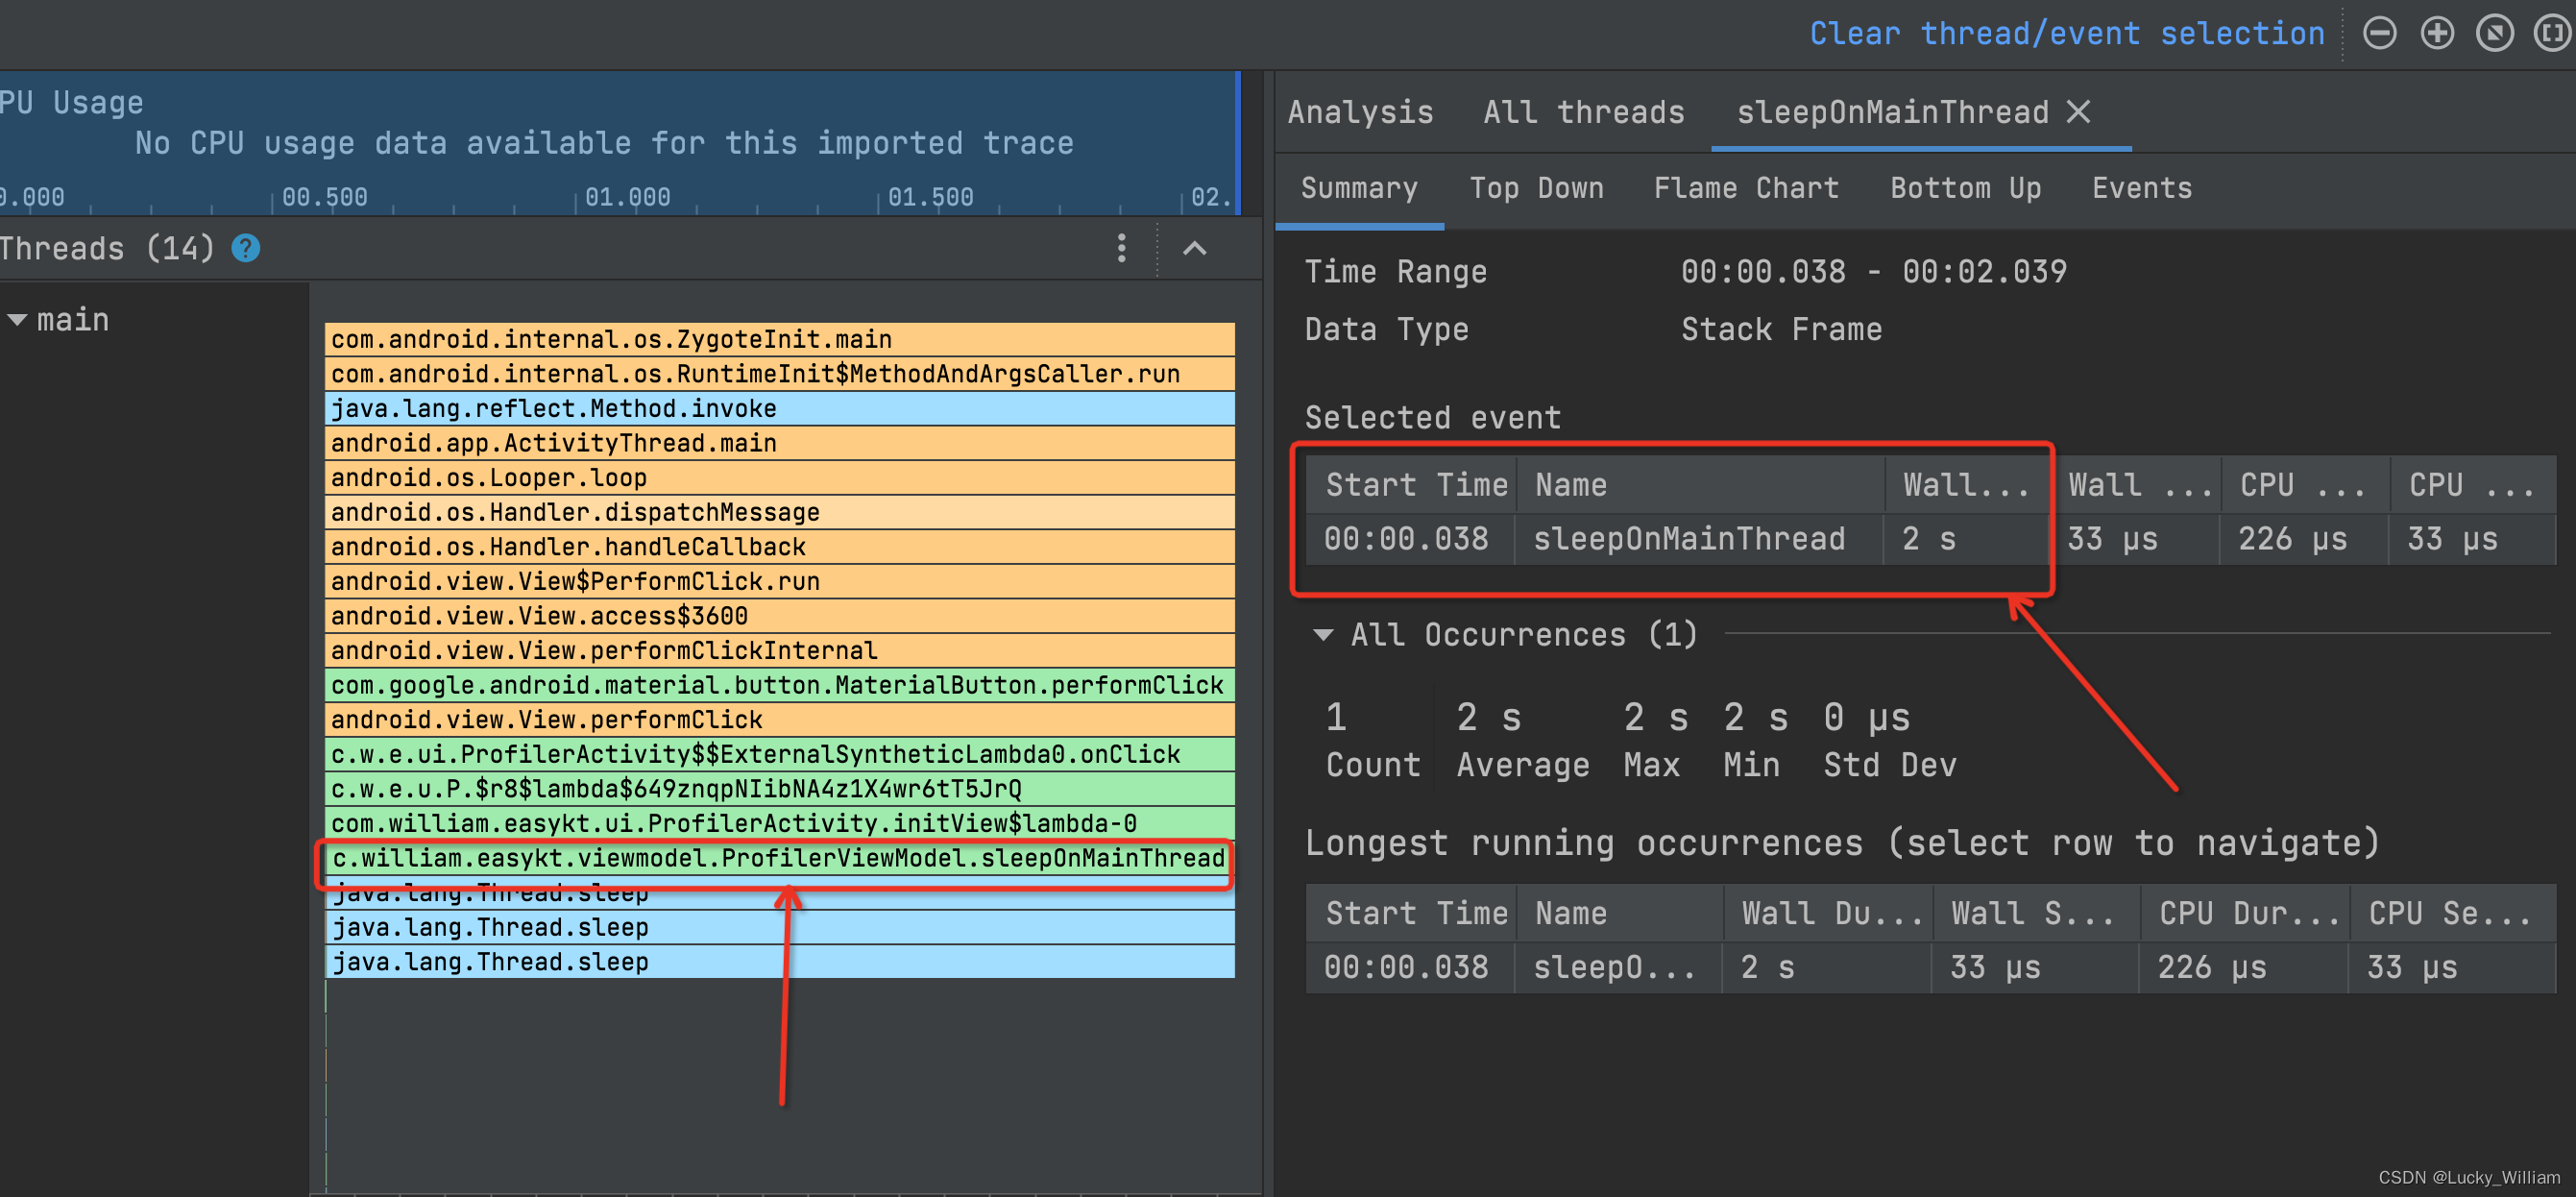
3. Legend after successful import
- The method call trace diagram in the main thread main is intercepted in the red box on the left
- The red box on the right corresponds to the method call details in the main thread main
4. Analyze data
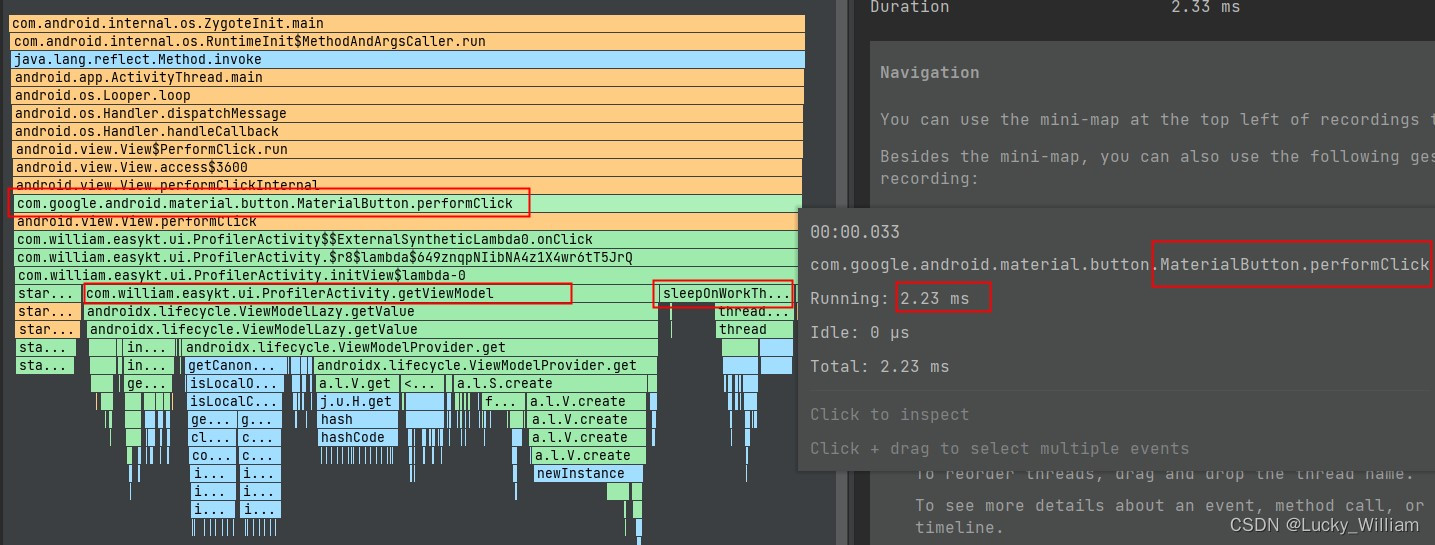
- From the figure below, you can see the execution track of the method call, from top to bottom, distribute events, respond to button clicks, and finally execute the sleepOnMainThread() method of ProfilerViewModel. You can see that the time details on the right are 2s.
- Now we modify it as follows, put the simulated time-consuming operation in the child thread, and re-run to generate the log
fun sleepOnWorkThread() {


    thread {


        kotlin.runCatching {


            Thread.sleep(2000)
        }
    }
}
- Through the regenerated log data, it can be observed that the time spent on the click operation has been shortened to 2.23ms