There are many optimization indicators, I am often asked in interviews, 555
1. Package size
2. Response time
3. Memory
4. CPU
5. Power consumption
6. UI
package size optimization
is to reduce the size of the apk package, the size of the apk mainly depends on the res Resource files and .class files in the directory.
Optimization measures include:
01. Compress image size, use it in the project.
02. In AS, compress images in png and other formats into .webp format, which can further reduce image size.
03. To reduce the use of local resources as much as possible, you can consider pulling pictures, lottie, so libraries and other resources from the server.
04. Use lottie to replace the use of frame animation to reduce the use of frame animation image resources.
05. Use the configured obfuscation file to delete useless code and reduce the size of the dex file.
Response time optimization
For users, the shorter the response time, the better. The shorter the response time, the smoother the operation.
Response speed includes start-up speed--the process of clicking the APP button to fully open the APP home page is as fast as possible; page response speed--after the user performs operations such as adding age and East China, the page can respond quickly. The app should not be stuck, let alone ANR.
Specific optimization measures include:
01: Time-consuming operations should be put into sub-threads for processing, and the main thread should not be blocked.
02. Resources such as the SDK should be loaded in a lazy way, only loaded when needed, and not loaded when not needed.
03. Avoid printing a large number of logs in the online environment.
04. Use the inBitmap variable of BitmapFactory.Option to reuse the old Bitmap, avoid allocating memory for the new Bitmap multiple times and destroying the old Bitmap, and avoid allocating memory for the new Bitmap multiple times and destroying the old Bitmap (if the Bitmap is used frequently) 05.
Optimize view rendering time:
If the view is more complicated, you can consider using ConstraintLayout to constrain the layout and reduce the level of view rendering.
If the view view is relatively simple, consider using the LinearLayout horizontal layout for optimization (because the rendering time of the linear layout is shorter than that of the coordinator layout and the relationship layout).
What kind of nested layout, sometimes the same control on the app page, do not rewrite it on each page, at this time, extract the common controls and public pages, write a layout file separately, and import it with include .
Recyview list control optimization:
01: The view optimization of the item's view, if the default animation of recyview is not needed, delete it. (such as flashing animation effect when refreshing)
02: Increase the number of item caches in recyview, and cache the data requested by the network to avoid secondary requests to the network.
03: Avoid performing time-consuming operations in onBindViewHolder, because onBindViewHolder is executed on the main thread, adding time-consuming operations to onBindViewHolder will affect the smoothness of sliding.
04. Try to use local refresh in recyview to avoid global refresh.
To check whether the view is rendered transitionally, you can enable the following settings in the mobile developer mode.
Unfinished...loading...
memory optimization
To reduce the use of memory, the main purpose is to avoid creating too many objects to occupy too much memory, avoid memory jitter and avoid memory leaks.
Memory jitter refers to the frequent creation and destruction of memory. During this process, the garbage collection period will also work frequently, which affects performance memory.
A memory leak is the memory that should be reclaimed by the GC, but it cannot be reclaimed because it is still being referenced by other objects. Memory leaks are a serious problem. Excessive memory leaks can lead to memory overflow and OOM system errors.
01. The singleton class references the Context causing a memory leak.
02. Non-static internal class banks use external classes to cause memory leaks.
03. The handler references the activity causing a memory leak.
04. The attribute animation is not cancelled, resulting in a memory leak caused by the view being always referenced.
05. The listener is not cancelled, and the callback is not unregistered.
The memory optimization measures are:
01. Use the thread pool to reuse threads, because the threads themselves will occupy relatively large memory, and reuse can leave part of the memory.
02. Avoid creating objects in the onDraw method. Because onDraw will be used frequently, the objects inside it will also be frequently created, which takes up too much memory.
03. Try to use StringBuilder or StringBuffer to concatenate strings to reduce the use of String. (Because when concatenating strings, String will create a new object, while StringBuilder and StringBuffer are concatenated on the basis of the original string)
04. Clear when the view resource is invisible to avoid occupying memory. For example, Bitmap executes the .recycle method to clear and destroy image and lottie resources.
05. Optimize for memory leaks:
001: The singleton class should refer to the Context of the Application, because the declaration cycle of the Context of the Application is consistent with that of the APP, and it will not cause the problem that the singleton class refers to the context of an activity so that the activity cannot be recycled.
002: Change the non-static inner class to a static inner class so that the outer class will not be referenced.
003:handler: a.handler calls removeCallbacksAndMessages(null) to clear the queue when using the end time;
b.Static inner class + weak reference method can avoid memory leaks.
static class SafeHandler extends Handler {
     WeakReference<MainActivity> activity;
     public SafeHandler(MainActivity mainActivity) {
             activity = new WeakReference<MainActivity>(mainActivity);
    }
    @Override public void handleMessage(Message msg) { }
}
004: Attribute animation, the listener should be canceled in time when it is used, and the callback of broadcasting or other external libraries should be unregistered in time.
CPU optimization:
The role of the CPU is to calculate and process information and run programs. Therefore, the direction of optimization is to reduce the calculation work of the CPU and improve the calculation efficiency of the CPU.
The specific optimization measures are:
01: Avoid the main thread from executing time-consuming tasks, and time-consuming tasks are executed asynchronously in sub-threads.
02: Avoid performing a lot of time-consuming operations in the onDraw method.
03: Lazy loading and lazy initialization of information that is not needed for the time being.
Power consumption optimization:
The optimization measures are:
01: Avoid frequent network requests.
02: To avoid tasks being executed frequently, you can wait for a certain number of tasks to be executed together.
03: Avoid frequently waking up the screen. (Frequently waking up the screen will prevent the system from going to sleep and consume a lot of power)
Ensuring that the performance indicators do not drop is an important thing in the development process. If the development of new functions leads to performance problems such as freezes, a sharp increase in heat consumption and power consumption of the fuselage, and increased memory, it will lose users instead, and the loss outweighs the gain. Therefore, paying attention to performance is also an important task for R&D personnel. Working
temperature optimization
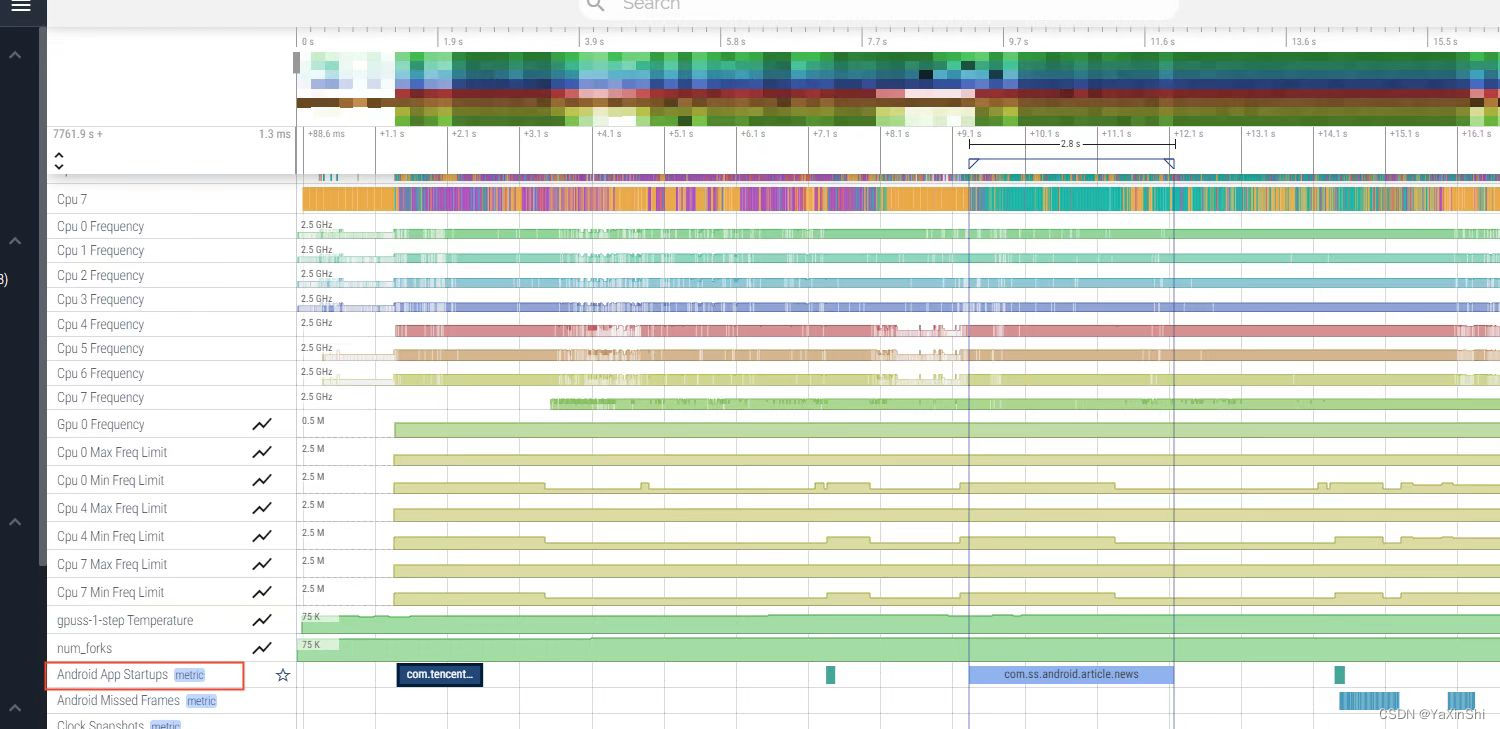
Mobile phone manufacturers all limit the left and right temperature control of mobile phones, such as shutting down at 57 degrees, and so on. To cool down the phone when the temperature is too high, there are generally two temperature indicators, one is the motherboard temperature, and the other is the shell temperature. I will add later on how to obtain the phone’s motherboard temperature and shell temperature.
Temperature control optimization needs to capture the systce at different temperature stages when the application is started, and then use the performance analysis tool Perfetto to see the frequency increase hz of cpu0 to cpu8, small core, medium core, and super large core when starting, and you can also see the starting temperature of the application , open a few cores, and look at the cold start of the application. During the analysis, you can also search through key keywords such as PostFork and Zygote to see the startup process of the application. The Android App Startups of the analysis tool can also see which applications are cold started. As shown below
Unfinished...loding...