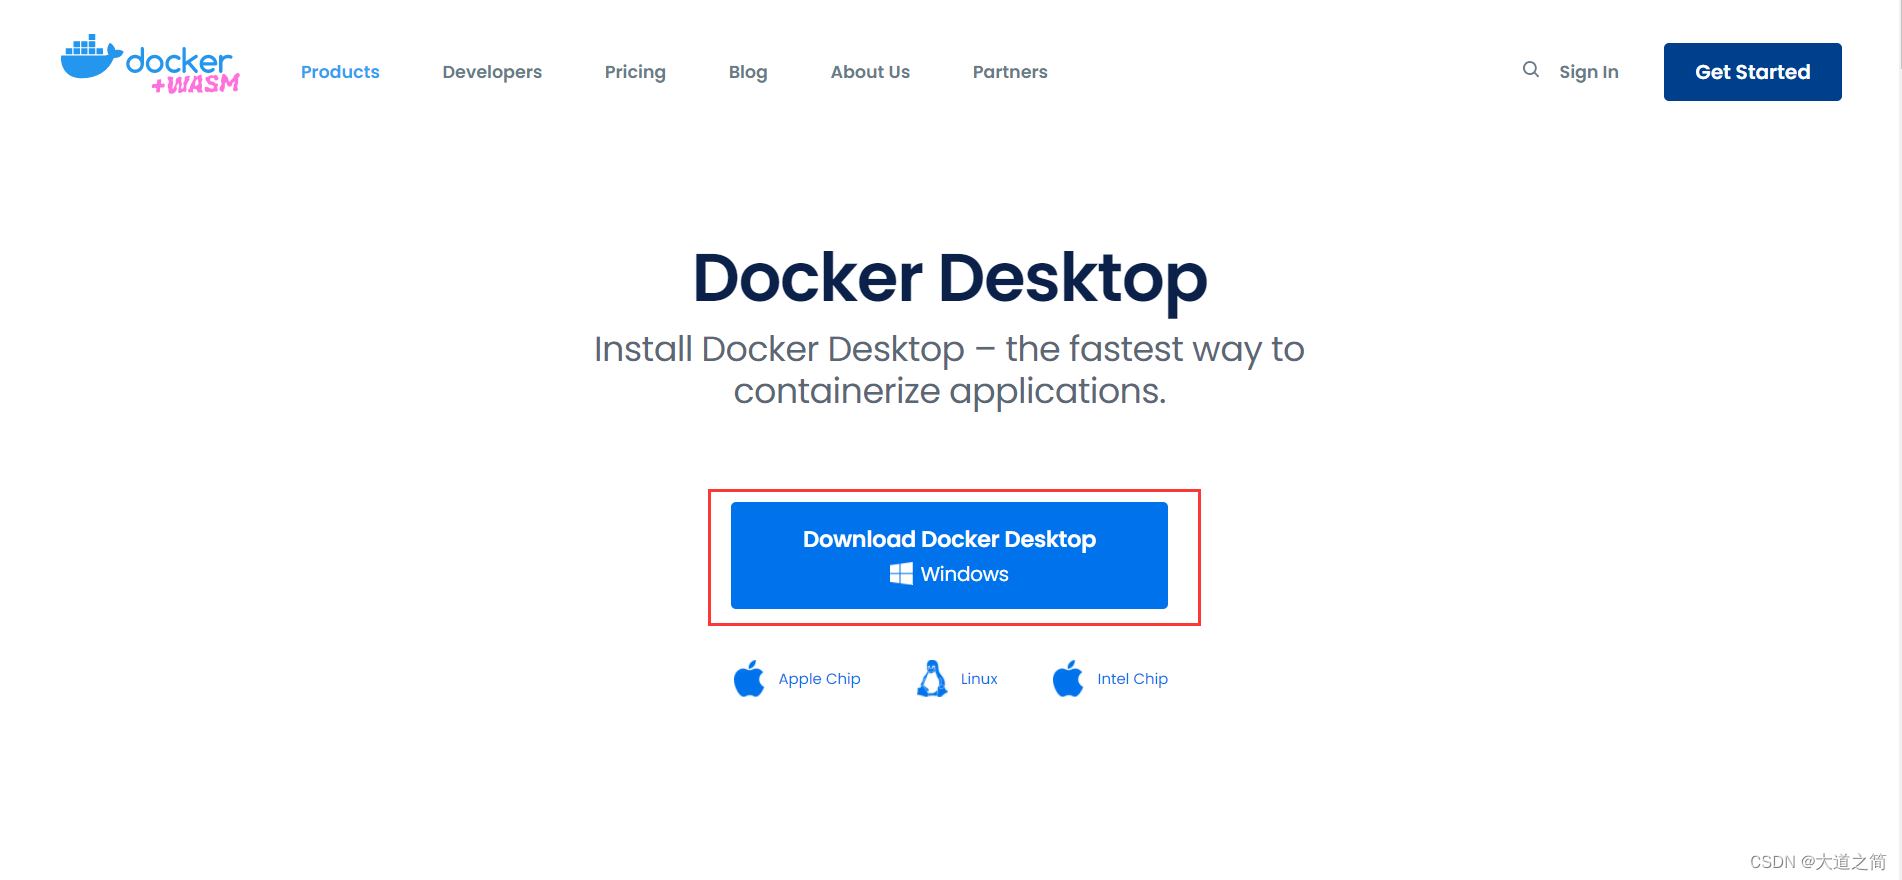
1. Docker download
1. Just install it based on Docker Desktop
2. Open
①, open Hyper-V (Windows10 is easier, this article is based on Windows11)
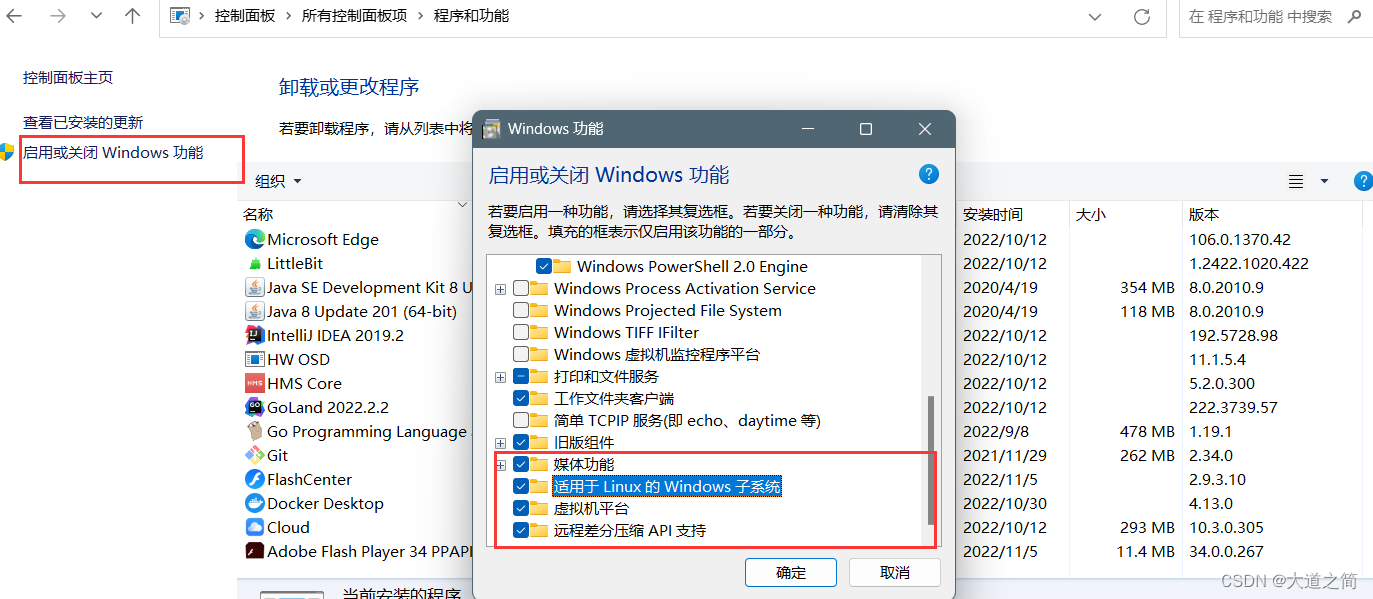

②, install WSL2 kernel (run Linux on Windows, support Docker)
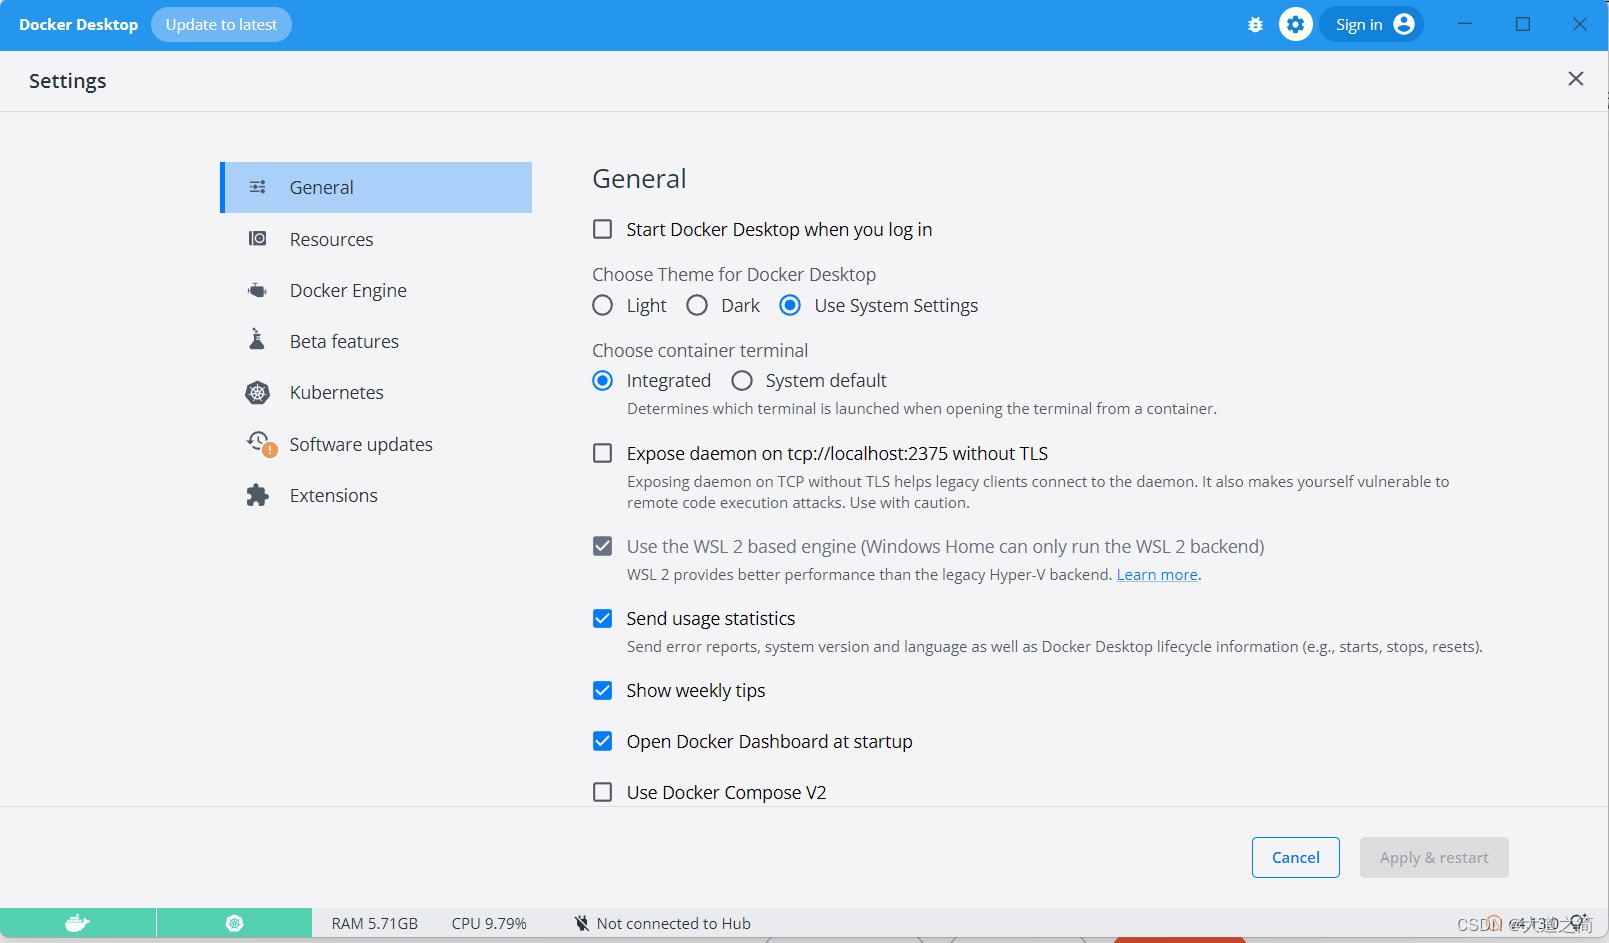
3. Click the downloaded file directly to install
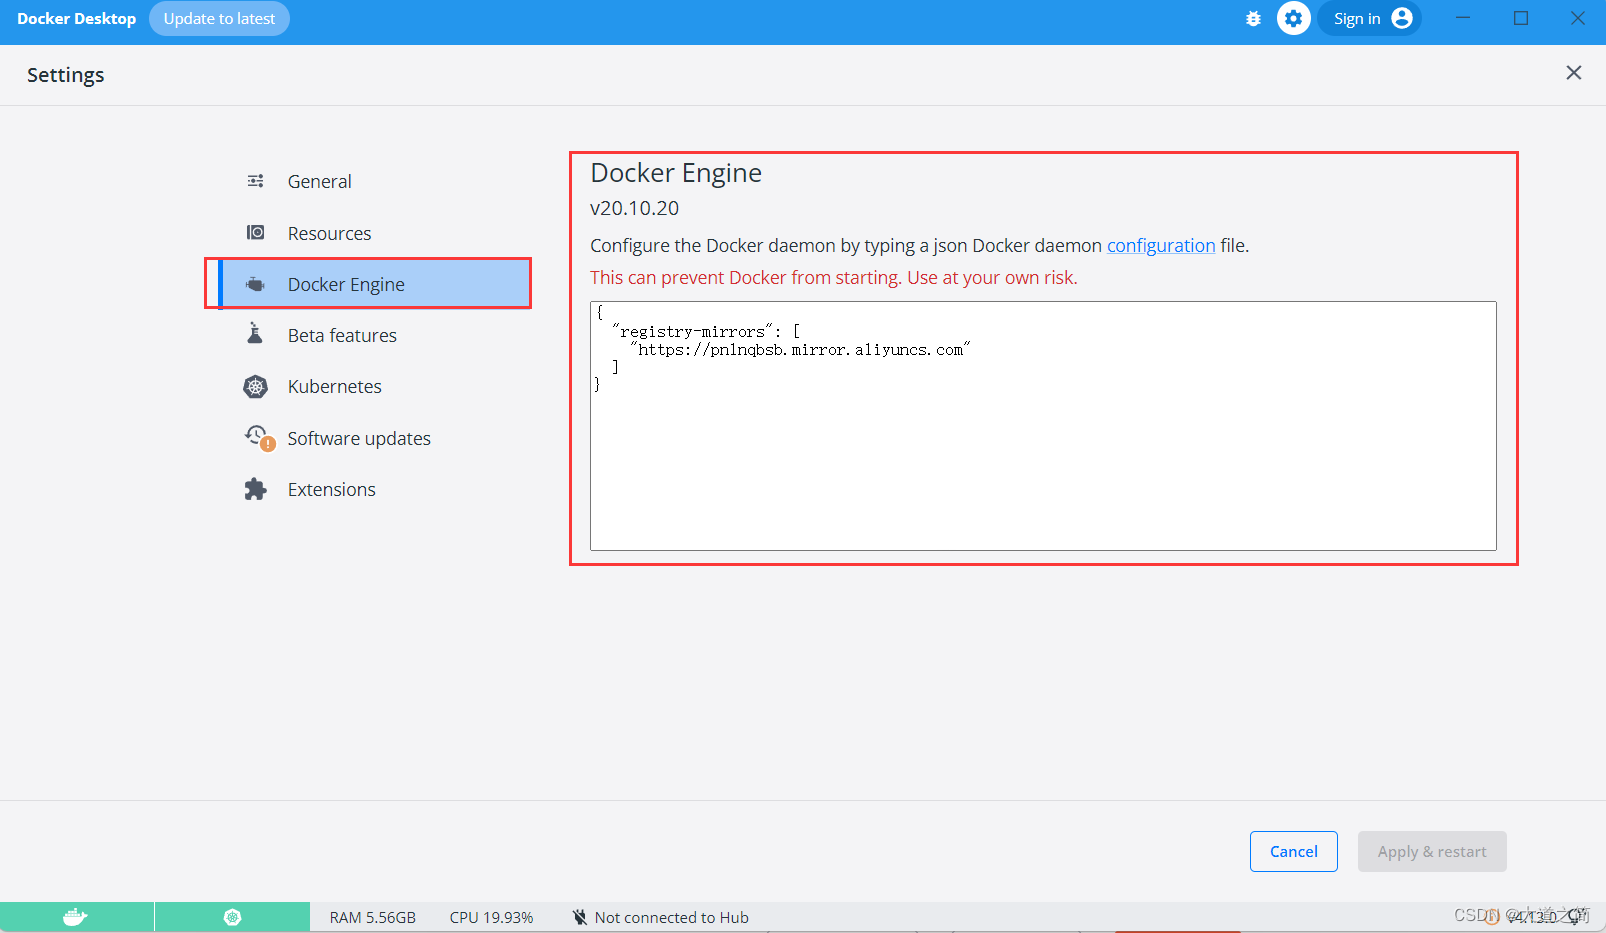
Configure the mirror accelerator, here use Aliyun's
{
  "registry-mirrors": [
    "https://pn1nqbsb.mirror.aliyuncs.com"
  ]
}
 interface modification
2. Install k8s.
K8s is an example of a well-architected distributed system that treats all machines in a cluster as part of a single resource pool. Like other mature distributed systems, K8s is mainly composed of a control node (master) and a working node (node), and different components are installed on each node.
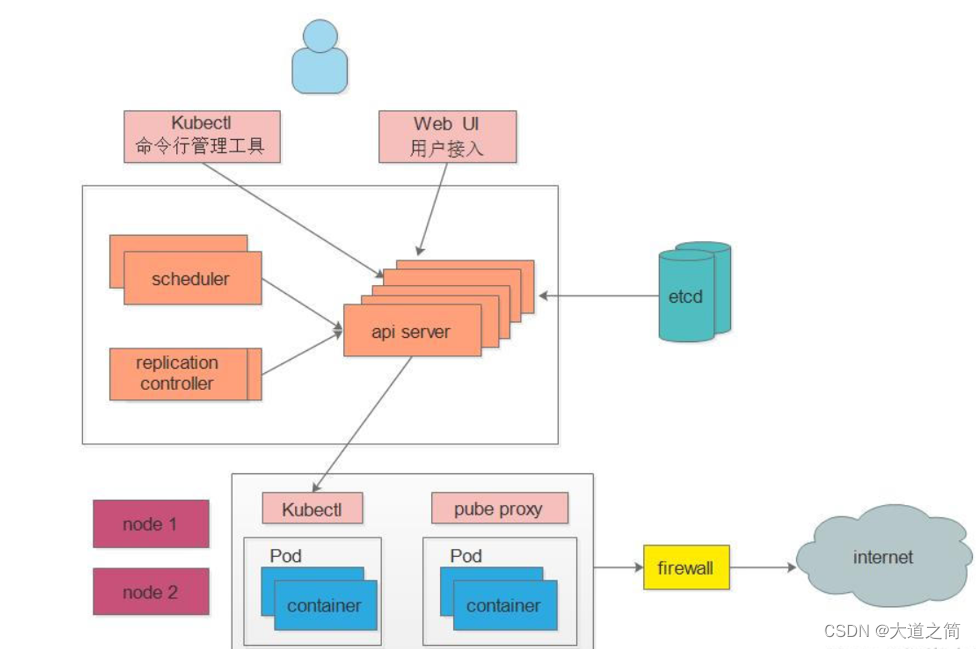
k8s architecture diagram
Introduction to k8s components
The Master in K8S is the cluster control node, responsible for the management and control of the entire cluster
ApiServer : the only entrance for resource operations, receiving commands input by users, providing authentication, authorization, API registration and discovery mechanisms, and other modules query or modify through the API Server For data, only the API Server directly interacts with etcd;
Scheduler : responsible for cluster resource scheduling, monitors the newly created Pod replica information through the Watch interface of the API Server, and schedules the Pod to the corresponding node node according to the predetermined scheduling policy; ControllerManager:
in K8S The automatic control center of all resource objects monitors the status of each resource object in the cluster in real time through the restful interface provided by api-server. The state is restored to the expected working state. Common controllers include Namespace Controller, Node Controller, Service Controller, ServiceAccount Controller, Token Controller, ResourceQuote Controller, Replication Controller, etc.; Etcd: is the database that stores the state of Kubernetes (all the persistent state of the
master is It exists in an instance of etcd)
Node: It is the workload node in the K8S cluster. Each Node will be assigned some workload by the Master. When a Node goes down, the workload on it will be automatically transferred to other nodes by the Master Go to
Kubelet: Responsible for maintaining the life cycle of the container, that is, by controlling the docker, controlling the creation, startup, monitoring, restart, and destruction of the Pod, and handling the tasks sent by the Master node to the node; KubeProxy : Responsible for formulating the packet forwarding strategy
, and In the daemon mode, the pod information of each node is monitored in real time and the forwarding rules are updated. After receiving the request, the service will forward the request according to the policy formulated by kube-proxy, so as to achieve load balancing. In general, it is responsible for Service provides service discovery and load balancing within the cluster;
Docker : responsible for various operations of containers on nodes;
other components
Pod : the smallest control unit of kubernetes, containers are all running in pods, and there can be one or more in a pod A container
Controller : The controller, through which the management of pods is realized, such as starting pods, stopping pods, scaling the number of pods, etc.
Service : The unified entrance of pod external services. Multiple pod
labels of the same type can be maintained below : Labels are used to classify pods, and pods of the same type will have the same label
NameSpace : Namespaces are used to isolate the operating environment of pods
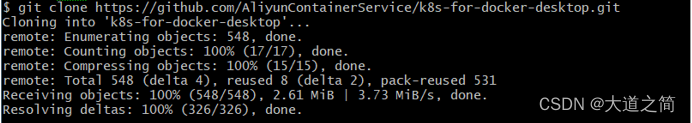
1、https://github.com/AliyunContainerService/k8s-for-docker-desktop
k8s-for-docker-desktop
Sometimes when we use Git to obtain resources, the error " OpenSSL SSL_read: Connection was reset, errno 10054" will be reported . This error occurs because the SSL certificate of the server has not been signed by a third-party organization, as shown in the following figure:

![]() git config --global http.sslVerify "false"
git config --global http.sslVerify "false"
 Run and open Windows PowerShell as an administrator, cd your above installation path
and execute:
.\load_images.ps1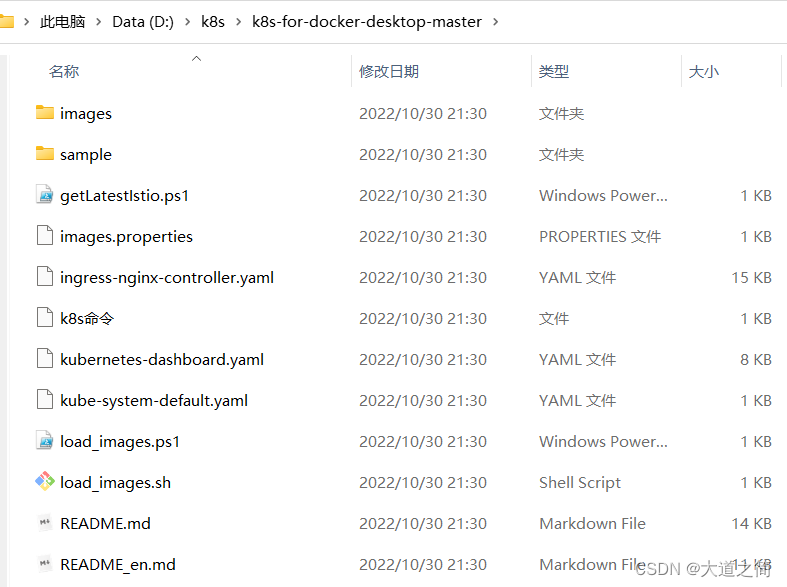
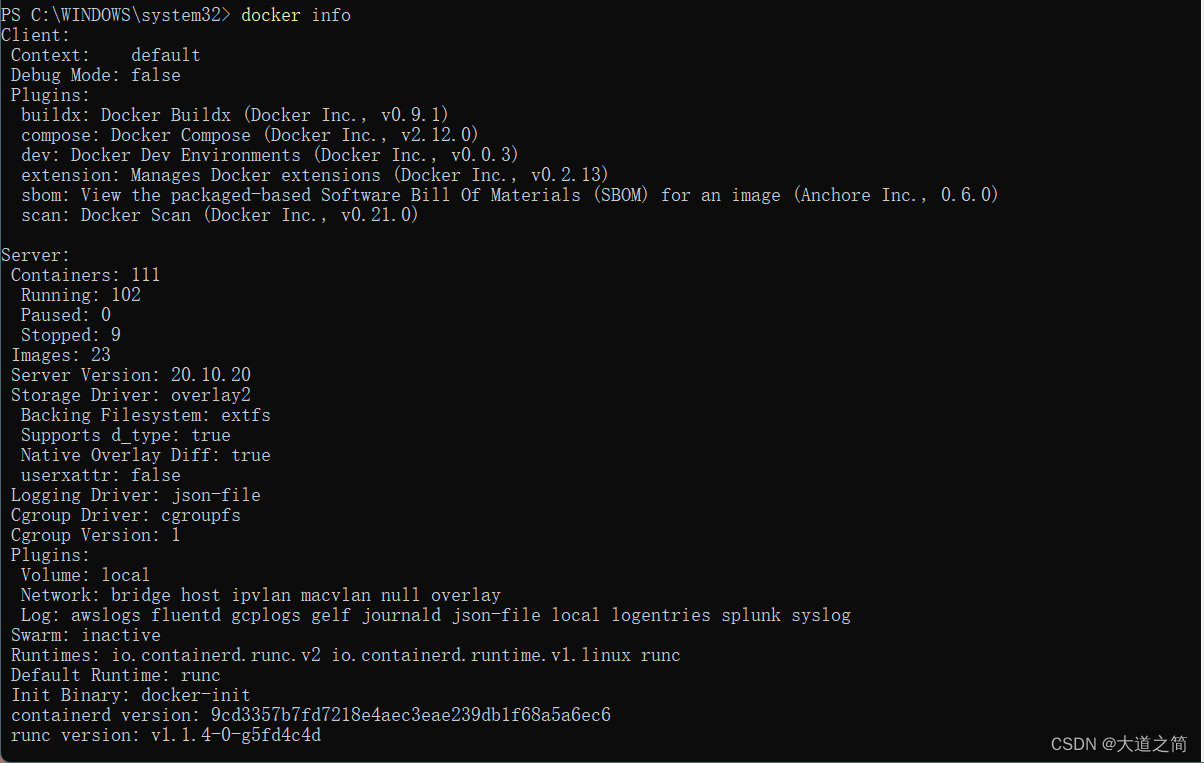
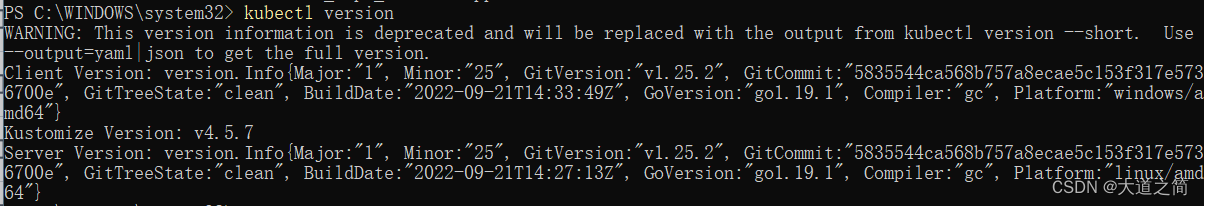
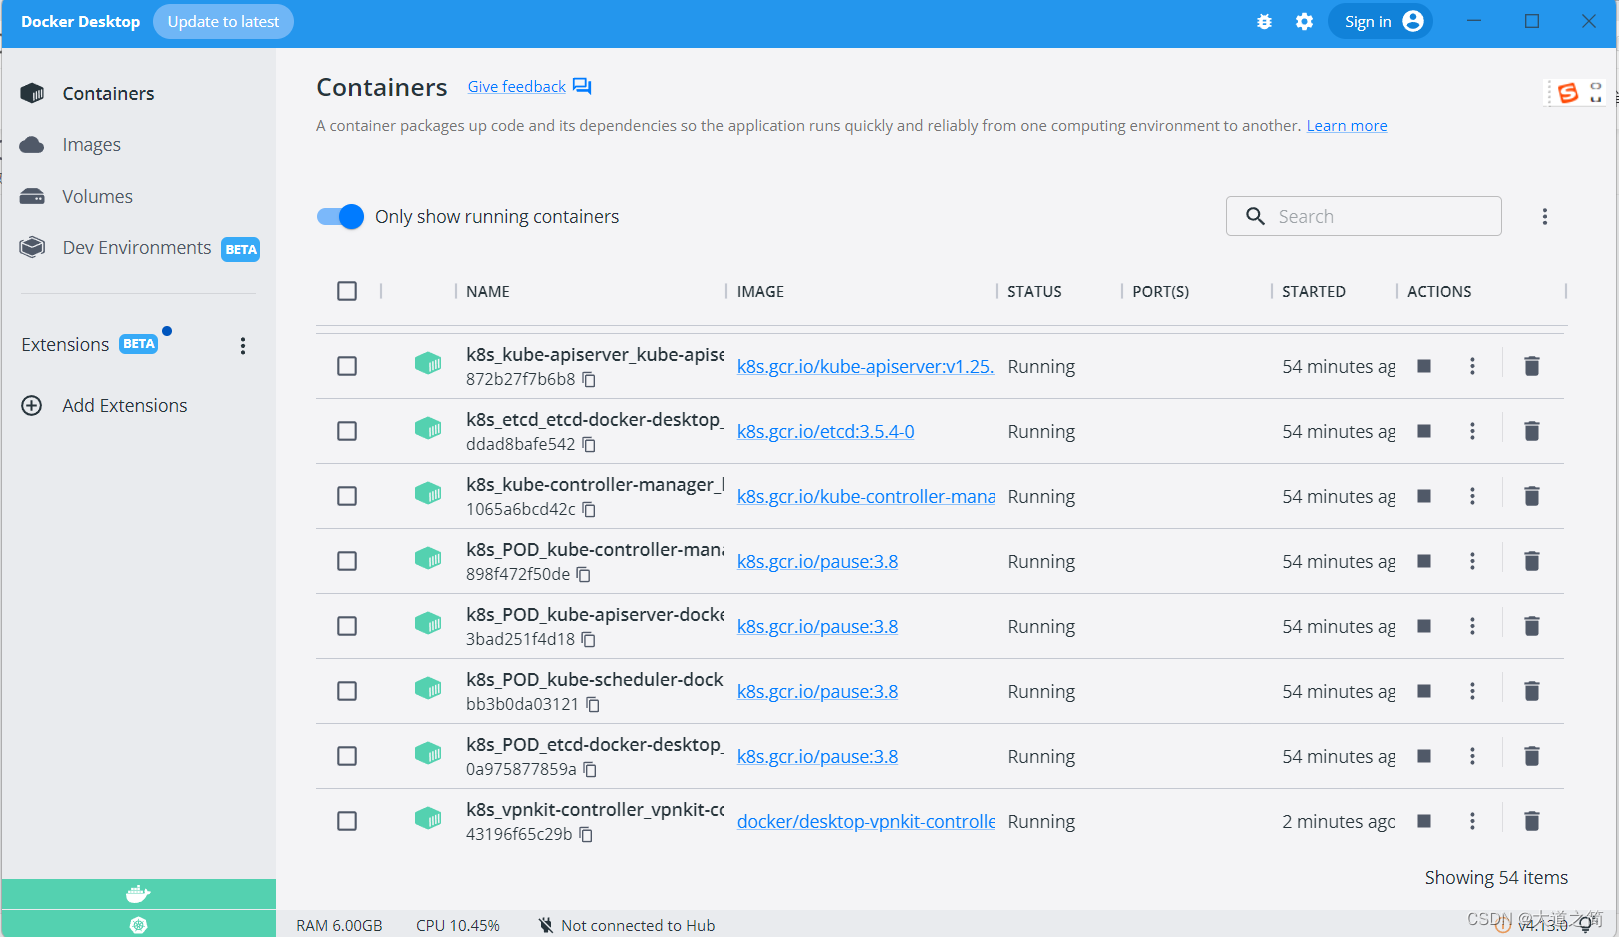
Check k8s.

kubectl view version information: kubectl version
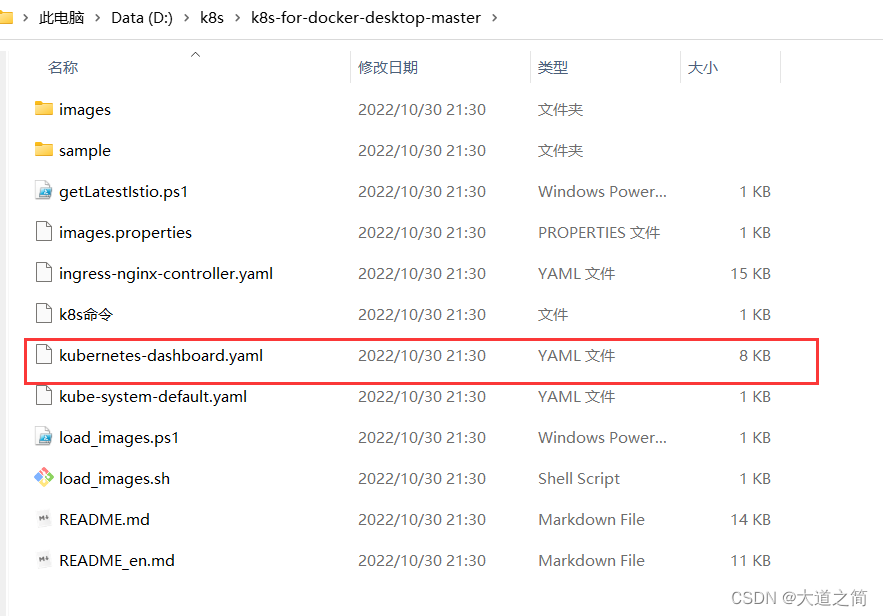
2. Install the dashboard panel. Dashboard is actually a web-based management tool that can view and manage K8S clusters
Switch to this directory and execute
kubectl.exe apply -f .\kubernetes-dashboard.yaml
The yaml configuration file is as follows
# Copyright 2017 The Kubernetes Authors.
#
# Licensed under the Apache License, Version 2.0 (the "License");
# you may not use this file except in compliance with the License.
# You may obtain a copy of the License at
#
#     http://www.apache.org/licenses/LICENSE-2.0
#
# Unless required by applicable law or agreed to in writing, software
# distributed under the License is distributed on an "AS IS" BASIS,
# WITHOUT WARRANTIES OR CONDITIONS OF ANY KIND, either express or implied.
# See the License for the specific language governing permissions and
# limitations under the License.

apiVersion: v1
kind: Namespace
metadata:
  name: kubernetes-dashboard

---

apiVersion: v1
kind: ServiceAccount
metadata:
  labels:
    k8s-app: kubernetes-dashboard
  name: kubernetes-dashboard
  namespace: kubernetes-dashboard

---

kind: Service
apiVersion: v1
metadata:
  labels:
    k8s-app: kubernetes-dashboard
  name: kubernetes-dashboard
  namespace: kubernetes-dashboard
spec:
  ports:
    - port: 443
      targetPort: 8443
  selector:
    k8s-app: kubernetes-dashboard

---

apiVersion: v1
kind: Secret
metadata:
  labels:
    k8s-app: kubernetes-dashboard
  name: kubernetes-dashboard-certs
  namespace: kubernetes-dashboard
type: Opaque

---

apiVersion: v1
kind: Secret
metadata:
  labels:
    k8s-app: kubernetes-dashboard
  name: kubernetes-dashboard-csrf
  namespace: kubernetes-dashboard
type: Opaque
data:
  csrf: ""

---

apiVersion: v1
kind: Secret
metadata:
  labels:
    k8s-app: kubernetes-dashboard
  name: kubernetes-dashboard-key-holder
  namespace: kubernetes-dashboard
type: Opaque

---

kind: ConfigMap
apiVersion: v1
metadata:
  labels:
    k8s-app: kubernetes-dashboard
  name: kubernetes-dashboard-settings
  namespace: kubernetes-dashboard

---

kind: Role
apiVersion: rbac.authorization.k8s.io/v1
metadata:
  labels:
    k8s-app: kubernetes-dashboard
  name: kubernetes-dashboard
  namespace: kubernetes-dashboard
rules:
  # Allow Dashboard to get, update and delete Dashboard exclusive secrets.
  - apiGroups: [""]
    resources: ["secrets"]
    resourceNames: ["kubernetes-dashboard-key-holder", "kubernetes-dashboard-certs", "kubernetes-dashboard-csrf"]
    verbs: ["get", "update", "delete"]
    # Allow Dashboard to get and update 'kubernetes-dashboard-settings' config map.
  - apiGroups: [""]
    resources: ["configmaps"]
    resourceNames: ["kubernetes-dashboard-settings"]
    verbs: ["get", "update"]
    # Allow Dashboard to get metrics.
  - apiGroups: [""]
    resources: ["services"]
    resourceNames: ["heapster", "dashboard-metrics-scraper"]
    verbs: ["proxy"]
  - apiGroups: [""]
    resources: ["services/proxy"]
    resourceNames: ["heapster", "http:heapster:", "https:heapster:", "dashboard-metrics-scraper", "http:dashboard-metrics-scraper"]
    verbs: ["get"]

---

kind: ClusterRole
apiVersion: rbac.authorization.k8s.io/v1
metadata:
  labels:
    k8s-app: kubernetes-dashboard
  name: kubernetes-dashboard
rules:
  # Allow Metrics Scraper to get metrics from the Metrics server
  - apiGroups: ["metrics.k8s.io"]
    resources: ["pods", "nodes"]
    verbs: ["get", "list", "watch"]

---

apiVersion: rbac.authorization.k8s.io/v1
kind: RoleBinding
metadata:
  labels:
    k8s-app: kubernetes-dashboard
  name: kubernetes-dashboard
  namespace: kubernetes-dashboard
roleRef:
  apiGroup: rbac.authorization.k8s.io
  kind: Role
  name: kubernetes-dashboard
subjects:
  - kind: ServiceAccount
    name: kubernetes-dashboard
    namespace: kubernetes-dashboard

---

apiVersion: rbac.authorization.k8s.io/v1
kind: ClusterRoleBinding
metadata:
  name: kubernetes-dashboard
roleRef:
  apiGroup: rbac.authorization.k8s.io
  kind: ClusterRole
  name: kubernetes-dashboard
subjects:
  - kind: ServiceAccount
    name: kubernetes-dashboard
    namespace: kubernetes-dashboard

---

kind: Deployment
apiVersion: apps/v1
metadata:
  labels:
    k8s-app: kubernetes-dashboard
  name: kubernetes-dashboard
  namespace: kubernetes-dashboard
spec:
  replicas: 1
  revisionHistoryLimit: 10
  selector:
    matchLabels:
      k8s-app: kubernetes-dashboard
  template:
    metadata:
      labels:
        k8s-app: kubernetes-dashboard
    spec:
      securityContext:
        seccompProfile:
          type: RuntimeDefault
      containers:
        - name: kubernetes-dashboard
          image: kubernetesui/dashboard:v2.5.1
          imagePullPolicy: IfNotPresent
          ports:
            - containerPort: 8443
              protocol: TCP
          args:
            - --auto-generate-certificates
            - --namespace=kubernetes-dashboard
            # Uncomment the following line to manually specify Kubernetes API server Host
            # If not specified, Dashboard will attempt to auto discover the API server and connect
            # to it. Uncomment only if the default does not work.
            # - --apiserver-host=http://my-address:port
          volumeMounts:
            - name: kubernetes-dashboard-certs
              mountPath: /certs
              # Create on-disk volume to store exec logs
            - mountPath: /tmp
              name: tmp-volume
          livenessProbe:
            httpGet:
              scheme: HTTPS
              path: /
              port: 8443
            initialDelaySeconds: 30
            timeoutSeconds: 30
          securityContext:
            allowPrivilegeEscalation: false
            readOnlyRootFilesystem: true
            runAsUser: 1001
            runAsGroup: 2001
      volumes:
        - name: kubernetes-dashboard-certs
          secret:
            secretName: kubernetes-dashboard-certs
        - name: tmp-volume
          emptyDir: {}
      serviceAccountName: kubernetes-dashboard
      nodeSelector:
        "kubernetes.io/os": linux
      # Comment the following tolerations if Dashboard must not be deployed on master
      tolerations:
        - key: node-role.kubernetes.io/master
          effect: NoSchedule

---

kind: Service
apiVersion: v1
metadata:
  labels:
    k8s-app: dashboard-metrics-scraper
  name: dashboard-metrics-scraper
  namespace: kubernetes-dashboard
spec:
  ports:
    - port: 8000
      targetPort: 8000
  selector:
    k8s-app: dashboard-metrics-scraper

---

kind: Deployment
apiVersion: apps/v1
metadata:
  labels:
    k8s-app: dashboard-metrics-scraper
  name: dashboard-metrics-scraper
  namespace: kubernetes-dashboard
spec:
  replicas: 1
  revisionHistoryLimit: 10
  selector:
    matchLabels:
      k8s-app: dashboard-metrics-scraper
  template:
    metadata:
      labels:
        k8s-app: dashboard-metrics-scraper
    spec:
      securityContext:
        seccompProfile:
          type: RuntimeDefault
      containers:
        - name: dashboard-metrics-scraper
          image: kubernetesui/metrics-scraper:v1.0.7
          ports:
            - containerPort: 8000
              protocol: TCP
          livenessProbe:
            httpGet:
              scheme: HTTP
              path: /
              port: 8000
            initialDelaySeconds: 30
            timeoutSeconds: 30
          volumeMounts:
          - mountPath: /tmp
            name: tmp-volume
          securityContext:
            allowPrivilegeEscalation: false
            readOnlyRootFilesystem: true
            runAsUser: 1001
            runAsGroup: 2001
      serviceAccountName: kubernetes-dashboard
      nodeSelector:
        "kubernetes.io/os": linux
      # Comment the following tolerations if Dashboard must not be deployed on master
      tolerations:
        - key: node-role.kubernetes.io/master
          effect: NoSchedule
      volumes:
        - name: tmp-volume
          emptyDir: {}
Then, add a default account and authorize login based on Token login
kubectl apply -f kube-system-default.yaml

$TOKEN=((kubectl -n kube-system describe secret default | Select-String "token:") -split " +")[1]
kubectl config set-credentials docker-desktop --token="${TOKEN}"
echo $TOKEN
Login with Token
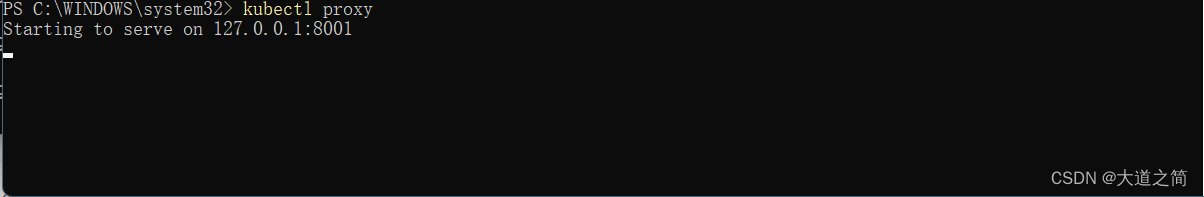
start service
kubectl proxy

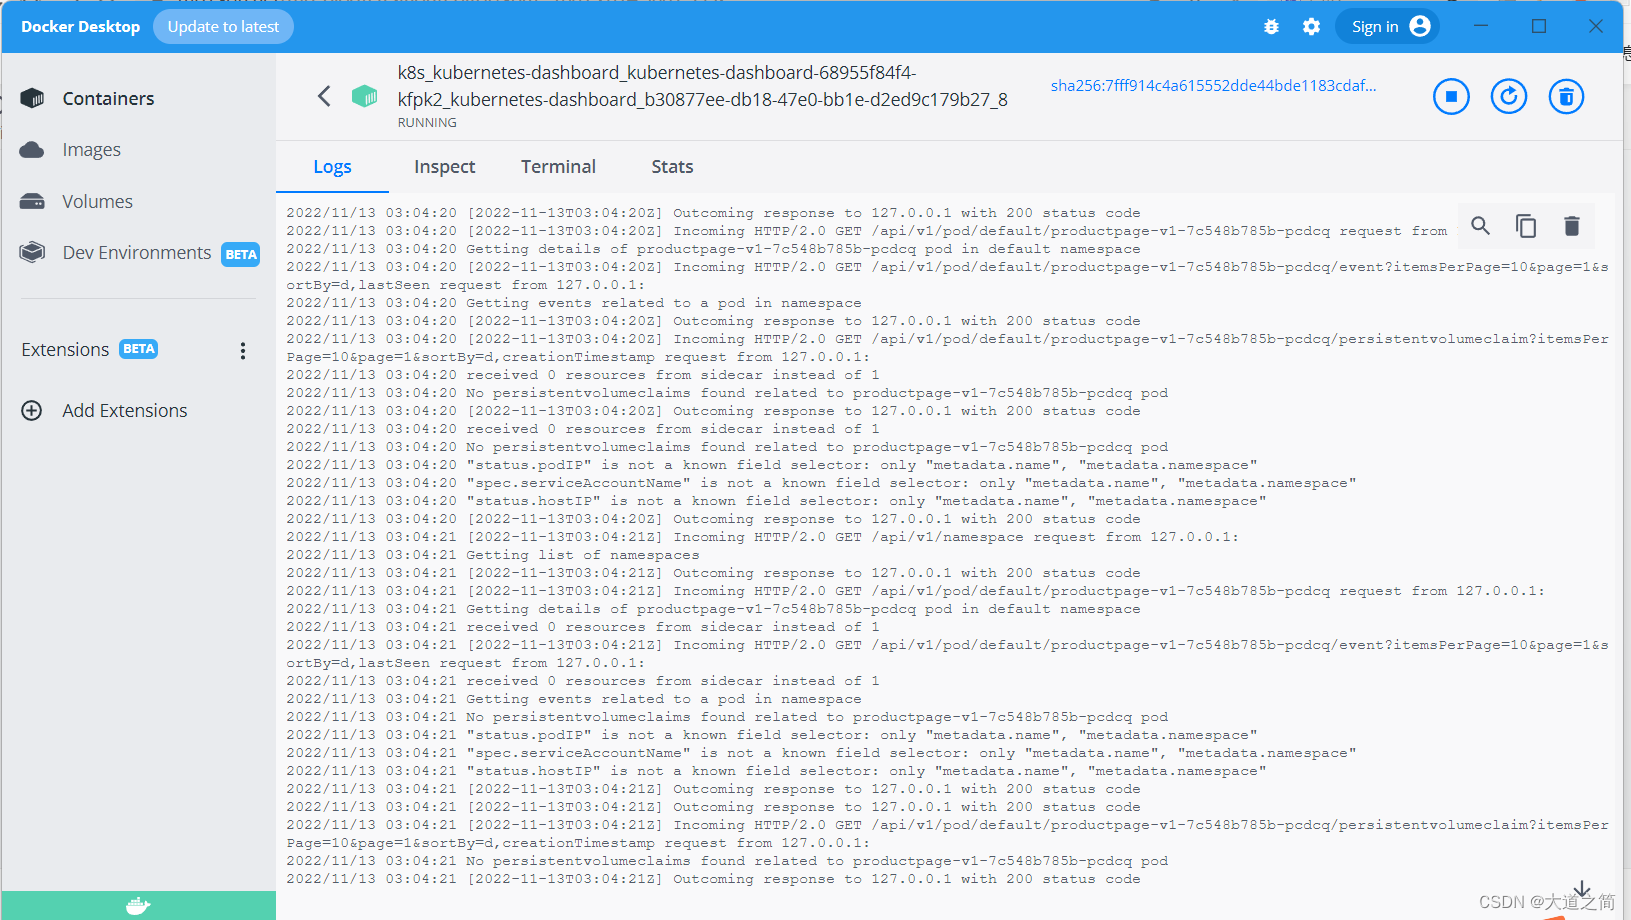
view log


3. k8s command
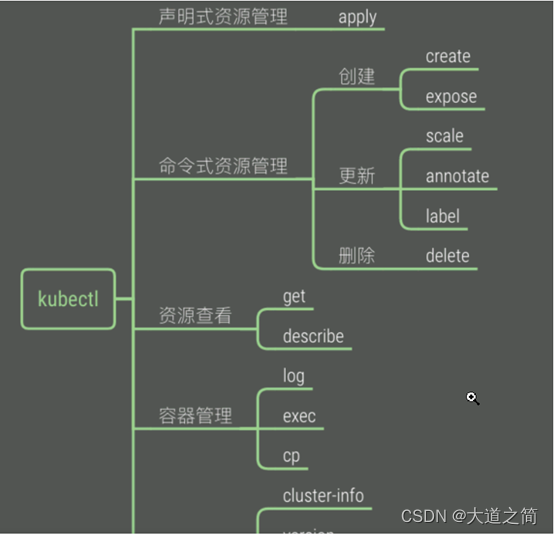
1. kubectl command line management tool

# 查看集群状态信息
kubectl cluster-info
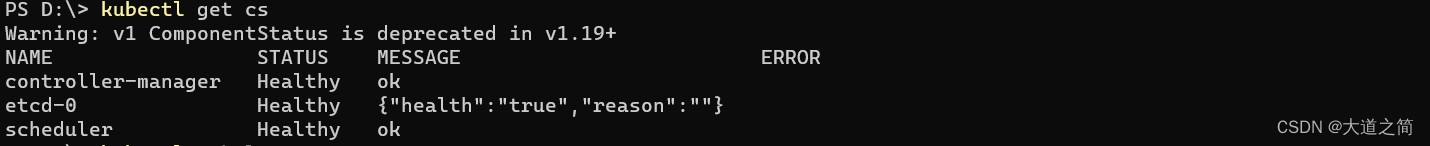
# 查看集群状态
kubectl get cs
# 查看集群节点信息
kubectl get nodes
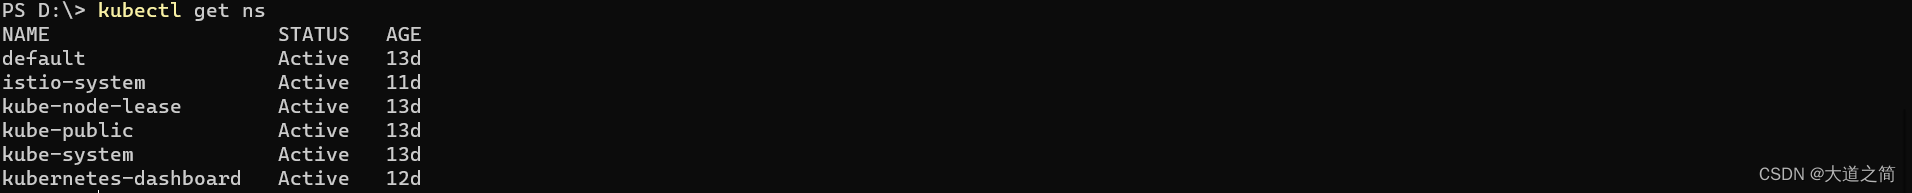
# 查看集群命名空间
kubectl get ns

kubectl --help
PS D:\> kubectl --help
kubectl controls the Kubernetes cluster manager.

 Find more information at: https://kubernetes.io/docs/reference/kubectl/

Basic Commands (Beginner):
  create          Create a resource from a file or from stdin
  expose          Take a replication controller, service, deployment or pod and expose it as a new Kubernetes service
  run             Run a particular image on the cluster
  set             Set specific features on objects

Basic Commands (Intermediate):
  explain         Get documentation for a resource
  get             Display one or many resources
  edit            Edit a resource on the server
  delete          Delete resources by file names, stdin, resources and names, or by resources and label selector

Deploy Commands:
  rollout         Manage the rollout of a resource
  scale           Set a new size for a deployment, replica set, or replication controller
  autoscale       Auto-scale a deployment, replica set, stateful set, or replication controller

Cluster Management Commands:
  certificate     Modify certificate resources.
  cluster-info    Display cluster information
  top             Display resource (CPU/memory) usage
  cordon          Mark node as unschedulable
  uncordon        Mark node as schedulable
  drain           Drain node in preparation for maintenance
  taint           Update the taints on one or more nodes

Troubleshooting and Debugging Commands:
  describe        Show details of a specific resource or group of resources
  logs            Print the logs for a container in a pod
  attach          Attach to a running container
  exec            Execute a command in a container
  port-forward    Forward one or more local ports to a pod
  proxy           Run a proxy to the Kubernetes API server
  cp              Copy files and directories to and from containers
  auth            Inspect authorization
  debug           Create debugging sessions for troubleshooting workloads and nodes

Advanced Commands:
  diff            Diff the live version against a would-be applied version
  apply           Apply a configuration to a resource by file name or stdin
  patch           Update fields of a resource
  replace         Replace a resource by file name or stdin
  wait            Experimental: Wait for a specific condition on one or many resources
  kustomize       Build a kustomization target from a directory or URL.

Settings Commands:
  label           Update the labels on a resource
  annotate        Update the annotations on a resource
  completion      Output shell completion code for the specified shell (bash, zsh, fish, or powershell)

Other Commands:
  alpha           Commands for features in alpha
  api-resources   Print the supported API resources on the server
  api-versions    Print the supported API versions on the server, in the form of "group/version"
  config          Modify kubeconfig files
  plugin          Provides utilities for interacting with plugins
  version         Print the client and server version information

Usage:
  kubectl [flags] [options]

Use "kubectl <command> --help" for more information about a given command.
Use "kubectl options" for a list of global command-line options (applies to all commands).
kubectl logs - Prints the logs of containers in a Pod
kubectl logs -f nginx-76d6c9b8c-gcv2z
# 从 pod 返回日志快照。
kubectl logs <pod-name>

# 从 pod <pod-name> 开始流式传输日志。这类似于 'tail -f' Linux 命令。
kubectl logs -f <pod-name>
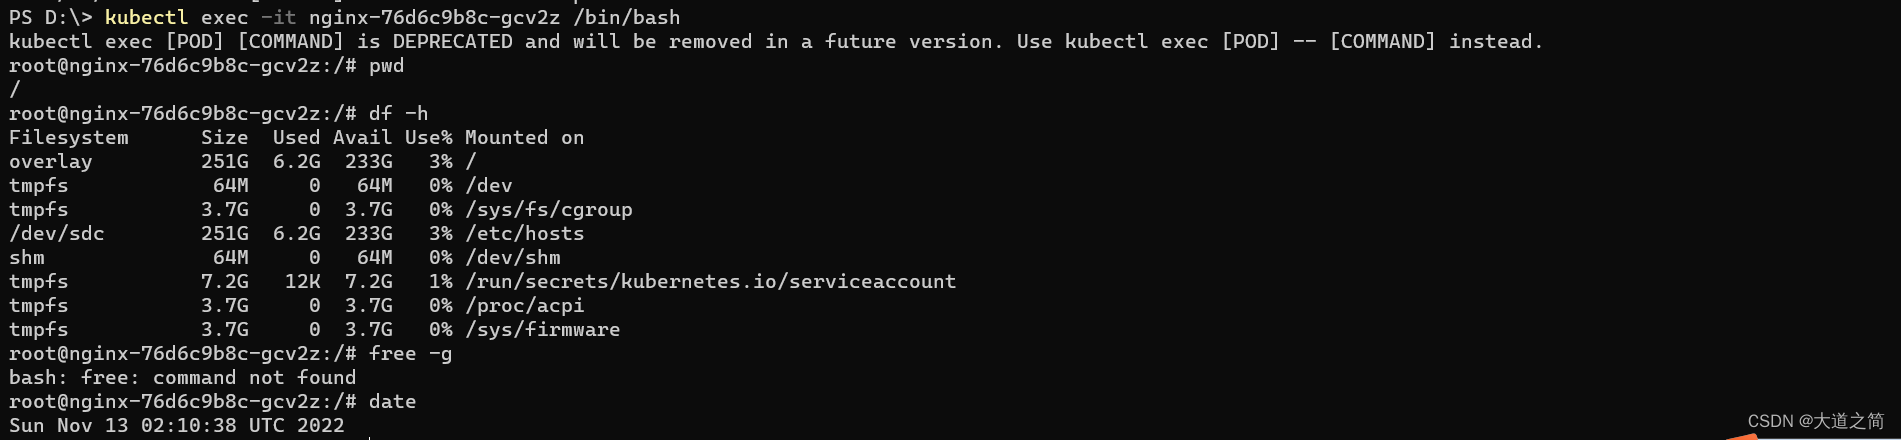
into the container
kubectl exec -it nginx-76d6c9b8c-gcv2z /bin/bash
create namespace
kubectl create ns boot-dev
kubectl get ns

delete deployment

pod status
kubectl get pod -n kubernetes-dashboard


4. Deploy the application
1. Test and deploy SpringBoot application
Environment preparation: Kubenertes cluster is available, private warehouses are created on the docker environment and docker hub, and then pushed to the private warehouse after packaging.
SpringBoot package deployment to K8s example
5. Three IPs in the k8s-cluster
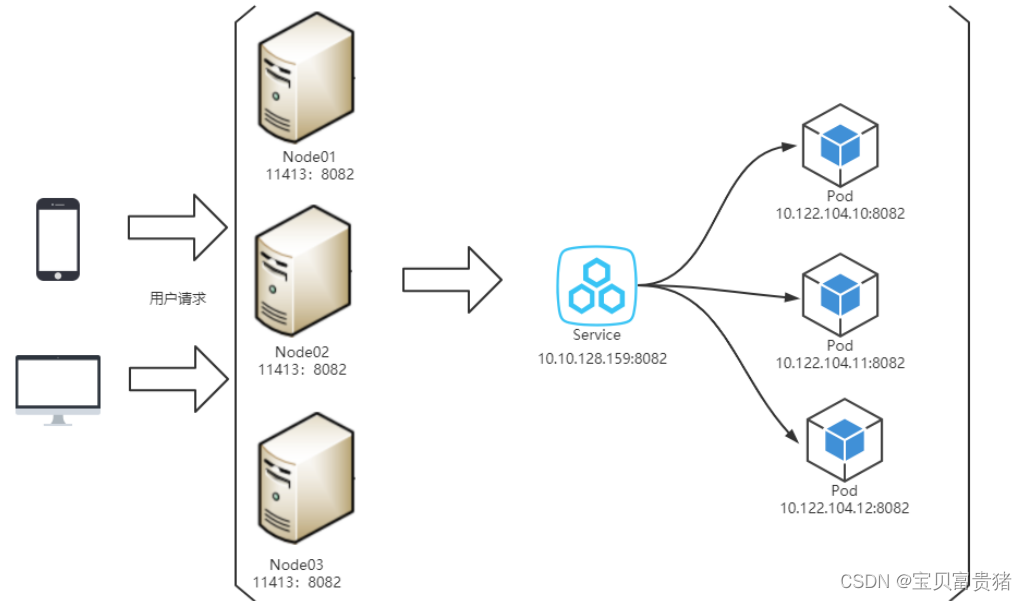
1. Node IP: The IP address of the Node node, that is, the IP address of the physical network card .
It can be the IP of the physical machine (or the IP of the virtual machine). Each Service will open a port on the Node node, and the outside can access the Pod in the Service through NodeIP:NodePort, which is the same as our access to the project deployed by the server, IP:Port/Project Name
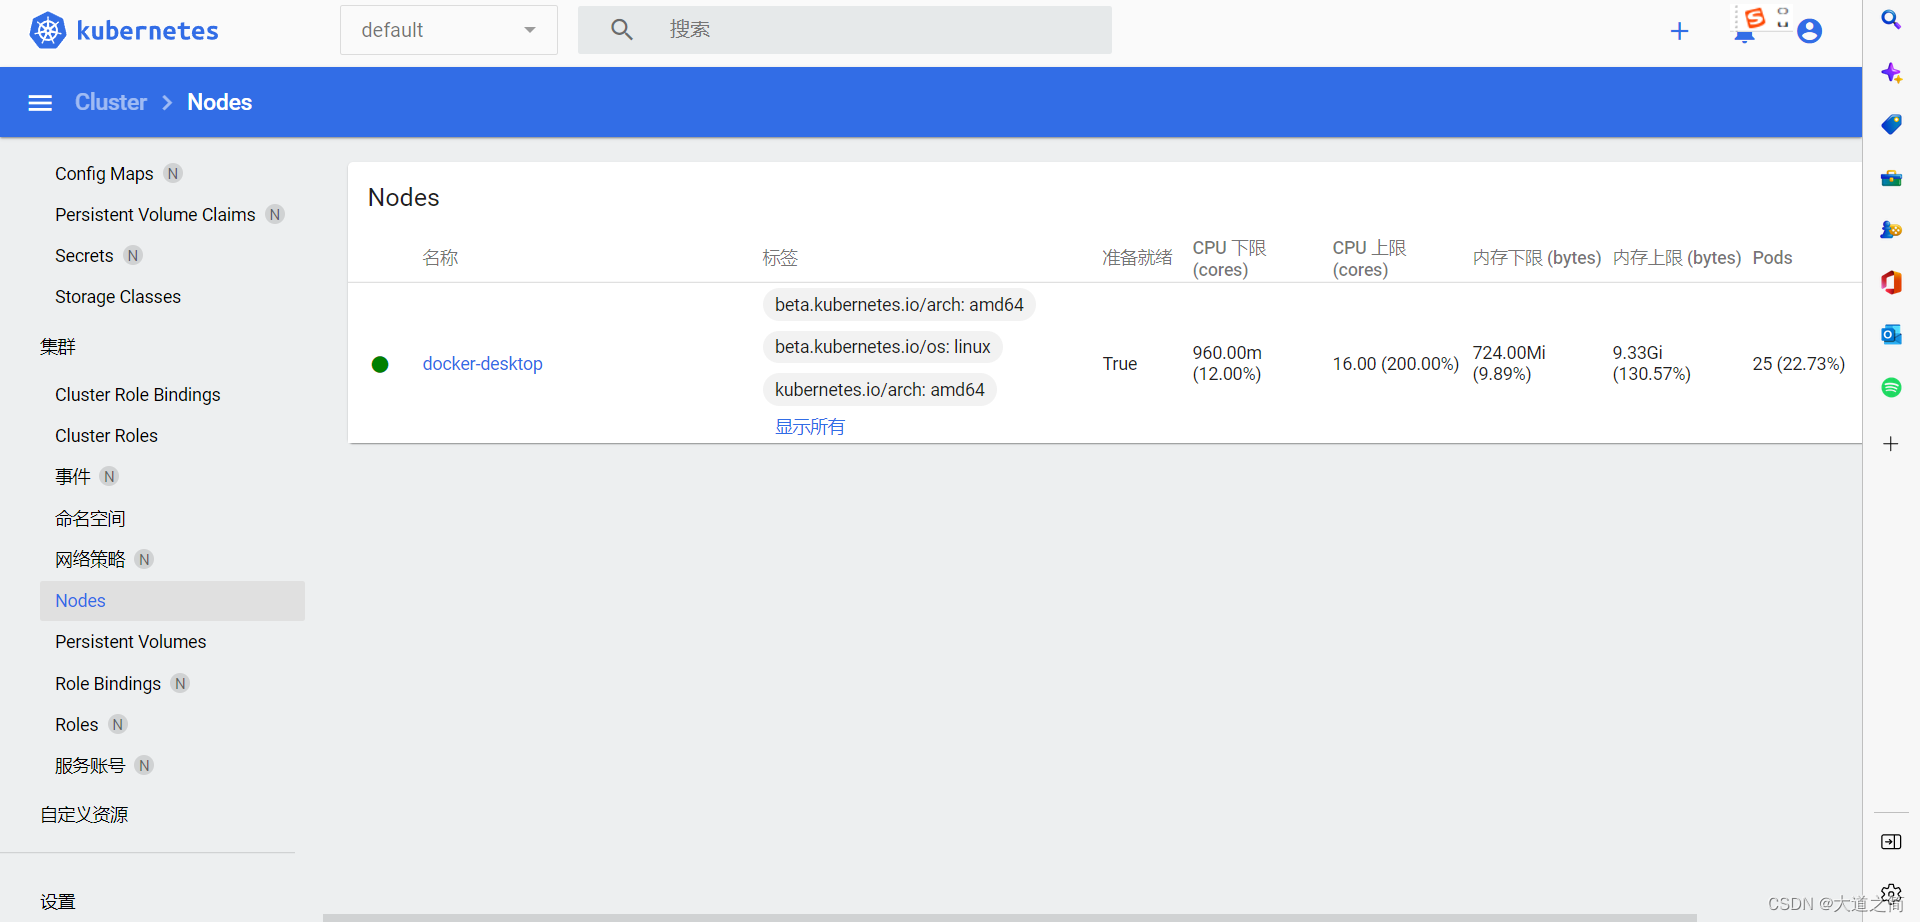
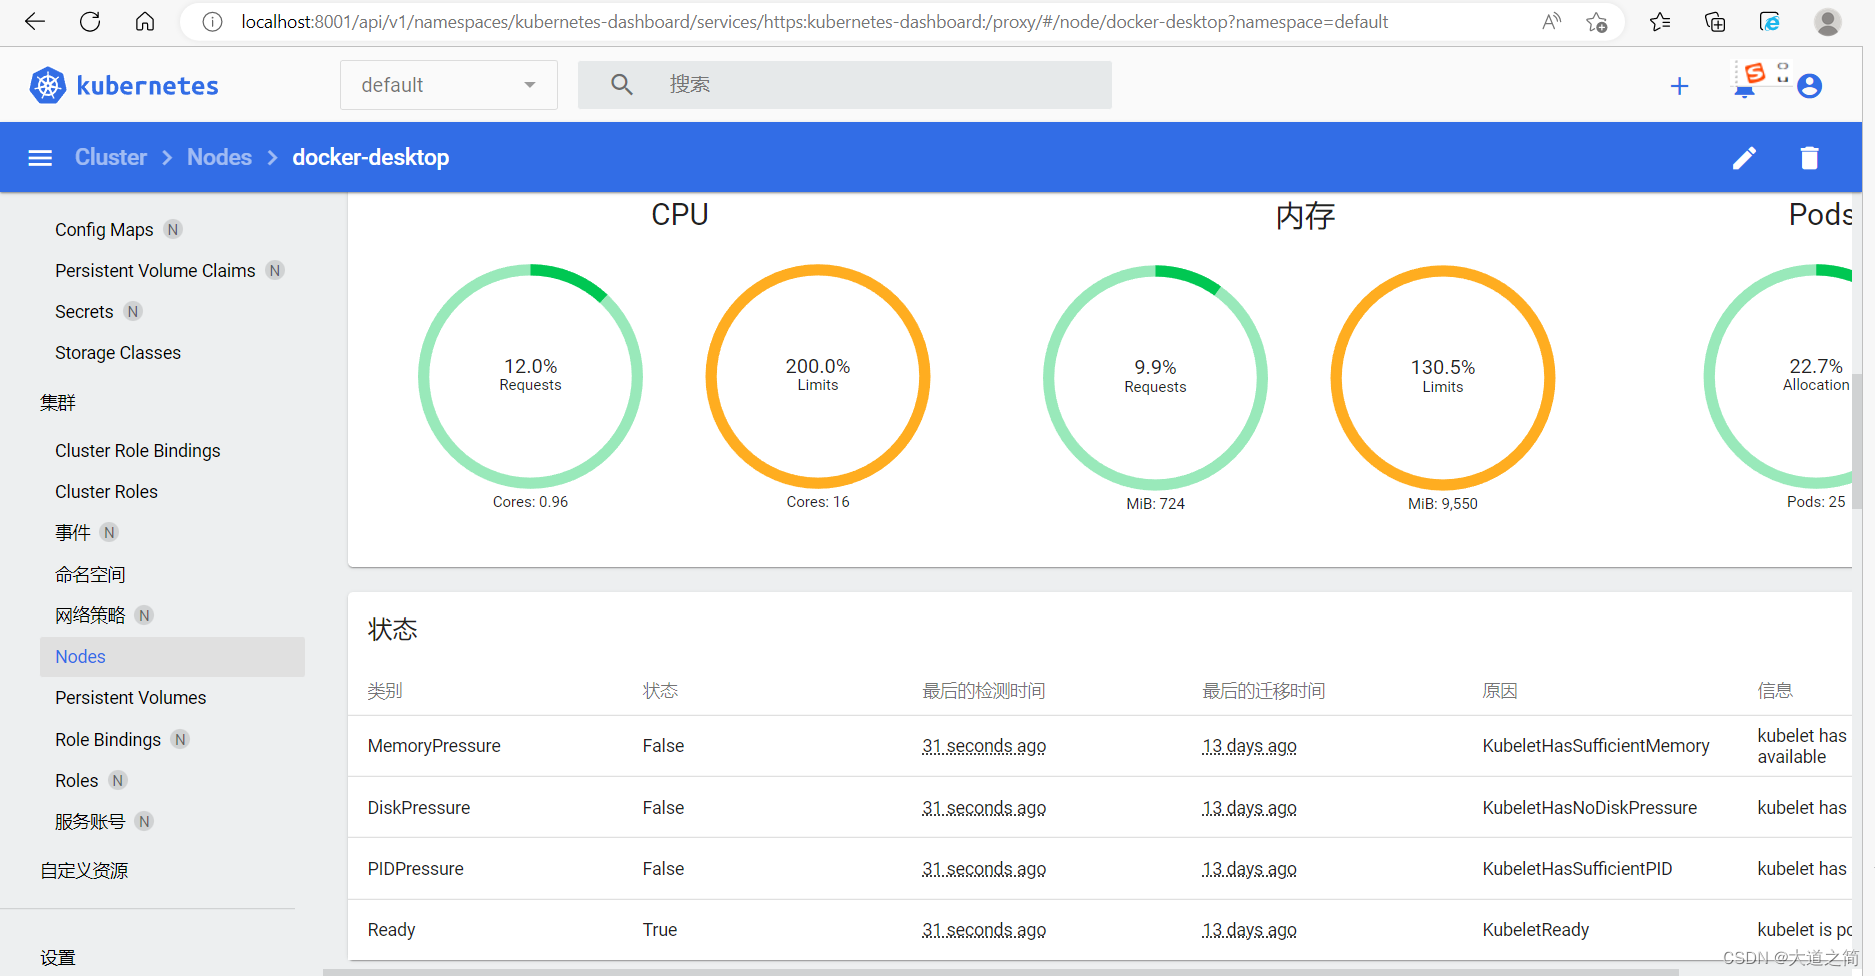
Query Node IP in kubernetes
①, kubectl get nodes
②, kubectl describe node nodeName
③, the displayed InternalIP is NodeIP
kubectl describe node dokcer-desktop


2. Pod IP is the IP address of each Pod, which is allocated by Docker Engine according to the IP address segment of the docker bridge, usually a virtual layer-2 network .
Pods under the same Service can directly communicate with each other according to PodIP.
Pods under different Services communicate with each other between pods through the cluster ip
pod and outside the cluster, and through node ip to
query Pod IP in kubernetes
①, kubectl get pods
②, kubectl describe pod podName
kubectl describe pod details-v1-76778d6644-44h6v

kubectl describe pod productpage-v1-7c548b785b-pcdcq

3. The IP address of the Service, which is the virtual IP address. The external network cannot be pinged, only the internal access of the kubernetes cluster is used
Query Cluster IP
kubectl -n namespace get Service in kubernetes to see ClusterIP


IP is the service ip, and Endpoints is the Pod ip associated with the Service, compared to the above figure.
Cluster IP is a virtual IP, but it is more like a fake IP network for the following reasons
Cluster IP only acts on the object of Kubernetes Service, and is managed and allocated by Kubernetes.
Cluster IP cannot be pinged. It does not have a "physical network object" to respond.
Cluster IP can only be combined with Service Port to form a specific communication port. Cluster IP does not have the basis for communication, and they belong to a closed space such as the Kubernetes cluster.
Pod nodes under different services can access each other through Cluster IP
The service address and the pod address are in different network segments. The service address is a virtual address and does not match on the pod or the host. When accessing externally, first go to the Node node network, then transfer to the service network, and finally proxy to the pod network
Kubernetes opens a port on all its nodes for external access (the same port number is used on all nodes), and forwards incoming connections to pods that serve as Service objects. This way our pod can be accessed by external requests.
See this Node Ip: Node port way of exposing services