Regression practice of python k neighbor algorithm
basic concept
Let me briefly introduce two concepts in machine learning
1. Classification and regression
The essence of the classification model is the same as the regression model. The classification model discretizes the output of the regression model.
Generally speaking, regression problems are usually used to predict a value, such as predicting housing prices, future weather conditions, etc., for example, the actual price of a product is 500 yuan, and the predicted value through regression analysis is 499 yuan. We think this is a comparison Good regression analysis. Regression is an approximate prediction of the true value.
Classification problems are used to put a label on things, usually the result is a discrete value. For example, to determine whether the animal in a picture is a cat or a dog. Classification does not have the concept of approximation. There is only one correct result in the end, and the wrong one is wrong, and there will be no similar concepts.
In short:
Quantitative output is called regression, or continuous variable prediction, which predicts the temperature of tomorrow. This is a regression task.
Qualitative output is called classification, or discrete variable prediction. Predicting whether tomorrow will be cloudy, sunny or rainy is one Classification task
2. Fitting
generalization : If a model can make accurate predictions on new data that has not been seen before, we can say that it can generalize from the training setto the test set
fitting : whether the model can describe some samples well, And has good generalization ability.
Under-fitting : the characteristics of the test sample are not learned, or the model is too simple to fit.
Over-fitting : the characteristics that are too close to the training data are excellent on the training set, but in the test set Nothing on it, no generalization
Introduction to Algorithm
KNN regression
The KNN algorithm can be used not only for classification, but also for regression. By finding the k nearest neighbors of a sample, and assigning the average value of a certain attribute(s) of these neighbors to the sample, the value of the corresponding attribute of the sample can be obtained.
Knn classification practice can refer to this article: k neighbor algorithm-classification practice
Data Sources
Avocado unit price prediction (Kaggle): #https://www.kaggle.com/neuromusic/avocado-prices
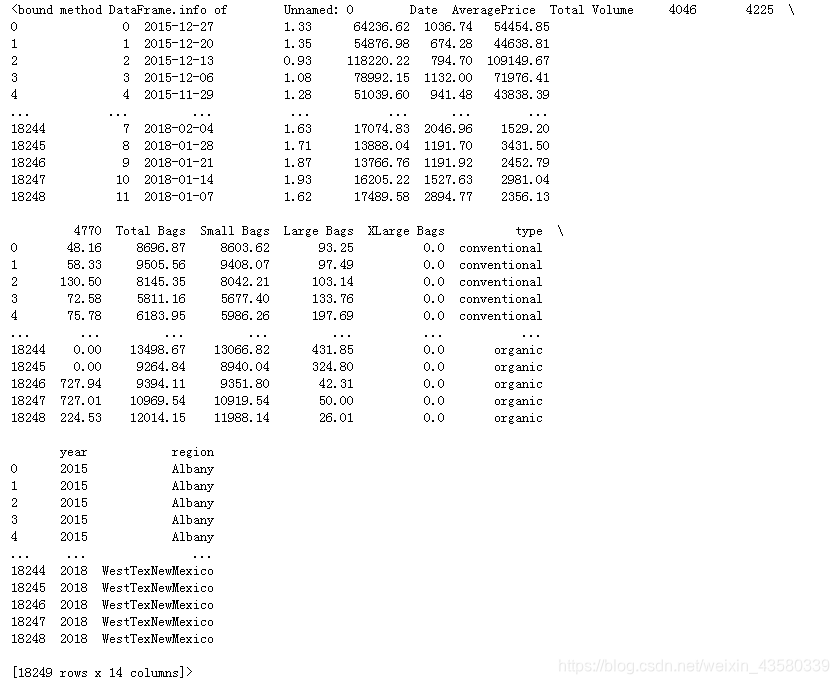
The data contains information about the unit price of avocados from 2017 to 2019, the weight of each sale, the type of avocado, and the place of origin.
Tips: 4046, 4225, and 4770 are the plu codes of imported fruits. The four-digit plu codes represent the origin, type, size and other fruit information of the avocado, so 4046, 4225, 4770 represent three kinds of avocados.
There is a saying, I don’t notice this when I usually buy fruit. Know a little useless knowledge.
Data mining
1. Import third-party libraries
import pandas as pd
import numpy as np
from sklearn.model_selection import train_test_split#导入划分数据集的模块
from sklearn.neighbors import KNeighborsRegressor#导入knn回归算法
from sklearn.metrics import r2_score
The old rule is to first import the modules required for modeling in turn. In addition to the first four libraries, which are necessary third-party libraries for data mining, let’s focus on r2_score:
sklearn.metrics.r2_score(y_true, y_pred, sample_weight=None, multioutput='uniform_average')
y_true: observed value
y_pred: predicted value
sample_weight: sample weight, default None
multioutput: multi-dimensional input and output, optional'raw_values','uniform_average' ,'variance_weighted' or None. The default
is'uniform_average '; raw_values: returns the scores of each dimension respectively
uniform_average: the average of the output dimension scores
variance_weighted: averages the scores of all outputs, and weights them according to the variance of each output.
r2_score score is the main regression model scoring method, the specific principles will not be introduced, and interested friends can check this article: In- depth research: regression model evaluation index R2_score
2. Read the file
import winreg
real_address = winreg.OpenKey(winreg.HKEY_CURRENT_USER,r'Software\Microsoft\Windows\CurrentVersion\Explorer\Shell Folders',)
file_address=winreg.QueryValueEx(real_address, "Desktop")[0]
file_address+='\\'
file_origin=file_address+"\\源数据-分析\\avocado.csv"#设立源数据文件的桌面绝对路径
glass=pd.read_csv(file_origin)#https://www.kaggle.com/neuromusic/avocado-prices
Because every time you download data, you have to transfer the file to the python root directory or read it in the download folder, which is very troublesome. So I set up an absolute desktop path through the winreg library, so that I only need to download the data to the desktop or paste it into a specific folder on the desktop to read it, and it won't be confused with other data.
3. Clean the data
avocado.groupby(avocado["year"])["year"].count()
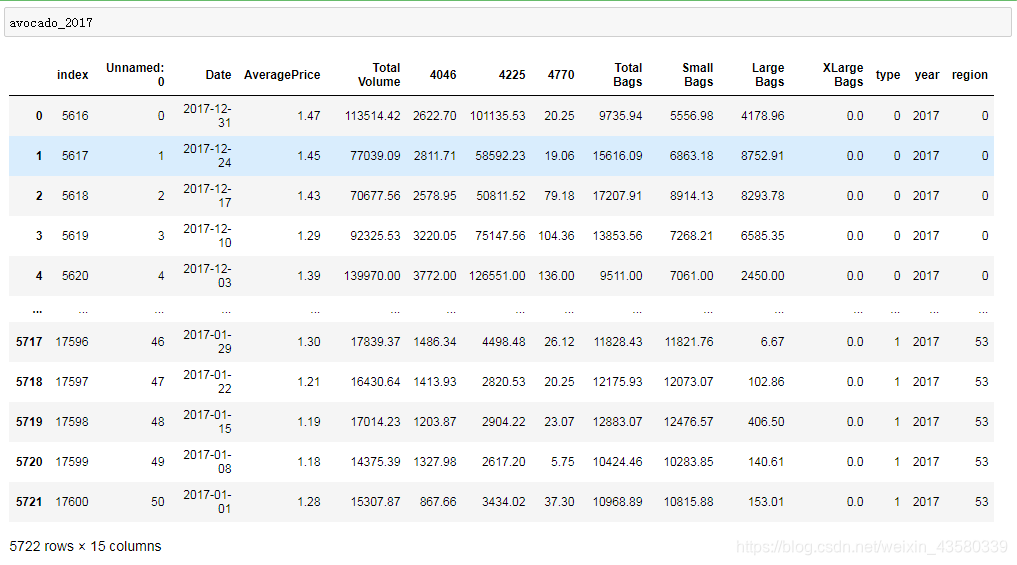
avocado_2017=avocado[avocado["year"]==2017].reset_index()
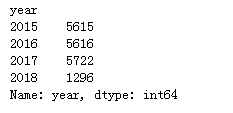
Here we choose 2017 data as the modeling data. (Sometimes too much data will cause some noise interference)
avocado_2017=avocado_2017.replace({

    "type":{

    "conventional":0}})
avocado_2017=avocado_2017.replace({

    "type":{

    "organic":1}})
a=pd.DataFrame(avocado_2017.groupby(avocado_2017["region"])["region"].count())
a["replace_num"]=range(len(a.index))
for i in range(len(a.index)):
    avocado_2017=avocado_2017.replace({

    "region":{

    a.index[i]:a.loc[a.index[i],"replace_num"]}})
    ###注意这里在利用.loc进行筛选时不能用数字索引进行筛选,因为当前a的行索引是一系列字符串
Because the text data of type and region is a bit complicated, the replace function is used to replace numbers to represent different varieties and origins.
In fact, this replacement is useless, it's just that the blogger simply can't get used to the text data.
Because the eigenvalues in the data Total Bags=Small Bags+Large Bags, XLarge Bags=0, and the region and type are all attributed to the 4-digit plu code, so in order to avoid over-fitting, I only select AveragePrice here. Total Volume, 4046, 4225, 4770, Small Bags, Large Bags for predictive modeling.
4. Modeling
X_train,X_test,y_train,y_test=train_test_split(avocado_2017[["Total Volume","4225","4046","4770","Small Bags","Large Bags"]],avocado_2017["AveragePrice"],random_state=24)
#注意特征值标签要放在前面,预测值标签要放在后面
#考虑到接下来可能需要进行其他的操作,所以定了一个随机种子,保证接下来的train和test是同一组数
The column index is divided into feature values and predicted values, and the data is divided into training set and test set.
knn=KNeighborsRegressor(n_neighbors=1)
knn.fit(X_train,y_train)
prediction=knn.predict(X_test)
r2_score(y_test,prediction)
The knn algorithm is introduced and the neighbor value in the algorithm is set to 1. After modeling, the accuracy of the test set is scored, and the results obtained are as follows: It
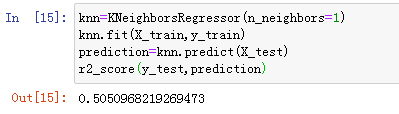
can be seen that the accuracy of the model is about 50%.
5. Simple tuning
The neighbor parameter set up before is 1, and then different parameters are tested in turn to see what the optimal neighbor parameter is.
result={

    }
for i in range(100):#一般n_neighbors的选取低于样本总数的平方根
    knn=KNeighborsRegressor(n_neighbors=(i+1))
    knn.fit(X_train,y_train)
    prediction=knn.predict(X_test)
    score=r2_score(y_test,prediction)
    result[i+1]=score*100
for i in result.keys():
    if result[i]==max(result.values()):
        print("最佳邻近数:"+str(i))
print("模型评分:"+str(max(result.values())))
The results are as follows: It
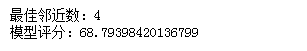
can be seen that in the process of selecting the neighbor number from 1 to 100 in turn, the best neighbor parameter is 4; the best accuracy score of the model is 68 points. (It can be seen that the score is very low, and the blogger thinks that it may be the algorithm itself. After all, it is a simple algorithm, unlike the forest or tree regression algorithm, which can adjust other parameters such as weights.)
6. Summary
1. With the change of neighboring parameters, the accuracy of the model will also change and show a certain regularity:
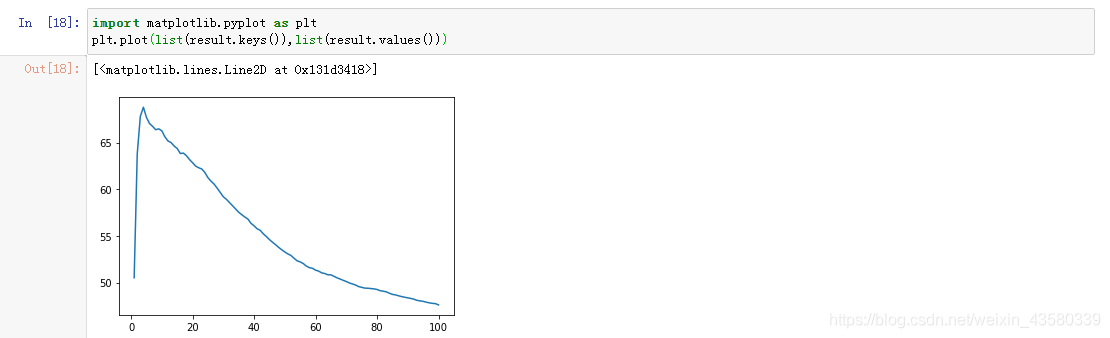
For the same data set, with the gradual increase of neighboring parameters, the accuracy of the model will often reach a critical point, and then it will gradually decrease. Other knn regression models will also present this situation, and friends who are interested can check it out by themselves.
2. The regression algorithm is an algorithm for predicting continuous values. If you intend to predict the change range of the predicted label by binning the predicted label (pd.cut), it will not work. ps: The blogger has tried it and will report an error.
3. Different types of algorithms should be selected for different types of data. Each algorithm has its own advantages and disadvantages, and there is no algorithm that can solve all problems. Therefore, in the future modeling, you must pay attention to the choice.
There are many places that are not doing very well. Netizens are welcome to make suggestions, and I hope to meet some friends to discuss together.