1. strace -p [process number]
strace -p 1002297

strace: Process 1002297 attached
futex(0x7fcbb95f3f84, FUTEX_WAIT_PRIVATE, 1, NULL
You can see that it died in futex(0x7fcbb95f3f84, FUTEX_WAIT_PRIVATE, 1, NULL
Use strace to find an example of the cause of process stuck
I recently encountered a situation where the process is stuck, but it may not be able to reproduce during the debugging process. It will only be triggered under certain conditions after running for a period of time. For this kind of situation where the operation cannot damage the scene, we can use gdb -p and strace -p to track.
First, we use ps auxf to see where our process has been executed :

You can see that the execution reaches docker exec -i 178.20.1.229_0115034556 ls and then it is stuck
Then we further use strace to see which system callback has executed this operation :
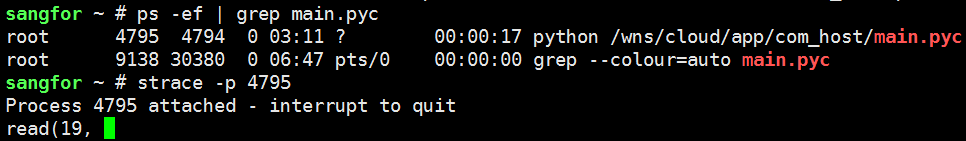
Here you can see that it is dead in the system callback read. The specific meaning of descriptor 19 can be checked by entering /proc/pid/fd :

We can find that 19 represents the pipe, and we are dead here on the read pipe.
/************************************************* ************************************************** *****************************/
Dividing line, this problem reappears later,
we first use ps auxf to check the process number and the process has been executed At which step , you can see that the process number is 27678, which is stuck in docker exec
root 27678 0.3 0.4 512172 16500 Sl python /wns/cloud/app/com_host/main.pyc
root 25011 0.0 0.0 4332 652 S \_ /bin/sh -c docker exec -i mongo_docker_master ls
root 25014 0.0 0.2 136592 10600 Sl \_ docker exec -i mongo_docker_master ls
continued to track with strace -p 27678 and found that it was stuck in read and the file descriptor was 14
root@localhost:/# strace -p 27678
Process 27678 attached
read(14,
then we cd /proc/27678/ , here we can view the process status
root@localhost: /proc/27678 # cat status
Name: python
State: S (sleeping)
Tgid: 27678
Ngid: 0
Pid: 27678
PPid: 27677
View the debugging information of the process’s kernel stack , wchan represents the function that caused the process to sleep or wait
root@localhost: /proc/27678 # cat stack
[<ffffffff811a91ab>] pipe_wait+0x6b/0x90
[<ffffffff811a9c04>] pipe_read+0x344/0x4f0
[<ffffffff811a00bf>] do_sync_read+0x7f/0xb0
[<ff0ff> 0x130
[<ffffffff811a1110>] SyS_read+0x80/0xe0
[<ffffffff818d4c49>] system_call_fastpath+0x16/0x1b
[<ffffffffffffffff>] 0xffffffffffffffff
root@localhost: /proc/27678 # cat wchan
pipe_wait
now 14 What does it stand for, pipe file
root@localhost:/proc/27678# ls -l ./fd
total 0
lr-x------ 1 root root 64 Mar 26 17:19 0 -> pipe:[30690124]
l-wx---- - 1 root root 64 Mar 26 17:19 1 -> pipe:[30690125]
lrwx------ 1 root root 64 Mar 26 17:19 10 -> socket:[30691732]
lr-x---- - 1 root root 64 Mar 26 17:19 11 -> /dev/urandom
lrwx------ 1 root root 64 Mar 26 17:19 12 -> socket:[30719611]
lrwx------ 1 root root 64 Mar 26 17:19 13 -> socket:[30719610]
lr-x------ 1 root root 64 Mar 26 17:19 14 -> pipe:[38483750]
We can already confirm that main creates child processes Execute the shell command docker exec -i mongo_docker_master ls, and communicate with the child process through the pipe at the same time, and the result is stuck on the read pipe.
In fact, we can also use lsof to locate here, we can see that the FD 14 opened by process 27678 is pipe, where u stands for readable and writable, and r stands for readable
sangfor ~ # lsof -d 14
COMMAND PID USER FD TYPE DEVICE SIZE/OFF NODE NAME
mongod 1907 root 14u REG 251,0 36864 130683 /wns/data/mongodb/db/collection-7--588642557116981989.wt
syslog-ng 3446 root 14u unix 0xffff88012227d800 0t0 40557736 /dev/log
dockerd 4025 root 14u unix 0xffff8800b8d5d800 0t0 13941 /run/docker/libnetwork/a73bd949b5fbb89c2b8bec3b4ac6af0a948a944958c8b037d9e6c9b324b44331.sock
docker-co 9382 root 14u 0000 0,9 0 9553 anon_inode
docker-co 21204 root 14u 0000 0,9 0 9553 anon_inode
python 27678 root 14r FIFO 0,8 0t0 38483750 pipe
You can also directly view the process 27678 opened, you can see that 14 is pipe
sangfor ~ # lsof -p 27678
COMMAND PID USER FD TYPE DEVICE SIZE/OFF NODE NAME
python 27678 root 0r FIFO 0,8 0t0 30690124 pipe
python 27678 root 1w FIFO 0,8 0t0 30690125 pipe
python 27678 root 2w FIFO 0,8 0t0 30690126 pipe
python 27678 root 3u 0000 0,9 0 9553 anon_inode
python 27678 root 4u 0000 0,9 0 9553 anon_inode
python 27678 root 5u pack 30691718 0t0 unknown type=SOCK_RAW
python 27678 root 6w REG 251,0 76106652 130565 /wns/data/com_host/etc/config/err.log
python 27678 root 7u IPv4 30691716 0t0 TCP Sangfor:53102->Sangfor:42457 (ESTABLISHED)
python 27678 root 8u IPv4 30691717 0t0 TCP Sangfor:42457->Sangfor:53102 (ESTABLISHED)
python 27678 root 9u IPv4 30691731 0t0 TCP db.sdwan:54072->sdwan.io:27017 (ESTABLISHED)
python 27678 root 10u IPv4 30691732 0t0 TCP db.sdwan:54074->sdwan.io:27017 (ESTABLISHED)
python 27678 root 11r CHR 1,9 0t0 30690329 /dev/urandom
python 27678 root 12u IPv4 30719611 0t0 TCP db.sdwan:51404->db.sdwan:37017 (ESTABLISHED)
python 27678 root 13u IPv4 30719610 0t0 TCP db.sdwan:47124->db.sdwan:27017 (ESTABLISHED)
python 27678 root 14r FIFO 0,8 0t0 38483750 pipe
————————————————
Original link: https://blog.csdn.net/peng314899581/article/details/79064616