top run can be controlled by the top internal commands to display process, the internal command is as follows:
s> change the screen update frequency
l> close or open the top line of the first portion of the first information indicates
t> close or open the first part of the second row and third row CPUs Tasks information indicates
m> close or open the first part of the fourth row and the fifth row Mem information indicates Swap
N> are arranged in the order of magnitude represents a PID process list
P> In order of CPU usage process list is arranged
M> memory usage in the order of magnitude are arranged in the process list
h> Displays help
The number n> Set displayed in the process list process
q> to exit the top
View multi-core CPU
-P ALL mpstat   // sar -P ALL
sar -P ALL> aaa.txt redirect the output to a file content aaa.txt
Enter the top command

1, system uptime and load averages:
These fields represent: the current time the system running time of a corresponding number of users currently logged on the average load within the last 10, 15 minutes
You can use "l" command to switch the display uptime
2, the task:

tasks Task process: The system now processes a total of 83, of which there are three in the run, 80 during sleep, stop state 0, zombie state have 0 (zombies)
This process can be summarized information with "t" switches the display
3, CPU status

- us - CPU time user running user processes
- sy - CPU time system running kernel processes
- ni - niced run the adjusted priority user process CPU time
- wa - IO wait to wait for IO completion of cpu time
- hi hardware interrupts the CPU time
- si software interrupt processing of CPU time
- st This virtual machine is stolen by the hypervisor CPU time
- T can switch the display command
4, memory usage:

Memory usage, similar to the first line is free physical memory, virtual memory using the second line (swap)
Physical Memory display:
All available memory, used memory, free memory, buffer memory
exchange:
All have been used, idle, buffer swap space
Memory can display 'm' command to switch
5, the status of each process (task) Monitoring
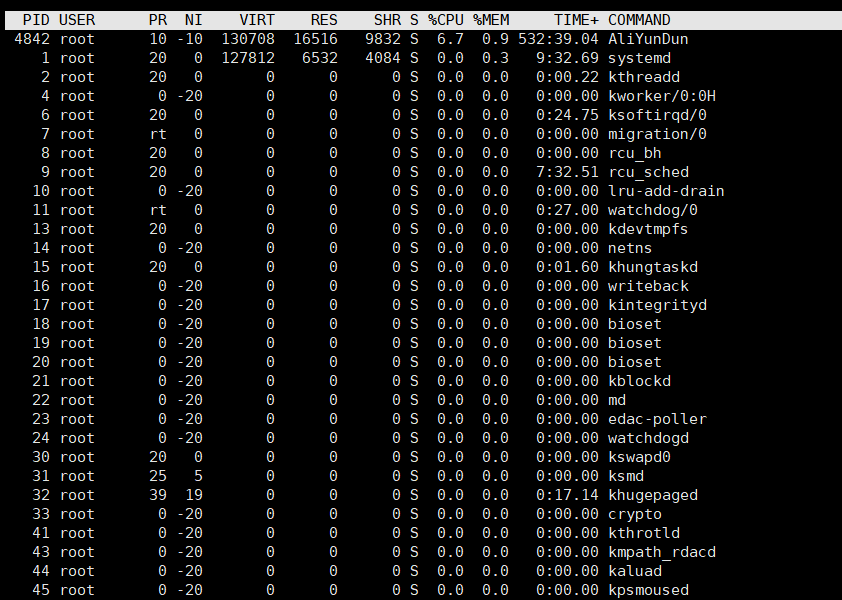
Unique identifier process id, process: PID
USER: the actual user name of the process owner
PR: skip priority of the process, present in this field 'rt', meaning that these processes are carried out in real-time status
NI: nice value of the process (priority), a smaller value means higher priority, negative values indicate high-level coincided with a lower priority
VIRT: virtual house training process used, the total amount of virtual memory used by the process, unit: kb VIRT = SWAP + RES
RES: resident memory size, memory-resident task is to use a non-switched physical memory size used by the process, not swapped out of physical memory size,
Unit kb RES = CODE + DATA
SHR: SHR is the process of using shared memory, shared memory size in kb
S: the state of this process, there are several different values
- D - different interrupts sleep
- R - operating state
- S - sleep state
- T - tracked or stopped
- Z - Zombie state
% CPU: the time since the last update to the CPU time used by the task now percentage
% MEM: The percentage of physical memory used by the process
TIME +: after all CPU time to start the task now used to the nearest hundredth of a second
COMMAND: running processes used by the command, process name (command name, command line)