Introduction to Echarts:
(1) Echarts component is an open source drawing software developed by Baidu: plug and play, very convenient! ! !
(2) This component can make the display of data in the foreground more beautiful; to put it bluntly, the current understanding is that this component is only to make the data displayed in the foreground in a better-looking way; therefore, it is ok;
(3) Echarts is a JS component! ! !
(4) Echarts is very rich in content, you can check it on the official website if you are interested; there are many tutorials and cases on the official website, there is always one suitable for you~~~haha
table of Contents
One: Echarts simple usage example:
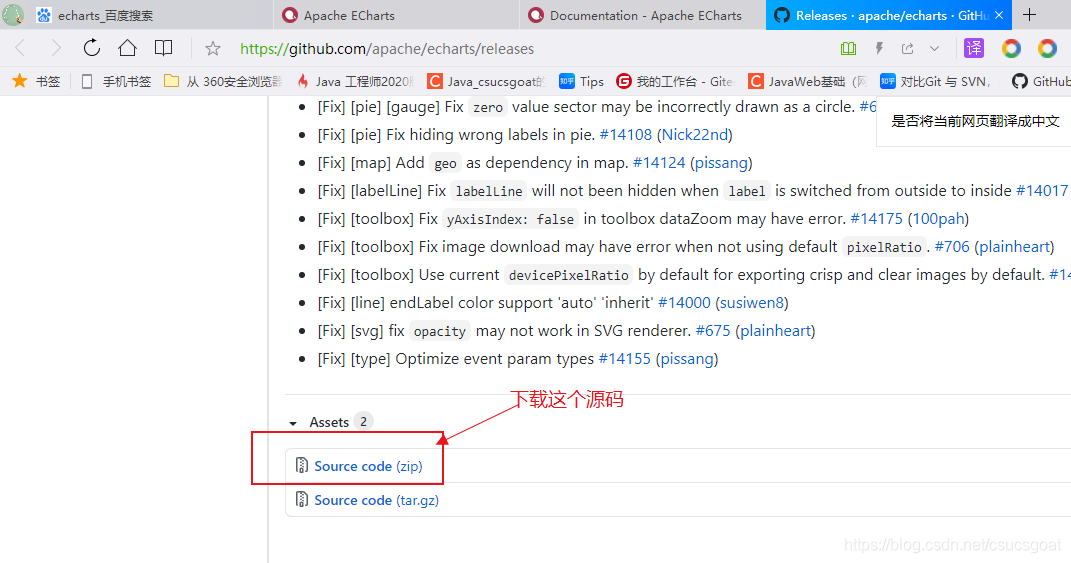
First, according to the tutorial, first download the JS file of the Echarts component:
Second, import the downloaded file into the project
Then, write an example (this is the point!!!)
One: Echarts simple usage example:


First, according to the tutorial , first download the JS file of the Echarts component:


Second, import the downloaded file into the project
After decompression, find the js file: echarts.min.js:

Add the JS file of the Echarts component to the project: this file needs to be placed in the WebContent directory; ;; Generally, a new folder will be created in the WebContent directory to store externally imported js files;

Then, write an example (this is the point!!!)
According to the tutorial on the official website: total.html content is as follows:
(1) The first step: introduce ECharts: <script type="text/javascript" src="js/echarts.min.js"></script>
(2) Step 2: Prepare a DOM container with height and width for ECharts. <div id="main" style="width: 600px;height:400px;"></div>
(3) The third step: set the chart: first define the picture table, then set various attributes of the chart in the option, and finally activate the settings;
<!DOCTYPE html>
<html>
<head>
<meta charset="UTF-8">
<title>Insert title here</title>
<script type="text/javascript" src="js/echarts.min.js"></script>
</head>
<body>
	<div id="main" style="width: 600px; height: 400px;"></div>
	<script type="text/javascript">
		// 基于准备好的dom,初始化echarts实例
		// 获取div对象,利用echarts.init()对获取的div进行初始化;于是就得到了一个myChart图表对象;
		var myChart = echarts.init(document.getElementById('main'));

		// 指定图表的配置项和数据
		var option = {
			title : {
				text : 'ECharts 入门示例'
			},
			tooltip : {},
			legend : {
				data : [ '销量' ]   //
			},
			xAxis : {
				data : [ "衬衫", "羊毛衫", "雪纺衫", "裤子", "高跟鞋", "袜子" ]
			},
			yAxis : {},    // y轴没有设置,表示显示对应的数值;;;数值就在下面的series中定义;
			series : [ {
				name : '销量',    // 这个需要和上面legend中的data的名称保持对应;
				type : 'line',    // 代表柱状图
				data : [ 5, 20, 36, 10, 10, 20 ]
			} ]
		};

		// 使用刚指定的配置项和数据显示图表。
		myChart.setOption(option);   // 激活刚才在option的设置项
	</script>
</body>
</html>
Finally, observe the effect
Start the application: visit total.html:

Two: the last few words
In fact, Echarts is very powerful: when you don’t understand, you can refer to the official website tutorials and cases when you need it!
And, for things like this, it's okay to try all kinds of trials, try more, OK ~~~

