CPU monitoring
First introduce the central processing unit CPU, the most important computing component in the computer. Generally, around the CPU we can:
Use the top command to observe the performance of the CPU;
Evaluate the queuing situation of CPU task execution through load;
Use vmstat to see how busy the CPU is.
1.top command-CPU performance
As shown in the figure below, when you enter the top command, press the 1 key to see the operating indicators and detailed performance of each core CPU.

There are multiple dimensions of CPU usage, which are explained below:
- The percentage of CPU occupied by us user mode, that is, the CPU consumed by the reference program;
- The percentage of CPU occupied by the sy kernel mode, you need to cooperate with the vmstat command to check whether the context switch is frequent;
- ni The percentage of CPU occupied by high-priority applications;
- wa The percentage of CPU occupied by the waiting I/O device. It is often used to judge I/O problems. An excessively high input/output device may have a very obvious bottleneck;
- The percentage of CPU occupied by hi hard interrupts;
- Percentage of CPU occupied by si soft interrupt;
- This value of st rarely changes on ordinary servers, because it measures the impact of the host on the virtual machine, that is, the percentage of time the virtual machine waits for the host CPU. This often happens on some oversold cloud servers. ;
- id Percentage of free CPU.
Generally, we pay more attention to the percentage of free CPU, which can reflect the overall CPU utilization.
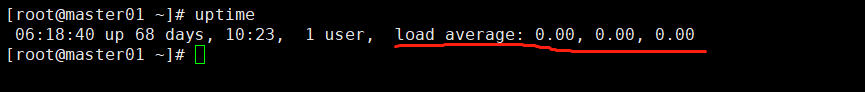
2. Load-CPU task queue situation
If we evaluate the queuing of CPU task execution, then it needs to be done through load. In addition to the top command, the uptime command can also be used to view the load situation, and the effect of load is the same. Many people see that the value of load reaches 1, and they think that the system load has reached its limit. This is not a problem on single-core hardware, but on multi-core hardware, this description is not completely correct. It is also related to the number of CPUs. E.g:
The load of a single core reaches 1, and the value of the total load is about 1.
The load of each core of dual-core reaches 1, and the total load is about 2;
The load of each core of the quad-core reaches 1, and the total load is about 4.
So, for a 16-core machine with a load of 10, your system is far from reaching its load limit.
3.vmstat-CPU busyness
Depending on how busy the CPU is, you can use the vmstat command. The following figure shows some output information of the vmstat command.

The following columns are of more interest:
- b If the system has a load problem, you can look at column b (Uninterruptible Sleep), which means waiting for I/O, which may be due to more disk reading or writing actions;
- si/so shows some usage conditions of the swap partition. The impact of the swap partition on performance is relatively large and requires special attention;
- cs The number of context switches per second. If the context switches are too frequent, you need to consider whether the number of processes or threads is too large.
The specific number of context switches for each process can be obtained by viewing the memory map file, as shown in the following code:
[root@localhost ~]# cat /proc/2788/status
...
voluntary_ctxt_switches: 93950
nonvoluntary_ctxt_switches: 171204
RAM
After we usually finish writing the code, for example, we write a C++ program and check its assembly. If we see that the memory address is not the actual physical memory address, then the application is using logical memory . Students who have studied the structure of computers should all have an understanding.
Logical addresses can be mapped to two memory segments: physical memory and virtual memory , then the memory available to the entire system is the sum of the two. For example, if your physical memory is 4GB and a SWAP partition of 8GB is allocated, the total memory available to the application is 12GB.
1. top command

As shown in the figure above, let's take a look at several parameters of the memory. From the top command, we can see several columns of data. Pay attention to the three areas framed by the box.
-
VIRT here refers to virtual memory, which is generally relatively large, so there is no need to pay too much attention;
-
RES We usually pay attention to the value in this column, which represents the actual memory occupied by the process. When monitoring is usually done, this value is mainly monitored;
-
SHR refers to shared memory, such as some so files that can be reused.
2. CPU cache
Since the speed difference between CPU and memory is very large, the solution is to add a cache . And the advanced cache will have multiple layers, such as L1, L2, L3 and other caches.
Most of Java's knowledge is centered on multi-threading. That's because if the time slice of a thread spans multiple CPUs, there will be synchronization problems. In Java, the most typical knowledge point related to CPU cache is the problem of false sharing for the Cache line in concurrent programming . Pseudo-sharing refers to the storage in these caches in units of cache lines. Even if you modify a very small piece of data in the cache line, it will be refreshed as a whole. Therefore, when multiple threads modify the values of some variables, if these variables are in the same cache line, it will cause frequent refreshes, which will inadvertently affect each other's performance.
Each core of the CPU is basically the same. Let's take CPU0 as an example. You can check its cache line size with the following command. This value is generally 64.
cat /sys/devices/system/cpu/cpu0/cache/index0/coherency_line_size
cat /sys/devices/system/cpu/cpu0/cache/index1/coherency_line_size
cat /sys/devices/system/cpu/cpu0/cache/index2/coherency_line_size
cat /sys/devices/system/cpu/cpu0/cache/index3/coherency_line_size
Of course, the same result can be obtained through cpuinfo:
[root@master01 cache]# cat /proc/cpuinfo | grep cache
cache size	: 4096 KB
cache_alignment	: 64
cache size	: 4096 KB
cache_alignment	: 64
cache size	: 4096 KB
cache_alignment	: 64
cache size	: 4096 KB
cache_alignment	: 64
In JDK8 and above, by turning on the parameter -XX:-RestrictContended, you can use the annotation @sun.misc.Contended to complete it to avoid the problem of false sharing. The specific situation will be explained in detail in the 12-class parallel optimization.
3. HugePage

In this picture, there is a TLB component [Translation Lookaside Buffer, which can be translated into a fast table according to the function, and the literal translation can be translated into a bypass conversion buffer, or it can be understood as a page table buffer. Stored in it are some page table files (virtual address to physical address conversion table)], it is very fast, but the capacity is limited, there is no bottleneck on ordinary PCs. However, if the machine configuration is relatively high and the physical memory is relatively large, a very large number of mapping tables will be generated, and the retrieval efficiency of the CPU will also be reduced.
The traditional page size is 4KB. In the era of large memory, this value is too small. The solution is to increase the page size, such as increasing it to 2MB, so that fewer mapping tables can be used to manage large memory. And this technology to increase pages is Huge Page . At the same time, HugePage is also accompanied by some side effects, such as increased competition, but on some machines with large memory, the performance will increase to a certain extent after being turned on.
4. Preload
In addition, the default behavior of some programs will also affect performance, such as the -XX:+AlwaysPreTouch parameter of JVM.
By default, although the JVM is configured with parameters such as Xmx and Xms to specify the initial size and maximum size of the heap, its memory will only be allocated when it is actually used; but if the parameter AlwaysPreTouch is added, the JVM will be started At that time, all memory is allocated in advance.
In this way, although the startup is slower, the performance at runtime will increase.
I / O
The difference between random writing and sequential writing of ordinary disks is very large, but sequential writing and CPU memory are still not in the same order of magnitude. The buffer is still the only tool to solve the speed difference , but in extreme cases, such as when the power is off, too much uncertainty is generated. At this time, these buffers are easy to lose.
1. iostat
The best indicator of I/O busyness is the wa% in the top command and the vmstat command. If your application writes a lot of logs, the I/O wait may be very high.


The indicators in the above figure are described in detail as follows.
-
%util : We are very concerned about this value. Normally, if this number exceeds 80%, it proves that the I/O load is already very serious.
-
Device : Indicates which hard disk it is. If you have multiple disks, multiple lines will be displayed.
-
avgqu-sz : The average length of the request queue, which is very similar to the cars queued at the intersection. Obviously, the smaller this value, the better.
-
awai : Response time includes queue time and service time, it has an empirical value. Normally, it should be less than 5ms. If this value exceeds 10ms, it proves that the waiting time is too long.
-
svctm : Indicates the average service time of operating I/O. You can recall the content of lesson 01, here is the meaning of AVG. svctm and await are strongly related. If they are close, it means that I/O has almost no waiting and the performance of the device is very good; but if await is much higher than the value of svctm, it proves that the waiting time of the I/O queue is too long , And the applications running on the system will slow down.