LightningChart JS is the highest performing chart library on the Web with excellent execution performance-monitor dozens of data sources at the same time using high data rates. GPU acceleration and WebGL rendering ensure that the graphics processor of your device is effectively utilized, thereby achieving high refresh rates and smooth animations. Very suitable for applications in trade, engineering, aerospace, medicine and other fields.
Click to download the latest trial version of LightningChart JS
Installation: npm install @arction/lcjs
We have made many changes to the 3D chart!
These include major improvements in the performance of 3D charts, including:
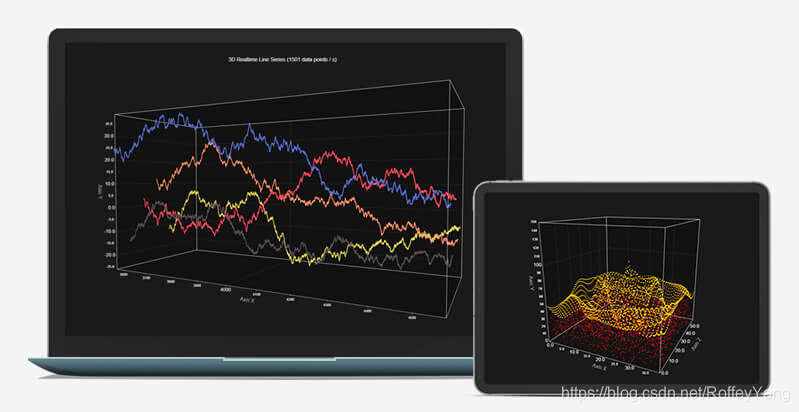
- Through real-time data, the performance of 3D point series and line series has been greatly improved, which is more than 1000 times faster than the previous version!
- The performance of the 3D Box series has been improved.
- 3D Axis Tick and Gridline performance improvements.
But this is not only related to the performance of 3D charts, we have also enhanced other aspects:
- The visual effects of the 3D Line series have been updated.
- The 3D chart now has its own background to help distinguish the chart area from the background.
- 3D chart camera auto-fit mode-this setting changes the camera distance to always fit the entire chart in the view.
- You can now change the 3D chart bounding box style.
Other improvements in the chart library
In addition to the 3D chart changes, the rest of our library has also received some favorites:
- Overall performance improvement
- Improved IntensitySeries zoom and pan performance
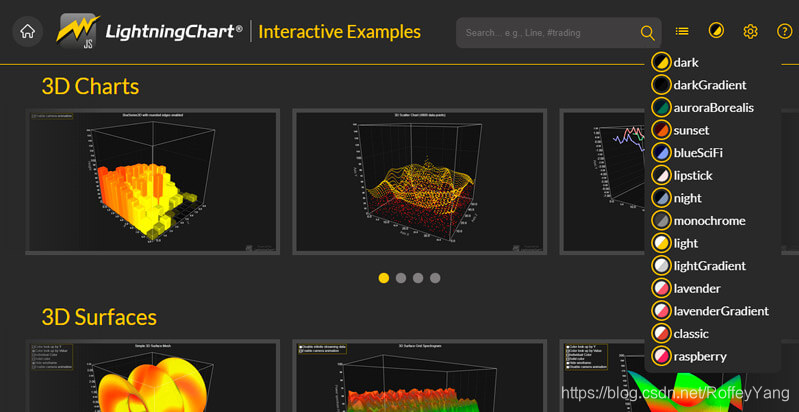
- Theme changes:
-Generated a new color palette for the themes added in 2.1.0
-Adjusted the visibility of Axis Tick Gridline to make the experience of using the new theme better
- Increased the possibility of changing the formatting program of IntensitySeries's result table. This works the same way as the other series.
- The wireframe was added to the heat map in version 2.1.0, but omitted from the change log there.
Exquisite interactive example
The interactive example of LightningChart JS has also undergone some new changes:
- Change the previous 3D Scatter series and Line series examples to better examples
- Added new real-time 3D examples for 3D line series and point series
- Change the previous IntensitySeries example to use the new version of xydata (version 1.4), thus making the example code clearer and easier to understand
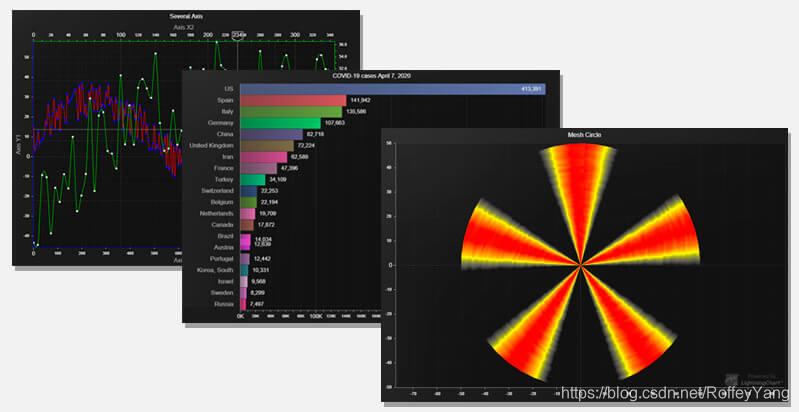
- Added new examples for XY charts:
– XY axis
--Grid circle
--Bar graph competition
Check out new and improved interactive examples! In short, LightningChart JS must provide all content on the product page, and here provide a competitive price. Feel free to contact us with any questions, you may have questions about our JS chart library, we are happy to help!
We will also share some interesting performance news and share information about the changes made to our JS performance demo, please stay tuned!