https://www.cnblogs.com/f-ck-need-u/p/8120008.html#1-web- "Long Shuai's Tomcat"
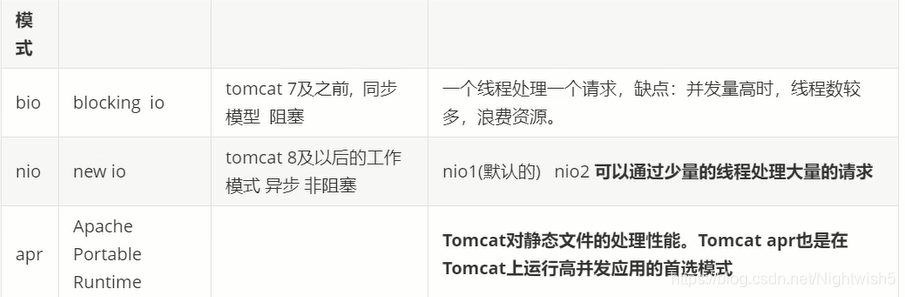
1. Tomcat working mode (bio, bio, apr)
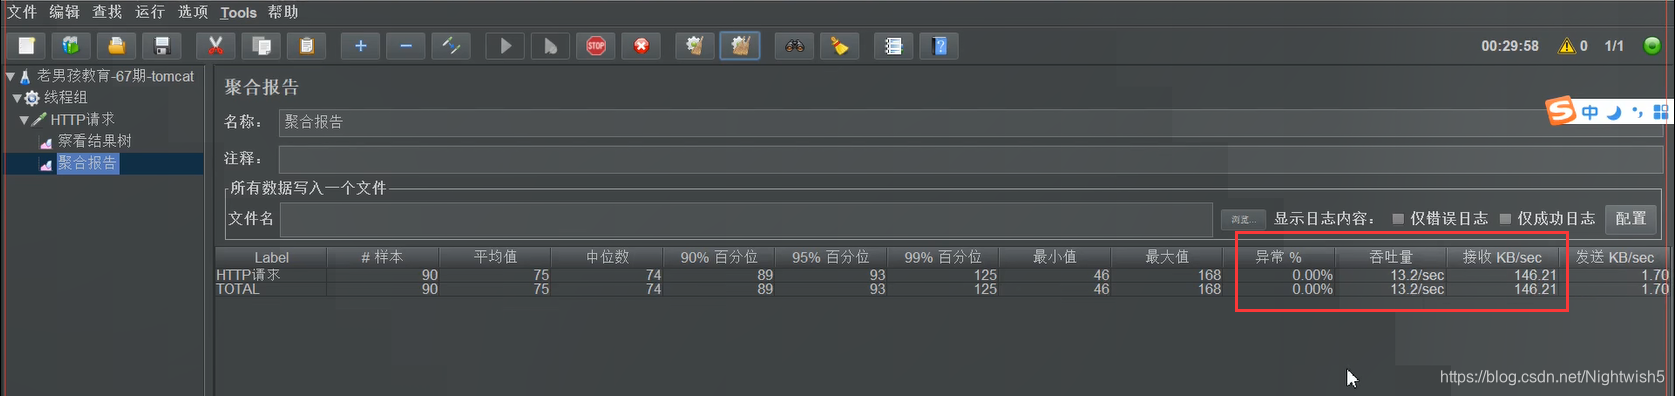
Changing the working mode is also part of the tuning, here you can match the adjusted parameters (throughput, etc.) from Jmeter's view
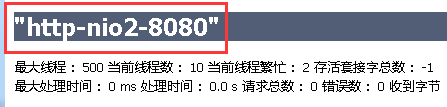
You can see what mode is currently being used at http://192.168.26.138:8080/manager/status.
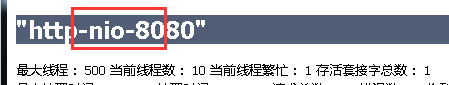
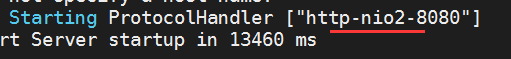
You can also see what mode is used at the end of the catalina.out log after the startup is completed.

1.1 Modify server.xml to change working mode (to be written)
8.5 version default nio mode
protocol="HTTP/1.1"

Adjust to nio2 mode and modify the value of protocol

 <Connector port="8080" protocol="org.apache.coyote.http11.Http11Nio2Protocol"
               connectionTimeout="20000"
               redirectPort="8443" />
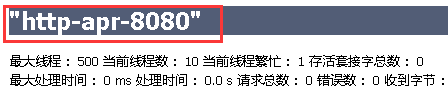
Adjust to apr mode
#安装apr环境 。   注意centos8没有tomcat-native源,需要编译安装
yum -y install apr apr-devel tomcat-native
<Connector port="8080" protocol="org.apache.coyote.http11.Http11AprProtocol"
               connectionTimeout="20000"
               redirectPort="8443" />
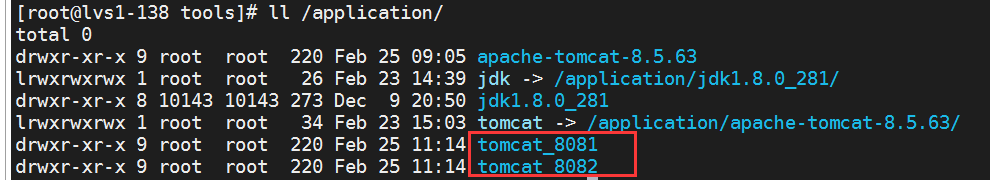
Two, tomcat multiple instances
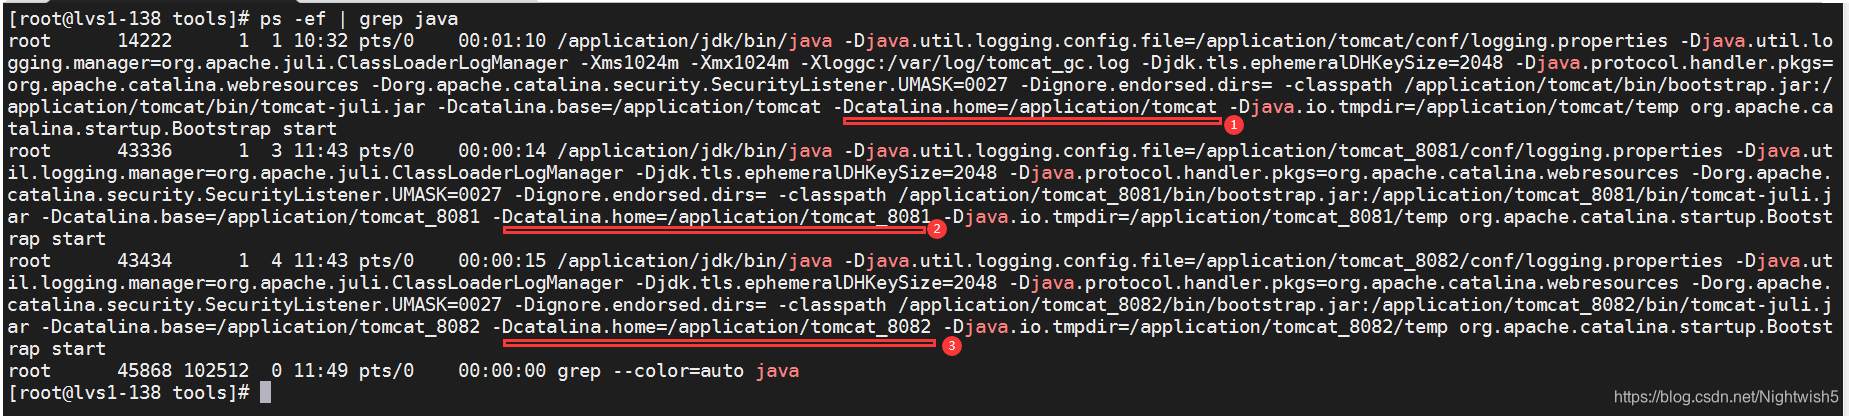
To run multiple tomcats on the same server, the implementation process is as follows:
tar -xf apache-tomcat-8.5.63.tar.gz
cp -r apache-tomcat-8.5.63/ tomcat_8081
cp -r apache-tomcat-8.5.63 tomcat_8082

sed -i.bak 's#8080#8081#g' tomcat_8081/conf/server.xml
sed -i.bak 's#8005#8006#g' tomcat_8081/conf/server.xml
sed -i.bak 's#8009#8010#g' tomcat_8081/conf/server.xml

sed -i.bak 's#8080#8082#g' tomcat_8082/conf/server.xml
sed -i.bak 's#8005#8007#g' tomcat_8082/conf/server.xml
sed -i.bak 's#8009#8011#g' tomcat_8082/conf/server.xml

mv tomcat_808* /application/
#分别启动另外两个实例8081和8082:
/application/tomcat_8081/bin/startup.sh
/application/tomcat_8082/bin/startup.sh
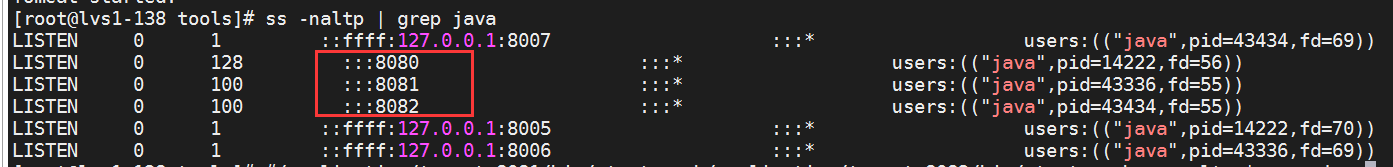
ss -naltp | grep java
echo "tomcat_8081" > /application/tomcat_8081/webapps/ROOT/index.jsp
echo "tomcat_8082 ..." > /application/tomcat_8082/webapps/ROOT/index.jsp
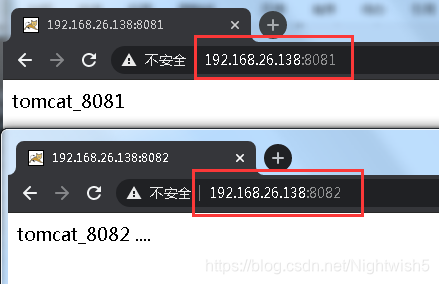
Three tomcats:
3. Tomcat failure case-high load (*)
The first version:

3.1 vmstat finds out the high load caused by CPU or disk
Look at r and b under procs on the left.
r A larger number means that the system's cpu usage is higher.
b A larger number means higher disk io.
[root@lvs1-138 conf]# vmstat 1 5
procs -----------memory---------- ---swap-- -----io---- -system-- ------cpu-----
 r  b   swpd   free   buff  cache   si   so    bi    bo   in   cs us sy id wa st
 1  0   1024 330348     20 803316    0    0     1     6   62   63  0  1 99  0  0
 0  0   1024 330308     20 803316    0    0     0     0  272  292  0  1 99  0  0
 0  0   1024 330168     20 803316    0    0     0     0  248  280  0  1 99  0  0
 0  0   1024 329920     20 803316    0    0     0     0  260  270  0  1 99  0  0
 0  0   1024 330084     20 803316    0    0     0     0  284  269  0  2 98  0  0
3.2 ps aux, htop specifically see the process pid caused
3.3 iotop displays the io status pid of each process
iotop -o #只显示在进行读写的进程
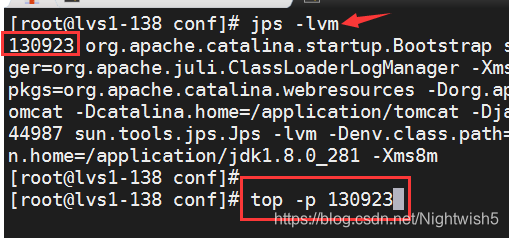
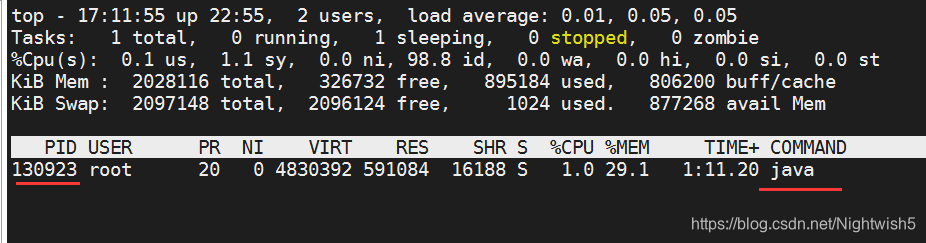
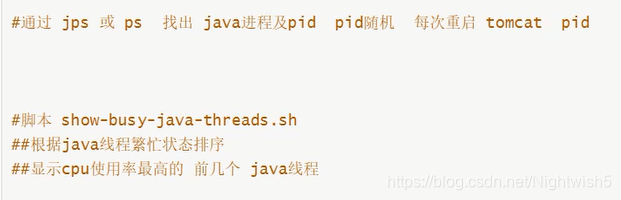
3.4 jps cooperate with top -p to watch java process
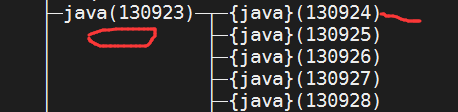
pstree -p:
130923 is the process, the pile behind is the thread
jps -lvm
pstree -p
#这个pid是java进程的pid
top -p 130923 # 只有进程显示 -p指定pid , -H 显示进程对应线程的信息
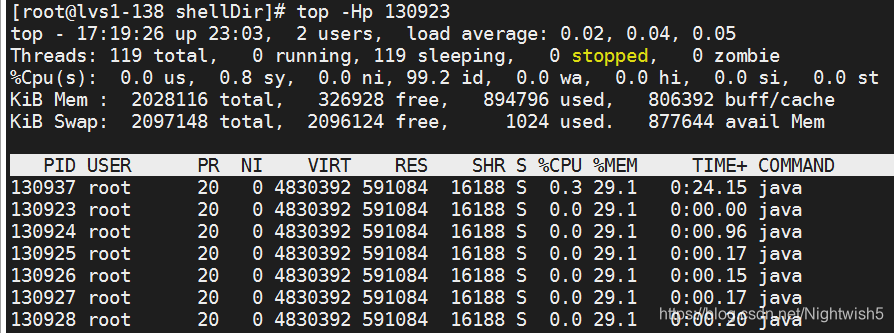
top -Hp 130923 #进程 线程都显示 ,然后看具体是那个线程出了问题,占用CPU啥的
3.5 Convert the thread id in question to hexadecimal.
130923 is the process. 130924 is the thread.
echo 'obase=16;130924' | bc
1FF6C
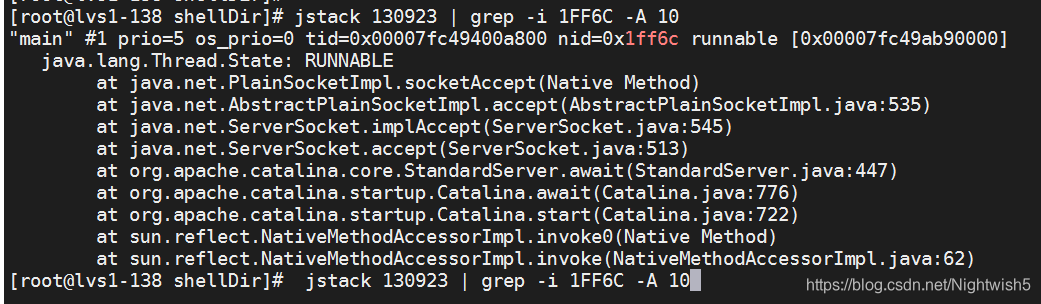
3.6 jstack java process id
Jstack java process id filters the hexadecimal id of java thread and communicates with development
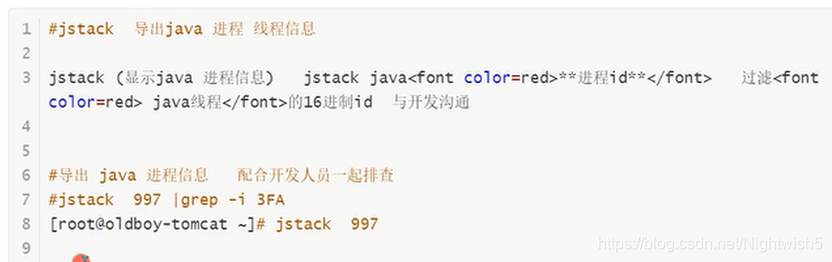
jstack 130923 | grep -i 1FF6C -A 10
split line= The above is the first 4 steps, the following is 5 6 7 steps
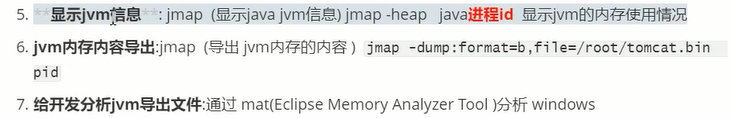
3.7 jmap (display java jvm information)
jmap (display java jvm information) jmap -heap java process id displays the memory usage of jvm
与jvm相关的 jmap 导出或显示jvm信息
显示:显示jvm使用情况一共多少 ,使用多少,剩余多少。
导出: jvm内存信息数据等等导出到磁盘
jmap -dump 导出jvm内存内容
#jmap -heap javaPid
jps -lvm
#java jvm使用率,后面用来做自定义监控
jmap -heap 130923
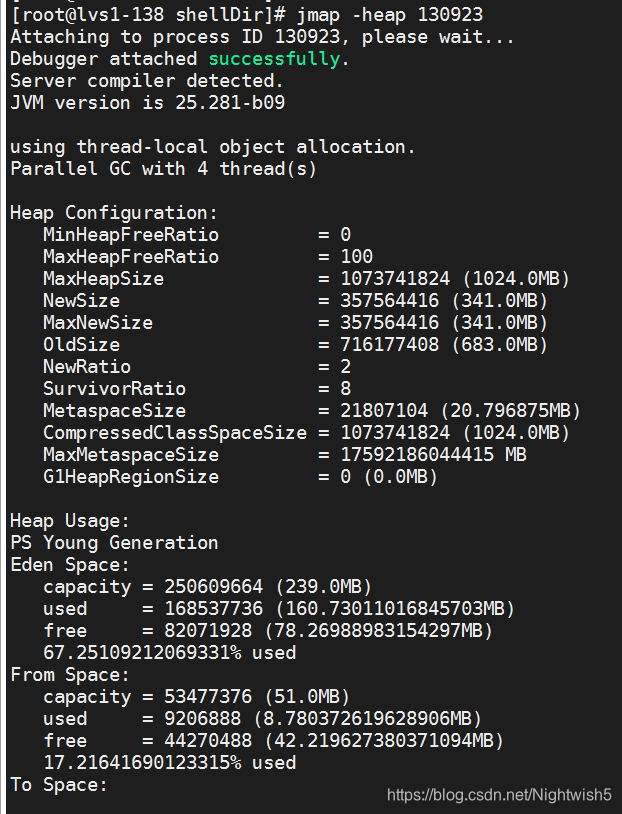
The above figure mainly looks at the percentages, 67% used, 17% used,
3.8 JVM memory content export
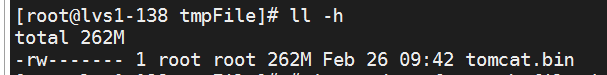
# jmap 导出jvm内存的内容
jmap -dump:format=b,file=/root/tmpFile/tomcat.bin 130923
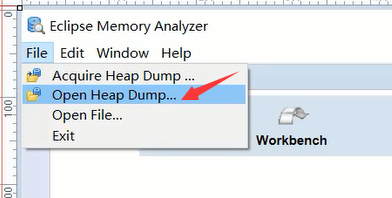
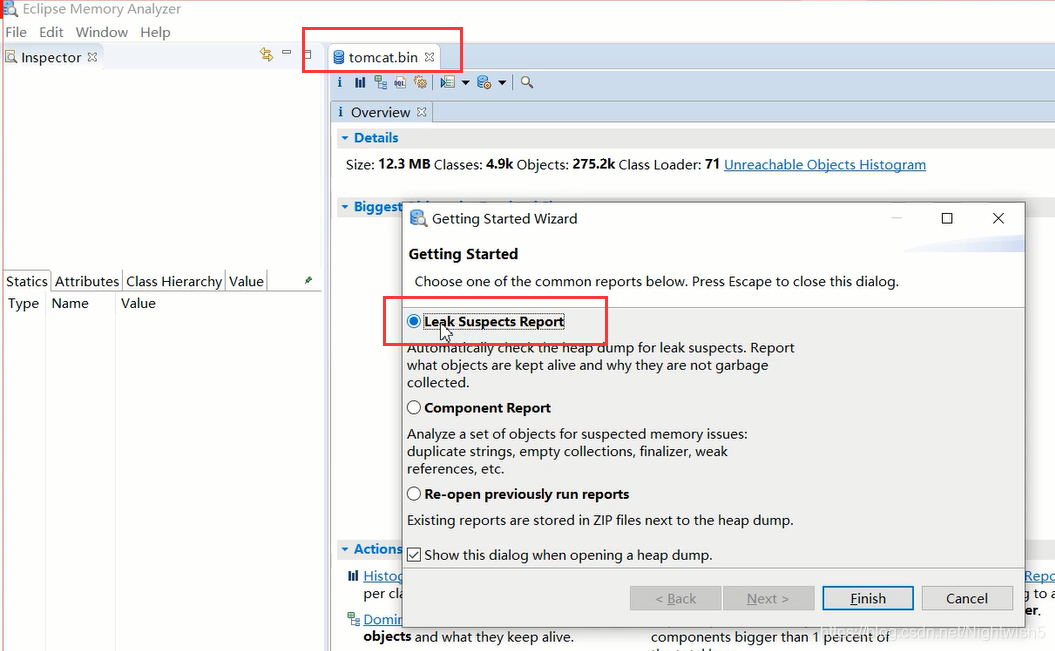
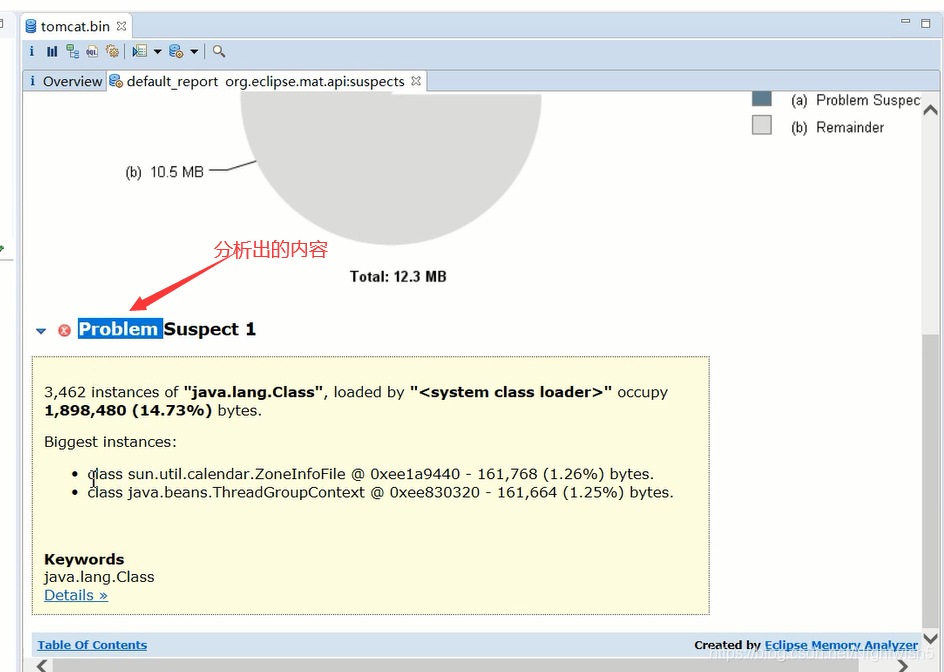
然后将其下载到window,使用java mat进行分析
3.8 Analyze through java mat (familiar) R&D assistance
https://www.cnblogs.com/liuchuanfeng/p/8484641.html "Using Memory Analyzer Tool (MAT) to Analyze Java Project Memory Leaks"
END
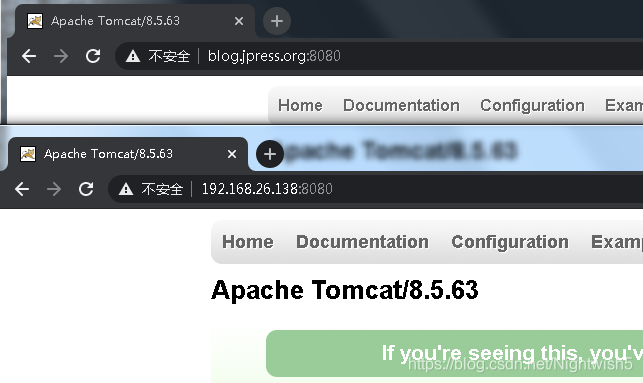
Fourth, after tomcat configures the domain name, the domain name access is normal, ip access 404
Modified the attributes of Tomcat's server.xml.
The hosts file has been parsed: 192.168.26.138 blog.jpress.org The
current problem is that the domain name access is normal, and the IP access is 404. Initially, when localhost, it is normal to use IP to access.
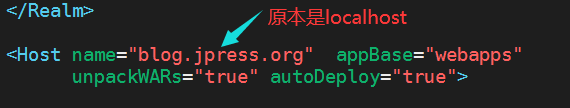
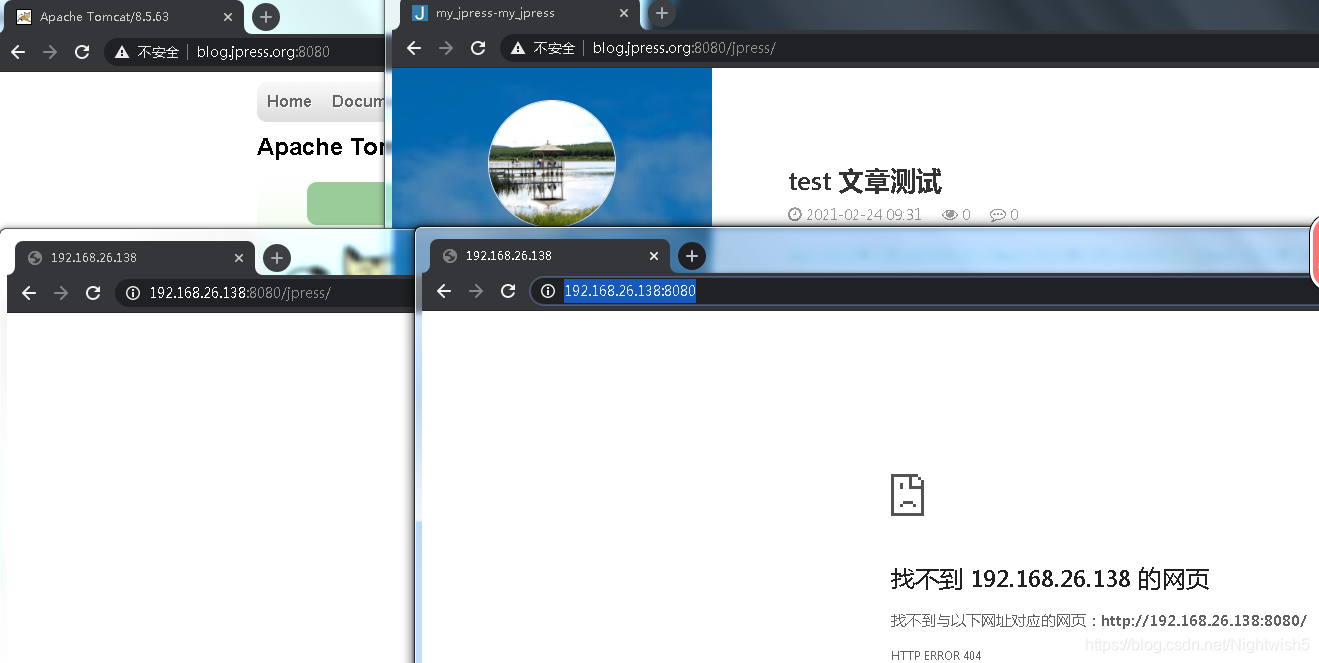
解答:想再用ip,就再添加一个<Host name>值为ip的站点
<Host name="blog.jpress.org" appBase="webapps"
unpackWARs="true" autoDeploy="true">
<Valve className="org.apache.catalina.valves.AccessLogValve" directory="logs"
prefix="localhost_access_log" suffix=".txt"
pattern="%h %l %u %t "%r" %s %b" />
</Host>
<Host name="192.168.26.138" appBase="webapps"
unpackWARs="true" autoDeploy="true">
<Valve className="org.apache.catalina.valves.AccessLogValve" directory="logs"
prefix="localhost_access_log" suffix=".txt"
pattern="%h %l %u %t "%r" %s %b" />
</Host>
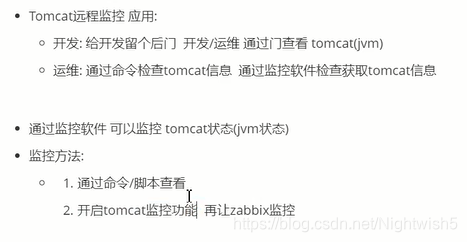
Five, tomcat monitoring function (abbreviated)
jps -lvm
https://blog.csdn.net/daiming573/article/details/106813931/
"show-busy-java-threads script content and usage process"
pstree -p
pstree -a
5.1 Monitoring tomcat (just write about 113 lines)
(If you start to report an error in version 8.5, you should write the following content in one line, or use the \ sign to divide it)

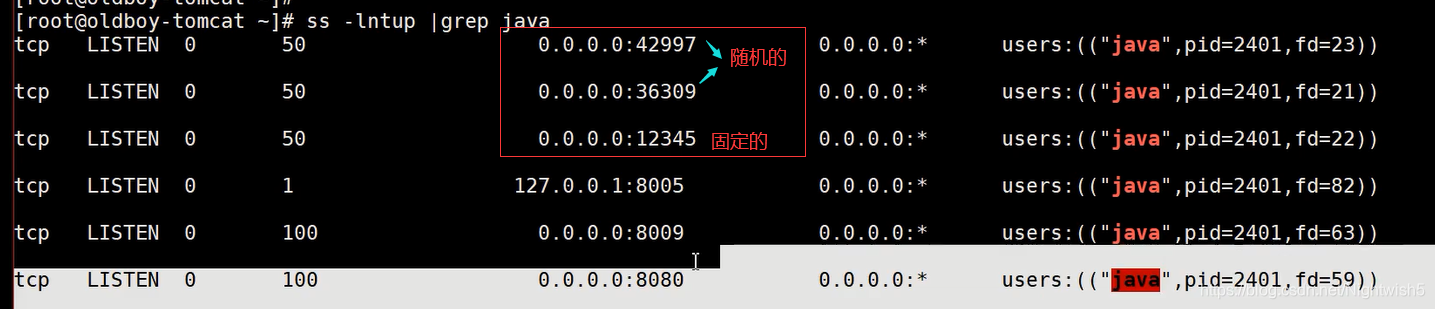
jmxremote tomcat远程监控 有一个固定端口+2个随机端口
5.2 jconsole (omitted)
5.3 jvisualVM (略)
And jmap, jstack
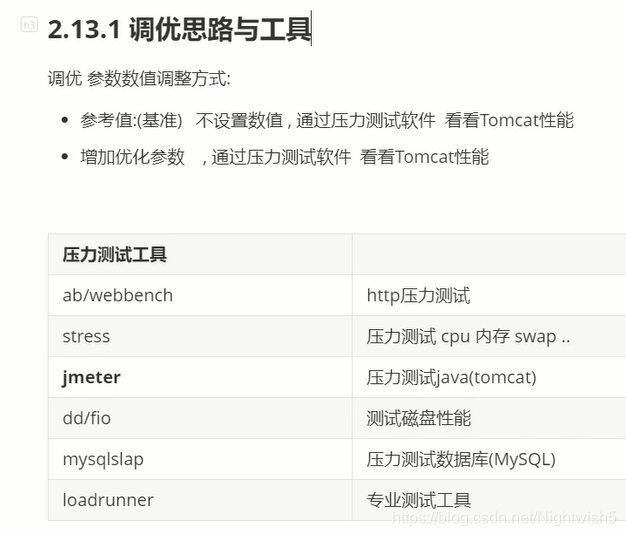
6. Stress test (abbreviated)
6.1 Jmeter (omitted)