Preface
The text and pictures in this article are from the Internet and are for learning and communication purposes only. They do not have any commercial use. If you have any questions, please contact us for processing.
PS: If you need Python learning materials, you can click on the link below to get it yourself
Python free learning materials and group communication answers Click to join
This article will teach you how to implement commonly used hypothesis tests in Python!

What kind of distribution is obeyed, what kind of interval estimation method is used, and what kind of test is used!
For example, if the variance ratio of two samples obeys the F distribution, the interval estimation uses the F distribution to calculate the critical value (thus obtaining the confidence interval), and finally uses the F test.

The basic steps of construction inspection:

Python toolkit for hypothesis testing
- Statsmodels is a toolkit for implementing statistical modeling and econometrics in Python, mainly including descriptive statistics, statistical model estimation, and statistical inference
- Scipy is a Python toolkit for mathematical, scientific and engineering calculations, mainly including statistics, optimization, integration, linear algebra and other packages related to scientific computing
Import Data
from sklearn.datasets import load_iris
import numpy as np
#导入IRIS数据集
iris = load_iris()
iris=pd.DataFrame(iris.data,columns=['sepal_length','sepal_width','petal_legth','petal_width'])
print(iris)
A z-test of the population mean
np.mean(iris['petal_legth'])
'''
原假设:鸢尾花花瓣平均长度是4.2
备择假设:鸢尾花花瓣平均长度不是4.2

'''

import statsmodels.stats.weightstats
z, pval = statsmodels.stats.weightstats.ztest(iris['petal_legth'], value=4.2)
print(z,pval)


'''
P=0.002 <5%, 拒绝原假设,接受备则假设。
'''
A t test of the population mean
import scipy.stats
t, pval = scipy.stats.ttest_1samp(iris['petal_legth'], popmean=4.0)
print(t, pval)

'''
P=0.0959 > 5%, 接受原假设,即花瓣长度为4.0。
'''
Simulated two-sample t test
#取两个样本
iris_1 = iris[iris.petal_legth >= 2]
iris_2 = iris[iris.petal_legth < 2]
print(np.mean(iris_1['petal_legth']))
print(np.mean(iris_2['petal_legth']))

'''
H0: 两种鸢尾花花瓣长度一样
H1: 两种鸢尾花花瓣长度不一样

'''

import scipy.stats
t, pval = scipy.stats.ttest_ind(iris_1['petal_legth'],iris_2['petal_legth'])
print(t,pval)

'''
p<0.05,拒绝H0,认为两种鸢尾花花瓣长度不一样
'''
Exercise
Data field description:
- gender: gender, 1 is male, 2 is female
- Temperature: body temperature
- HeartRate: Heart rate
- 130 rows and 3 columns
- Data link used: pan.baidu.com/s/1t4SKF6
A few small issues that need to be resolved this week:
1. Is the overall average human body temperature 98.6 degrees Fahrenheit?
2. Does the body temperature obey a normal distribution?
3. What are the abnormal data in the body temperature?
4. Is there a significant difference in body temperature between men and women?
5. The correlation between body temperature and heart rate (strong? weak? medium?)
1.1 Explore data
import numpy as np
import pandas as pd
from scipy import stats
data = pd.read_csv("C:\\Users\\baihua\\Desktop\\test.csv")
print(data.head())
sample_size = data.size #130*3
out:
   Temperature  Gender  HeartRate
0         96.3       1         70
1         96.7       1         71
2         96.9       1         74
3         97.0       1         80
4         97.1       1         73

print(data.describe())
out:
 Temperature      Gender   HeartRate
count   130.000000  130.000000  130.000000
mean     98.249231    1.500000   73.761538
std       0.733183    0.501934    7.062077
min      96.300000    1.000000   57.000000
25%      97.800000    1.000000   69.000000
50%      98.300000    1.500000   74.000000
75%      98.700000    2.000000   79.000000
max     100.800000    2.000000   89.000000

人体体温均值是98.249231
1.2 Does the temperature of the human body follow a normal distribution?
'''
人体的温度是否服从正态分布?
先画出分布的直方图,然后使用scipy.stat.kstest函数进行判断。

'''
%matplotlib inline
import seaborn as sns
sns.distplot(data['Temperature'], color='b', bins=10, kde=True)
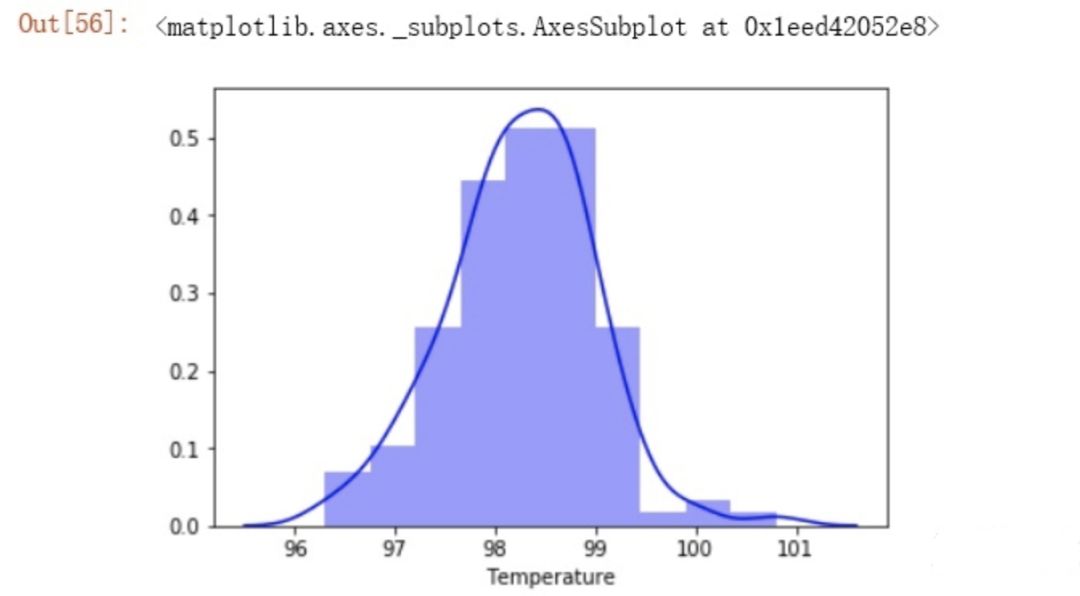
stats.kstest(data['Temperature'], 'norm')
out:
KstestResult(statistic=1.0, pvalue=0.0)
'''
p<0.05,不符合正态分布
'''
Determine whether to obey the t distribution
'''
判断是否服从t分布:

'''

np.random.seed(1)
ks = stats.t.fit(data['Temperature'])
df = ks[0]
loc = ks[1]
scale = ks[2]
t_estm = stats.t.rvs(df=df, loc=loc, scale=scale, size=sample_size)
stats.ks_2samp(data['Temperature'], t_estm)

'''

 pvalue=0.4321464176976891 <0.05,认为体温服从t分布
'''
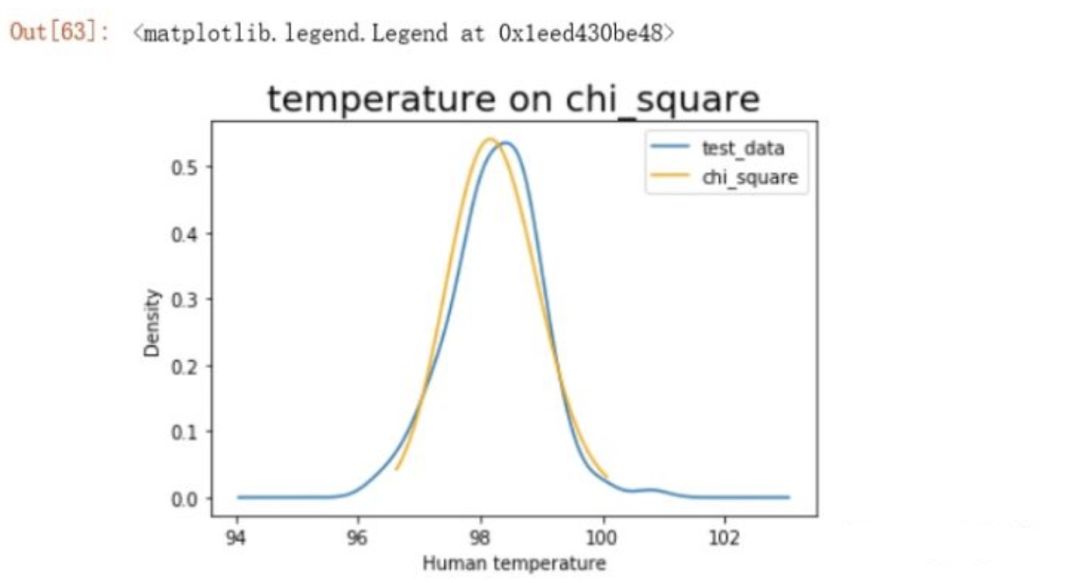
Determine whether to obey the chi-square distribution
'''
判断是否服从卡方分布:

'''
np.random.seed(1)
chi_square = stats.chi2.fit(data['Temperature'])
df = chi_square[0]
loc = chi_square[1]
scale = chi_square[2]
chi_estm = stats.chi2.rvs(df=df, loc=loc, scale=scale, size=sample_size)
stats.ks_2samp(data['Temperature'], chi_estm)

'''
pvalue=0.3956146564478842>0.05,认为体温服从卡方分布

'''
Draw chi-square distribution histogram
'''
绘制卡方分布图

'''

from matplotlib import pyplot as plt
plt.figure()
data['Temperature'].plot(kind = 'kde')
chi2_distribution = stats.chi2(chi_square[0], chi_square[1],chi_square[2])
x = np.linspace(chi2_distribution.ppf(0.01), chi2_distribution.ppf(0.99), 100)
plt.plot(x, chi2_distribution.pdf(x), c='orange')
plt.xlabel('Human temperature')
plt.title('temperature on chi_square', size=20)
plt.legend(['test_data', 'chi_square'])
1.3 What are the abnormal data in human body temperature?
'''
已知体温数据服从卡方分布的情况下,可以直接使用Python计算出P=0.025和P=0.925时(该函数使用单侧概率值)的分布值,在分布值两侧的数据属于小概率,认为是异常值。
'''
lower1=chi2_distribution.ppf(0.025)
lower2=chi2_distribution.ppf(0.925)
t=data['Temperature']
print(t[t<lower1] )
print(t[t>lower2])

out:

0     96.3
1     96.7
65    96.4
66    96.7
67    96.8
Name: Temperature, dtype: float64
63      99.4
64      99.5
126     99.4
127     99.9
128    100.0
129    100.8
Name: Temperature, dtype: float64
1.4 Is the temperature difference between men and women significant?
'''
此题是一道两个总体均值之差的假设检验问题,因为是否存在差别并不涉及方向,所以是双侧检验。建立原假设和备择假设如下:
H0:u1-u2 =0  没有显著差
H1:u1-u2 != 0  有显著差别

'''
data.groupby(['Gender']).size() #样本量65
male_df = data.loc[data['Gender'] == 1]
female_df = data.loc[data['Gender'] == 2]

'''
使用Python自带的函数,P用的双侧累计概率
'''


import scipy.stats
t, pval = scipy.stats.ttest_ind(male_df['Temperature'],female_df['Temperature'])
print(t,pval)
if pval > 0.05:
    print('不能拒绝原假设,男女体温无明显差异。')
else:
    print('拒绝原假设,男女体温存在明显差异。')

out:
-2.2854345381654984 0.02393188312240236
拒绝原假设,男女体温存在明显差异。
1.5 Correlation between body temperature and heart rate (strong? weak? medium?)
'''

体温与心率间的相关性(强?弱?中等?)

'''

heartrate_s = data['HeartRate']
temperature_s = data['Temperature']
from matplotlib import pyplot as plt
plt.scatter(heartrate_s, temperature_s)

stat, p = stats.pearsonr(heartrate_s, temperature_s)
print('stat=%.3f, p=%.3f' % (stat, p))
print(stats.pearsonr(heartrate_s, temperature_s))

'''
相关系数为0.004,可以认为二者之间没有相关性

'''