Preface
Nice to meet you~ Welcome to read my article.
In the previous article JVM basics (1): Understanding virtual machines , introduced what is a virtual machine, and bytecode class files. This article mainly talks about the runtime data area structure of JVM.
We know that c/c++ is divided into stack and heap area in memory. The stack area stores local variables of functions, etc. The heap area is a space opened up by users. When developers need to create a new object, they first need to open up a space in the heap area, then initialize and use it. Finally, you need to manually release the memory area yourself. The JVM has done all this work. When we need to create a new object, we only need a keyword newto create an object. When we no longer use the object, the garbage collection mechanism will help us automatically reclaim the memory. . Both methods have their own advantages. C/C++ has the supreme right to memory, and it also means that it has a heavier responsibility to manage the life cycle of objects; JVM automatically manages memory, shielding developers from direct memory operations, but If you do not know enough about the runtime data area of the JVM, problems such as memory leaks and memory overflows are prone to occur. This is also one of the reasons why we need to learn the JVM runtime data area.
The JVM runtime data area structure is similar to c/c++, and the stack area and heap area are also allocated. The specific structure is as follows:
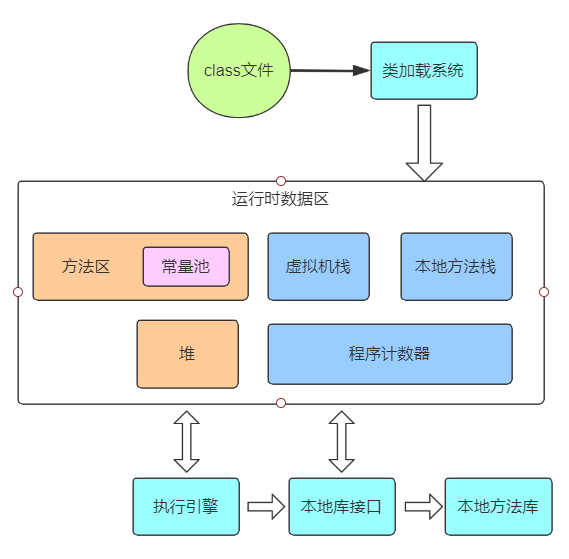
Our class file is loaded into the virtual machine through the class loading system, and processed in the virtual machine. The execution engine is responsible for executing programs, calling methods and executing them. The undergraduate library interface and the local method library are a series of platform-related methods, such as taking pictures and notifications on Android. Our focus is on the runtime data area. The method area and heap are shared by processes, while the virtual machine stack, local method stack, and program counter are shared by threads. The following explains each memory area.
Heap area
The heap area mainly stores object instances and is the main goal of garbage collection. The heap area may not be physically continuous, but it must be logically continuous. The heap area is shared by threads.
The heap area is a key point we need to pay attention to. All the objects and arrays we create (in fact, arrays are also a kind of objects) are allocated in the heap area. The heap area is shared by threads, and the objects created by all threads are stored in the heap area. Heap area is the main goal of garbage collection, and it is also a high incidence of memory leaks and abnormal memory overflows. The heap area is not a whole block of memory, but will be divided to achieve different features, such as generational design, thread buffers, etc., to solve garbage collection, thread safety and other issues, which will be explained in detail in the following series of articles.
The size of the heap area can be expandable or fixed. The current mainstream virtual machines are all designed to be expandable. When the heap fails to apply for memory and cannot be expanded, an OutOfMemoryError will be thrown.
Method area
The method area mainly stores class information, constants, static variables, and code cache after instant compilation. The method area is shared by threads.
The classes in our class file are loaded and stored in the method area. Constants, that is final, variables of the type and whose value can be determined at the compiling stage, and static variables are all placed in this place. The machine code after the bytecode is interpreted by the interpreter will also be cached in this area.
The life cycle of the data stored in the method area seems to accompany the entire process, but in fact it also needs to be garbage collected, but the effect of the recycling is difficult to satisfy, for example, the unloading of classes is very demanding for timing. In the early days of HotSpot, the method area and the heap area were directly combined, and the method area was regarded as the immortal generation, and the heap was divided into the young and old generations. The method area and the heap area were directly garbage collected in a unified manner, eliminating the need for special Write a set of garbage collection algorithms in the method area. This design can easily lead to memory overflow problems. After jdk8, HotSpot abandoned the immortal generation and switched to the meta-space realized by local memory.
When the new memory allocation requirements cannot be met, OutMemoryError will be thrown.
Runtime constant pool
The constant pool is a part of the method area, mainly storing data constants and symbol references.
There is generally no doubt about storage constants, but finalmodified constants. Symbol references include: package name, fully qualified name of class, method name descriptor, etc. JVM is different from c/c++ in that it does not determine the layout of the code at the compilation stage, but requires a certain class to be loaded and used, that is, dynamic loading. Then the symbolic references of all classes in the entire program are stored in the constant pool. When a class needs to be loaded, the symbolic reference of the class needs to be obtained from the constant pool for class loading. If it cannot be found, a ClassNotFoundError will be thrown. abnormal.
The constant pool is not only in the compilation phase to create data, you can also add data to the constant pool in the runtime phase, such as String intern method. So when the constant pool cannot expand the memory, an OutOfMemoryError exception will be thrown.
Program counter
The program counter is an indicator of the line number of the bytecode executed by the current thread, marking the next code execution position of the program. The program counter is private to the thread.
The interpreter directs the execution of the code through the program counter. Branches, loops, exceptions, jumps, thread recovery, etc. all need the program counter to control. Java's multi-threaded implementation is thread rotation to allocate processor execution time. When the thread is suspended, the program counter will record the execution position of the current thread code, and the correct code execution position can be restored when the thread resumes.
Under normal circumstances, the program counter indicates the address of the bytecode instruction. If the local method is currently running, the value of the program counter is 0. This piece of memory will not throw OOM exceptions. After all, it is stored in one address and does not require much memory expansion.
Virtual machine stack & local method stack
The virtual machine stack is the thread memory model of the JVM method execution: when each method is executed, a stack frame is pushed into the virtual machine stack (used to store local variables, operand stacks, dynamic links, method exits, object references And other information).
Local method stack: Similar to the virtual machine stack, but the type of method executed is a local method.
The virtual machine stack is somewhat similar to the c/c++ stack. Each method in the JVM will push a stack frame when it is executed, and pop the stack frame when the method ends. The stack frame contains various data types in the method, but it should be noted that the object reference is stored in the stack frame instead of the object itself, and the specific object is stored in the heap. The smallest unit of data saved in the stack frame is the variable slot. Variable slots are different according to different virtual opportunities, such as 32-bit, 64-bit, etc. If a 32-bit variable slot is used, then one int data occupies one variable slot, and one double data occupies two variable slots.
The native method stack Java virtual machine specification does not clearly specify the implementation method. HotSpot directly combines the local method stack and the virtual machine stack into one for unified management.
Note that the method stack will throw two exceptions: StackOverFlowError and OutOfMemoryError. The former will be thrown when the depth of the stack reaches the limit, and the latter will be thrown when it is impossible to apply for more space to expand the stack size.
to sum up
The article explains the overall memory structure of the JVM and analyzes the functions and characteristics of various areas of the data area at runtime.
Understanding the runtime data area is to understand the JVM's division of memory areas, and to know where memory leaks and memory overflows occur, so that we can write more robust code. At the same time, it is also the basis for continuing to understand other knowledge of the JVM, such as the GC mechanism of the heap area and the object creation process, the class loading subsystem, the thread memory model, etc., all based on the overall JVM model.
So far, the full text is not easy to be original. If it is helpful, you can like it, bookmark, comment, forward and follow.
The author is talented and knowledgeable, welcome to comment in the comment area.
If you need to reprint, please private message.Also welcome to my personal blog: Portal