Python machine learning combat 1: Use linear regression models to solve the problems of Boston housing price prediction and graduate enrollment rate

Article Directory
boston house price forecast
Import library
from  sklearn.linear_model import LinearRegression
from  sklearn.datasets import load_boston
import matplotlib.pyplot as plt
%matplotlib inline
Get data set
bosten = load_boston()
Linear regression
- Model training
clf = LinearRegression()
clf.fit(bosten.data[:,5:6],bosten.target)  #模型训练
x = bosten.data[:,5:6]
- Regression coefficients
clf.coef_
array([9.10210898])
- Predictive value
y_pre = clf.predict(bosten.data[:,5:6]) #模型的输出值
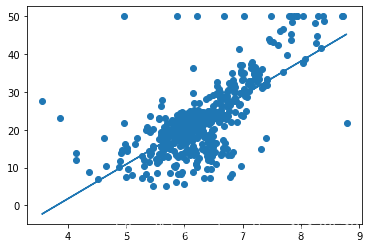
- Visualization
plt.scatter(x,bosten.target)
plt.plot(x,y_pre)
plt.show()
Graduate enrollment rate
Import library
import pandas as pd
from sklearn.linear_model import LogisticRegression  #逻辑回归
from sklearn.model_selection import train_test_split  #测试集训练集分割
from sklearn.metrics import classification_report
Import Data
data = pd.read_csv(r"LogisticRegression.csv")
data_tr,data_te,label_tr,label_te = train_test_split(data.iloc[:,1:],data["admit"],test_size = 0.2)
data.iloc[:,1:]
| gre | gpa | rank | |
|---|---|---|---|
| 0 | 380 | 3.61 | 3 |
| 1 | 660 | 3.67 | 3 |
| 2 | 800 | 4.00 | 1 |
| 3 | 640 | 3.19 | 4 |
| 4 | 520 | 2.93 | 4 |
| ... | ... | ... | ... |
| 395 | 620 | 4.00 | 2 |
| 396 | 560 | 3.04 | 3 |
| 397 | 460 | 2.63 | 2 |
| 398 | 700 | 3.65 | 2 |
| 399 | 600 | 3.89 | 3 |
400 rows × 3 columns
data_tr.head()
| gre | gpa | rank | |
|---|---|---|---|
| 252 | 520 | 4.00 | 2 |
| 94 | 660 | 3.44 | 2 |
| 41 | 580 | 3.32 | 2 |
| 2 | 800 | 4.00 | 1 |
| 207 | 640 | 3.63 | 1 |
data_te.head()
| gre | gpa | rank | |
|---|---|---|---|
| 45 | 460 | 3.45 | 3 |
| 311 | 660 | 3.67 | 2 |
| 391 | 660 | 3.88 | 2 |
| 357 | 720 | 3.31 | 1 |
| 117 | 700 | 3.72 | 2 |
Model training
clf = LogisticRegression()
clf.fit(data_tr,label_tr)  #模型训练
pre = clf.predict(data_te) #模型预测
- The predicted label, the actual value of label_te
pre
array([0, 0, 0, 1, 0, 0, 1, 1, 0, 0, 0, 0, 0, 0, 0, 0, 0, 0, 0, 0, 0, 0,
       0, 0, 0, 0, 0, 0, 0, 0, 1, 0, 0, 0, 0, 0, 0, 0, 0, 0, 0, 0, 0, 0,
       0, 0, 0, 1, 1, 0, 1, 0, 0, 0, 1, 0, 0, 0, 0, 0, 1, 0, 0, 0, 1, 0,
       0, 0, 0, 0, 0, 0, 0, 0, 0, 0, 0, 0, 0, 0], dtype=int64)
- The classification_report function in sklearn is used to display text reports of the main classification indicators. Display the accuracy, recall rate, F1 value and other information of each class in the report.
res = classification_report(label_te,pre)
print(res)
              precision    recall  f1-score   support

           0       0.71      0.89      0.79        56
           1       0.40      0.17      0.24        24

    accuracy                           0.68        80
   macro avg       0.56      0.53      0.51        80
weighted avg       0.62      0.68      0.63        80
Recommended reading
- Use Python to complete the basics of time series analysis
- A practical case of SPSS establishing a time series multiplication season model
- Practical case of building a time series ARIMA model in Python
This is the end, if it helps you, welcome to like and follow, your likes are very important to me