DataWhale & Pandas (comprehensive exercises)
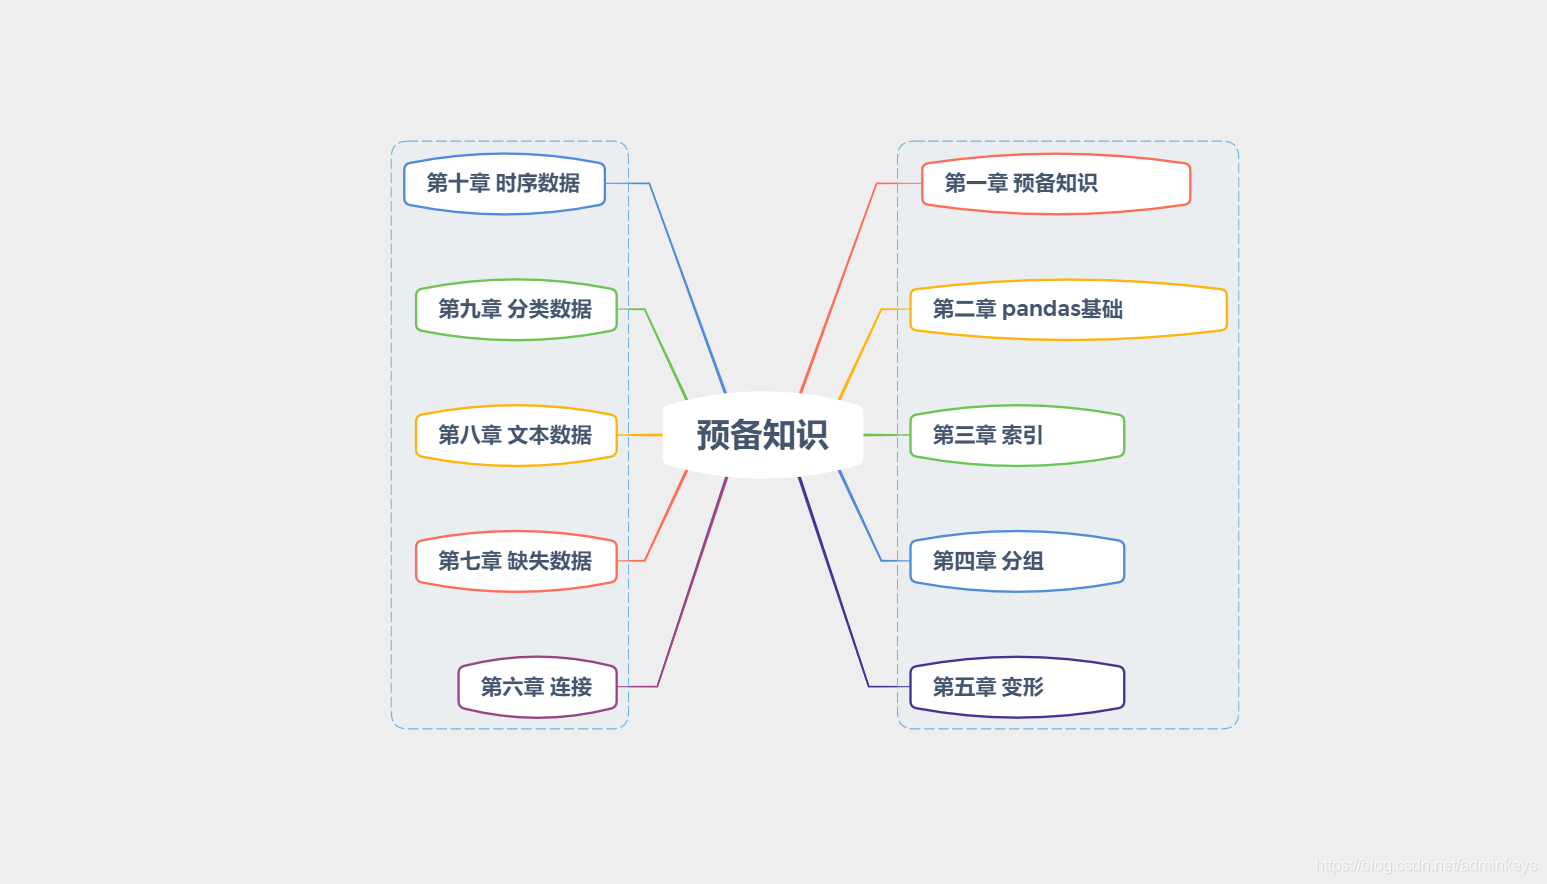
Study outline:

This section is a comprehensive exercise. There are three tasks in total, as shown below:
import numpy as np
import pandas as pd
[Task 1] Diversity of corporate income
[Title description] The industry income diversity of an enterprise can be modeled on the concept of information entropy to define income entropy indicators:
Among them
is the proportion of the company's income from a certain industry in that year to the total income of all industries in that year. The company and year to be calculated are stored in company.csv, and the company, various types of income and year of income are stored in company_data.csv. Now please use the data in the latter table to add a column to the previous table to indicate the company's income entropy index I for that year.
[Data download] Data set download link password: u6fd

[Task 2] Transformation of the team learning information table
[Title description] Please transform the team information table for team study into the following form, where the column of "whether the team leader" is 1 means the team leader, otherwise it is 0

[Data download] Data set download link password: iz57
[Task Three] Voting in the U.S. General Election
[Title description] The two data tables respectively give the population of each county in the United States and the voting status of the general election. Please solve the following questions:
- How many counties satisfy that the total number of votes exceeds half of the county's population
- The state (state) is used as the row index, and the voting candidates are listed. The order of the names is sorted according to the candidate's total votes in the United States. The corresponding element of the row and column is the total number of votes the candidate has obtained in the state.

- Each state consists of several counties. Define Biden’s vote rate in that county minus Trump’s vote rate in that county’s BT index. If the median of all counties in a state is greater than 0, then Call this state Biden State, please find out all Biden States
[Data download] Data set download link extraction code: q674
Haven't figured it out yet, please make up after reading the solution