Image quality evaluation (1): Introduction to IQA
Introduction
Image quality assessment (IQA) aims to use computational models to measure image quality so that the results are consistent with subjective quality (that is, images with good subjective quality should have a higher IQA score). With the rapid growth of digital image and transmission technology, IQA has become more important in the fields of image acquisition, transmission, compression, restoration, and enhancement. Because subjective IQA technology cannot be used in many scenarios (such as real-time scenarios, etc.), objective IQA technology needs to be developed to automatically and robustly measure image quality. At the same time, the evaluation results need to be statistically consistent with human observers. Various IQA methods have emerged in the past few decades.
IQA classification
According to whether there is a reference image, IQA is divided into full reference (FR), semi-reference (reduced-reference, RR), and no-reference (no-reference).
Full reference FR: In addition to the distorted image, a reference image without distortion is also given in the FR problem.
Semi-reference RR: In the RR problem, a distorted image is given without a reference image, but partial information of the reference image is given. As for what kind of information depends on your algorithm. The RR algorithm is very useful in real-time systems. The working principle of RR is shown in the figure below.

No reference NR: Only the distorted image is given in the NR problem. NR is the most difficult image quality evaluation method.
How to check the accuracy of IQA evaluation?
If you want to evaluate the performance of the existing IQA algorithm, or compare your IQA algorithm with the existing IQA algorithm, you need to do a lot of experiments on the public IQA data set. Usually, such a data set has a large number of reference images, and each reference image corresponds to multiple distorted images (with different distortion types). Each distorted image has a subjective score of a human observer. In order to evaluate an IQA algorithm, you need to calculate the IQA for each distorted image in the data set, and then calculate the correlation between the IQA score and the subjective score.
| Database | Source Images | Distorted Images | Distortion Types | Image Type | Observers |
|---|---|---|---|---|---|
| TID2013 | 25 | 3000 | 24 | color | 971 |
| TID2008 | 25 | 1700 | 17 | color | 838 |
| CSIQ | 30 | 866 | 6 | color | 35 |
| LIVE | 29 | 779 | 5 | color | 161 |
| IVC | 10 | 185 | 4 | color | 15 |
| Toyama-MICT | 14 | 168 | 2 | color | 16 |
| A57 | 3 | 54 | 6 | gray | 7 |
| WIQ | 7 | 80 | 5 | gray | 60 |
The current mainstream IQA data set is shown in the table above. Among them, TID2008, CSIQ, and LIVE are the most comprehensive and most used.
If you have used an IQA algorithm to calculate the IQA value of all distorted images in the data set, how do you measure whether this IQA value is accurate (that is, is it close to the subjective result)? There are generally four methods to evaluate the performance of the IQA algorithm.
1. Spearman rank order correlation coefficient (SROCC) Spearman rank correlation coefficient

n is the number of distorted images in the data set, and di is the difference between the subjective and objective levels of the i-th image.
2. Kendall rank order correlation coefficient (KROCC) Kendall correlation coefficient
![]()
nc is the number of pairs of consistent elements in the data set, and nd is the number of pairs of inconsistent elements in the data set.
Matlab calculates the above two correlation coefficients as follows:
SROCC_Corr_Coef = corr(subjetiveScores, objectiveScores, 'type', 'spearman');
KROCC_Corr_Coef = corr(subjetiveScores, objectiveScores, 'type', 'kendall');3、Pearson linear correlation coefficient (PLCC)
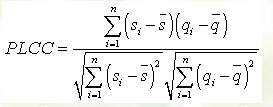
4、root mean squared error (RMSE)
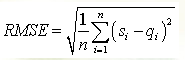
In PLCC and RMSE calculations, si represents the subjective quality of the i-th image, and qi is the objective quality after mapping. Before calculating PLCC and RMSE, the objective quality xi of the i-th image needs to be non-linearly mapped to qi. The mapping method is as follows:
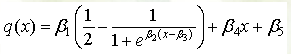
beta_i is the parameter to be fitted.
In addition to the above four evaluation methods, the researcher can also draw the subjective score of each distorted image in the data set and the scatter plot corresponding to the objective score and the fitted curve. The figure below is a scatter plot of the TID2008 data set using FSIM objective evaluation indicators and VIF objective evaluation indicators.

In the following articles, some mainstream FR IQA algorithms will be introduced one after another.
reference
https://sse.tongji.edu.cn/linzhang/IQA/IQA.htm
If you are interested, please follow the WeChat public account Video Coding