Preface
In the microservice architecture, a request often involves multiple modules, multiple middleware, and multiple machines to complete the collaboration. In this series of call requests, some are serial and some are parallel. How to determine which applications, which modules, which nodes and the order of calling are called behind this request? How to locate the performance problem of each module? This article will reveal the answer for you.
This article will explain from the following aspects
-
Principle and function of distributed tracking system
-
Principle and architecture design of SkyWalking
-
Our company's practice on the distributed call chain
The principle and function of distributed tracking system
How to measure the performance of an interface, generally we will pay attention to at least the following three indicators
-
How do you know the RT of the interface?
-
Is there an abnormal response?
-
Where is the main slow?
Monolithic architecture
In the early days, when the company just started, it may adopt the following monolithic architecture. For the monolithic architecture, what method should we use to calculate the above three indicators?

The easiest thing to think of is obviously to use AOP

Use AOP to print out the time before and after calling specific business logic to calculate the overall call time. Use AOP to catch the exception, and you can also know where the call caused the exception.
Microservice architecture
In the monolithic architecture, since all services and components are on the same machine, these monitoring indicators are relatively easy to implement. However, with the rapid development of business, the monolithic architecture will inevitably develop towards a microservice architecture, as follows

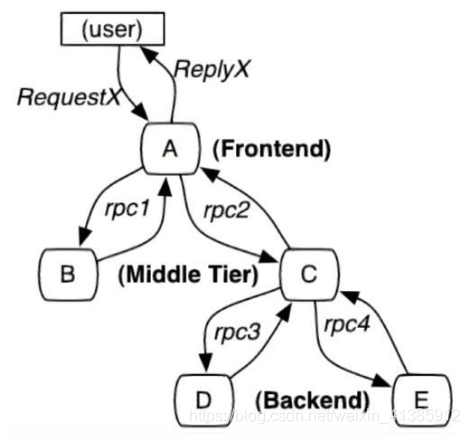
As shown in the picture: a slightly more complex microservice architecture
If some users report that a page is slow, we know that the request call chain for this page is A -----> C -----> B -----> D, how to locate which module may be at this time The problem caused. Each service Service A, B, C, D has several machines. How do you know which machine a certain request calls the service?

It can be clearly seen that due to the inability to accurately locate the exact path that each request passes, there are several pain points under the microservice architecture
-
Difficulty in troubleshooting and long cycle
-
Hard to reproduce specific scenes
-
System performance bottleneck analysis is difficult
The distributed call chain was born to solve the above problems, and its main functions are as follows
-
Automatically take data
-
Analyze data to generate a complete call chain : With a complete call chain of the request, the problem has a high probability of recurring
-
Data visualization: The performance visualization of each component can help us locate the bottleneck of the system and find out the problem in time
Through the distributed tracking system, each specific request link of the following requests can be well located, so that request link tracking can be easily realized, and the performance bottleneck of each module can be located and analyzed.
Distributed call chain standard-OpenTracing
Knowing the role of the distributed call chain, let's look at how to implement the implementation and principle of the distributed call chain. First, in order to solve the incompatibility of different distributed tracing system APIs, the OpenTracing specification was born. OpenTracing is a lightweight Level of standardization layer, which lies between the application/class library and the tracking or log analysis program.
 In this way, OpenTracing provides platform-independent and vendor-independent APIs so that developers can easily add the implementation of the tracking system.
Speaking of this, have you thought about a similar implementation in Java? Remember JDBC. By providing a set of standard interfaces for various vendors to implement, programmers can face interface programming without worrying about the specific implementation. The interface here is actually a standard, so it is very important to develop a set of standards to enable pluggable components.

Next we look at the OpenTracing data model, there are mainly the following three
-
Trace : a complete request link
-
Span : Call the process once (start time and end time are required)
-
SpanContext : Trace global context information, such as traceId
It is very important to understand these three concepts. In order to let everyone better understand these three concepts, I specially drew a picture
As shown in the figure, the complete request of an order is a complete trace. Obviously, for this request, there must be a global identifier to identify this request. Each call is called a Span, and each call must be brought. Global TraceId, so that the global TraceId can be associated with each call. This TraceId is transmitted through the SpanContext. Since it is to be transmitted, it is obvious that the call must follow the protocol. As shown in the figure, we compare the transmission protocol to a car, SpanContext to goods, and Span to roads. It should be better to understand.
After understanding these three concepts, let me see how the distributed tracking system collects the microservice call chain in the unified graph

We can see that there is a Collector at the bottom layer that has been collecting data in obscurity, so what information will be collected every time Collector is called.
-
Global trace_id: This is obvious, so that each sub-call can be associated with the original request
-
span_id: 0, 1, 1.1, 2 in the figure, so you can identify which call
-
parent_span_id: For example, the span_id of b calling d is 1.1, then its parent_span_id is the span_id of a calling b, which is 1, so that the two adjacent calls can be associated.
With this information, the information collected by Collector for each call is as follows

According to these chart information, it is obvious that the visual view of the call chain can be drawn as follows

So a complete distributed tracking system is realized.
The above implementation looks really simple, but there are several issues that require us to think carefully
-
How to automatically collect span data: automatic collection, no invasion of business code
-
How to transfer context across processes
-
How to ensure the global uniqueness of traceId
-
Will so many requests affect performance?
Next, let me see how SkyWalking solves the above four problems
Principle and architecture design of SkyWalking
How to automatically collect span data
SkyWalking adopts the form of plug-in + javaagent to realize the automatic collection of span data, so that it can be non-invasive to the code . Plug-in means pluggability and good extensibility (the following article will introduce how to define your own plug-in )

How to transfer context across processes
We know that data is generally divided into header and body, just like http has header and body, RocketMQ also has MessageHeader, Message Body, body generally contains business data, so it is not suitable to pass context in body, but should pass context in header, as shown in the figure
 The attachment in dubbo is equivalent to the header, so we put the context in the attachment, which solves the context transfer problem.
 Tips: The context transfer process here is handled in the dubbo plugin, and there is no business perception. How this plugin is implemented, I will analyze it below
How to ensure the global uniqueness of traceId
To ensure global uniqueness, we can use distributed or locally generated IDs. If you use distributed IDs, you need to have a sender. Every time you request, you must first request the sender. There will be a network call overhead, so SkyWalking will eventually It adopts the method of generating ID locally, and it uses the famous snowflow algorithm, which has high performance.
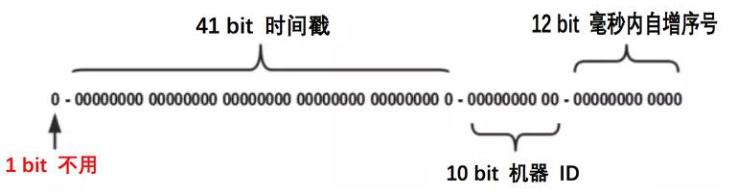
Illustration: id generated by snowflake algorithm
However, the snowflake algorithm has a well-known problem: time callback , which may cause duplicate id generation. So how does SkyWalking solve the time callback problem?
 Every time an id is generated, the time when the id was generated (lastTimestamp) will be recorded. If the current time is found to be smaller than the time when the id was last generated (lastTimestamp), it means that a time callback has occurred, and a random number will be generated as traceId. There may be students who want to be more real here, and they may feel that the generated random number will also be the same as the generated global id. It would be better if you add another layer of verification.
Here I want to talk about the choice of system design. First of all, if the uniqueness of the generated random number is checked, there will undoubtedly be an additional layer of calls, and there will be a certain performance loss, but in fact, the probability of time callbacks is very small. (Due to the disorder of the machine time after the occurrence, the business will be greatly affected, so the adjustment of the machine time must be cautious), plus the probability of the generated random number overlapping is also very small, and there is indeed no need to add one here. Layer global uniqueness check. For the selection of technical solutions, we must avoid over-designing.
With so many requests, will all collection affect performance?
If you call for each request to collect, then there is no doubt that the amount of data will be very large, but in turn, think about whether it is really necessary to collect for each request. In fact, it is not necessary. We can set the sampling frequency and only sample For part of the data, SkyWalking defaults to sampling 3 times in 3 seconds, and other requests are not sampled, as shown in the figure
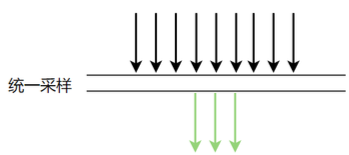
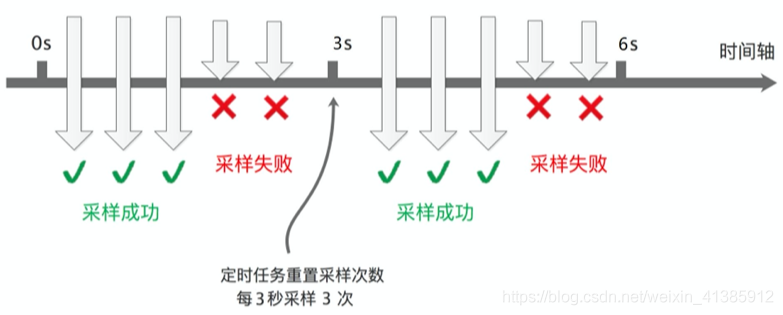 This sampling frequency is actually enough for us to analyze the performance of the component. What problems will there be when sampling data at a frequency of sampling three times in 3 seconds? Ideally, each service call is at the same time point (as shown below), so it’s okay to sample at the same time point every time.
 However, in production, it is basically impossible for each service call to be called at the same point in time, because there is a network call delay during the period, and the actual call situation is likely to be like the following figure
 In this case, some calls will be sampled on service A, but will not be sampled on services B and C, and it is impossible to analyze the performance of the call chain. So how does SkyWalking solve it?
It is solved like this: if the upstream has brought the Context (indicating that the upstream is sampling), the downstream is forced to collect data. This can ensure the integrity of the link.
SkyWalking's infrastructure
The basic structure of SkyWalking is as follows. It can be said that almost all distributed calls are composed of the following components
 First of all, of course, the regular sampling of node data. After sampling, the data is reported regularly and stored in the persistence layer such as ES and MySQL. With the data, it is natural to perform visual analysis based on the data.
How does SkyWalking perform
Next, everyone is definitely concerned about the performance of SkyWalking, then let’s take a look at the official evaluation data

The blue in the figure represents the performance without SkyWalking, and the orange represents the performance with SkyWalking. The above data is measured with a TPS of 5000. It can be seen that whether it is CPU, memory, or response time, use SkyWalking with The performance loss that comes is almost negligible.
Next, let’s look at the comparison between SkyWalking and Zipkin, Pinpoint, another well-known distributed tracking tool in the industry (comparison with one sampling rate per second, 500 threads, and 5000 total requests). It can be seen that Zipkin (117ms) and PinPoint (201ms) are far inferior to SkyWalking (22ms) in terms of critical response time !
From the performance loss index, SkyWalking has won!
Another look at the indicator: how code invasive, requires Zipkin buried in the application point, strong invasion of the code, using the SkyWalking javaagent + widget of such modifications bytecode ways to do for There is no code intrusion . In addition to the performance and intrusiveness of the code, SkyWaking performs well, it also has the following advantages
-
Multi-language support, rich components: currently it supports Java, .Net Core, PHP, NodeJS, Golang, LUA languages, and the components also support common components such as dubbo, mysql, and most of them can meet our needs.
-
Extensibility: For unsatisfied plug-ins, we can manually write one according to SkyWalking's rules, and the newly implemented plug-ins will not invade the code.
Our company's practice on the distributed call chain
SkyWalking's application framework in our company
From the above, we can see that SkyWalking has many advantages, so have we used all of its components? In fact, it is not. Let’s take a look at its application architecture in our company.

It can be seen from the figure that we only use SkyWalking's agent for sampling, and abandon the other three components of "data reporting and analysis", "data storage", and "data visualization", so why not directly use the entire set of SkyWalking The solution, because our Marvin monitoring ecosystem was relatively complete before we connected to SkyWalking. If we replace it with SkyWalking, it is not necessary. Marvin can meet our needs in most scenarios. The cost of system replacement is high, and thirdly, the cost of learning for users is very high if they re-connect.
This also gives us a revelation: it is important for any product to seize the opportunity, and the replacement cost of subsequent products will be high. Seizing the first opportunity means seizing the user’s mind. This is like WeChat. Although the UI is well-made, it is Whatsapp can't be done in foreign countries, because the first opportunity is gone.
On the other hand, for architecture, there is no best, but the most suitable. The essence of architecture design is to balance the trade-offs with current business scenarios.
What transformations and practices our company has made to SkyWalking
Our company mainly made the following transformations and practices
-
Pre-release environment requires mandatory sampling due to debugging
-
Achieve more fine-grained sampling?
-
Embedded traceId in the log
-
Self-developed implementation of SkyWalking plug-in
Pre-release environment requires mandatory sampling due to debugging
From the above analysis, we can see that Collector is sampling regularly in the background. Isn't that good? Why do we need to implement forced sampling? It is also to troubleshoot positioning problems. Sometimes there are problems online. We hope to reproduce it on pre-release and hope to see the complete call chain of this request. Therefore, it is necessary to implement forced sampling on pre-release. So we modified the dubbo plug-in of Skywalking to implement forced sampling
We put a key-value pair like force_flag = true on the requested cookie to indicate that we want to force sampling. After the gateway receives this cookie, it will put force_flag = true this key-value pair in the dubbo attachment, and then The dubbo plug-in of skywalking can judge whether it is forced sampling based on this. If there is this value, it means forced sampling. If there is no such value, it will take normal timing sampling.

Achieve more fine-grained sampling?
Hah called more fine-grained sampling. First look at the default sampling method of skywalking, namely unified sampling
 We know that this method defaults to 3 times before sampling in 3 seconds, and all other requests are discarded. In this case, there is a problem. Assume that there are multiple dubbo, mysql, redis calls within 3 seconds on this machine, but if the first three times If they are all dubbo calls, other calls like mysql, redis, etc. cannot be sampled, so we modified skywalking to achieve group sampling, as follows
 In other words, 3 samples of redis, dubbo, mysql, etc. are performed in 3 seconds, which avoids this problem
How to embed traceId in the log?
The traceId embedded in the output log is convenient for us to troubleshoot, so it is very necessary to type the traceId. How to embed the traceId in the log? We are using log4j. Here we need to understand the log4j plug-in mechanism. Log4j allows us to customize the plug-in to output the log format. First, we need to define the log format and embed %traceId in the custom log format as the account Placeholder, as follows

Then we implement a log4j plug-in, as follows
 First, the log4j plug-in must define a class that inherits the LogEventPatternConverter class and declares itself as a Plugin with the standard Plugin. The placeholder to be replaced is specified through the @ConverterKeys annotation, and then replaced in the format method. Drop. In this way, the TraceId we want will appear in the log, as follows

Which skywalking plugins have been developed by our company
SkyWalking has implemented many plug-ins, but does not provide memcached and druid plug-ins, so we have self-developed these two plug-ins according to its specifications

How to implement the plug-in, you can see that it is mainly composed of three parts
-
Plug-in definition class: Specify the definition class of the plug-in. Finally, the plugin will be packaged and generated according to the definition class here
-
Instrumentation: Specify the aspect, the point of cut, which method of which class should be enhanced
-
Interceptor, specify step 2 to write enhanced logic in the front, back or exception of the method
Maybe you still don’t understand after reading it. Let’s briefly explain it with the dubbo plugin. We know that in the dubbo service, each request receives a message from netty and submits it to the business thread pool for processing, and then the actual call to the end of the business method. After more than a dozen Filter processing in the middle
 The MonitorFilter can intercept all client requests or server-side processing requests, so we can enhance the MonitorFilter, before calling the invoke method, inject the global traceId into the attachment of its Invocation, so as to ensure that the request reaches the real The global traceId already exists before the business logic.
So obviously we need to specify the class we want to enhance (MonitorFilter) in the plug-in, and enhance its method (invoke). What enhancements should be made to this method? This is what the interceptor (Inteceptor) does, let’s take a look Instrumentation in Dubbo plug-in (DubboInstrumentation)

Let's take a look at what the Inteceptor described in the code does. The key steps are listed below

First of all, beforeMethod means that the method will be called before the invoke method of MonitorFilter is executed, and the corresponding is afterMethod, which means the enhancement logic will be made after the invoke method is executed.
Secondly, we can see from points 2 and 3 that both the consumer and the provider have processed their global ID accordingly, so as to ensure that the global traceid is guaranteed when reaching the real business layer. After the Instrumentation and Interceptor are defined , The last step is to specify the defined class in skywalking.def
// skywalking-plugin.def 文件
dubbo=org.apache.skywalking.apm.plugin.asf.dubbo.DubboInstrumentation
The packaged plug-in will enhance MonitorFilter's invoke method, and perform operations such as injecting global traceId into the period attachment before the invoke method is executed. All of these are silent and non-intrusive to the code .
to sum up
This article introduces the principle of the distributed tracking system from the shallower to the deeper. I believe that everyone has a deeper understanding of its function and working mechanism. It is particularly important to note that the introduction of a certain technique must be combined with the existing technical architecture to make the best A reasonable choice. Just like SkyWalking has four modules, our company only uses its agent sampling function. There is no best technology, only the most suitable technology . Through this article, I believe everyone should have a clearer understanding of the implementation mechanism of SkyWalking. The article only introduces the plug-in implementation of SkyWalking, but it is industrial-grade software after all. To understand its extensiveness and depth, you must read more source code.
If you think this article is helpful to you, you can like it and follow it to support it, or you can follow my public account. There are more technical dry goods articles and related information sharing on it, everyone learns and progresses together!
