Matlab notes updated irregularly
-
- slice: three-dimensional volume slice plane
- Difference between color map and true color
- **Modify the appearance of the surface map**
- Set color shading properties
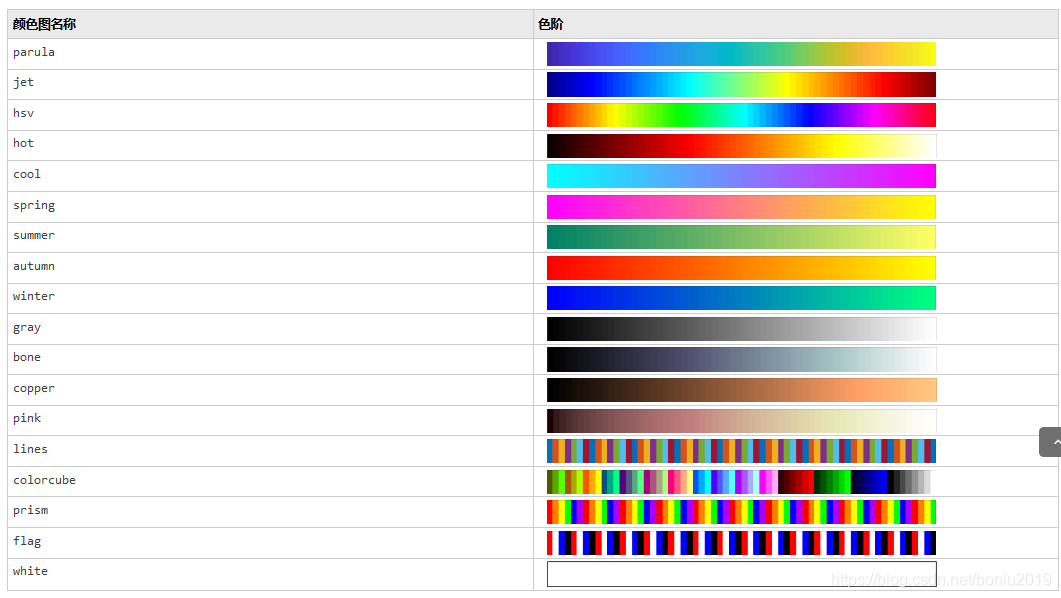
- colormap
- [Axes properties (appearance and behavior of axes)](https://ww2.mathworks.cn/help/matlab/ref/matlab.graphics.axis.axes-properties.html)
- scatter3 three-dimensional scatter plot
- Color & shape of drawing points
- Matlab new font storage directory
- Export picture settings
- shading
- Create notes
slice: three-dimensional volume slice plane
语法
slice(X,Y,Z,V,xslice,yslice,zslice)
slice(V,xslice,yslice,zslice)
slice(___,method)
slice(ax,___)
s = slice(___)
Explain that
slice(X,Y,Z,V,xslice,yslice,zslice) draws slices for three-dimensional volume data V. Specify X, Y, and Z as coordinate data. Use one of the following forms to specify xslice, yslice, and zslice as the slice position:
To draw one or more slice planes orthogonal to a specific axis, specify the slice parameter as a scalar or vector.
To draw a single slice along a surface, specify all slice parameters as a matrix that defines the surface.
slice(V,xslice,yslice,zslice) uses V's default coordinate data. The (x,y,z) position of each element in V is based on the column, row, and page index, respectively.
Example
slice(___,method) specifies the interpolation method, where method can be'linear' (default),'cubic' or'nearest'. You can use this option with any input parameter in the above syntax.
slice(ax,___) draws in the specified axes instead of the current axes (gca).
s = slice(___) returns the created Surface object. slice returns a Surface object for each slice.
Difference between color map and true color
Link: Difference between color map and true color
Modify the appearance of surface plots
Create a semi-transparent surface by specifying the value of the FaceAlpha name-value pair as 0.5. To allow further modification, assign the surface object to the variable s.
[X, Y] = meshgrid (-5: .5: 5);
Z = Y. * sin (X) - X. * cos (Y);
s = surf (X, Y, Z, 'FaceAlpha', 0.5)
Set color shading properties
shading
Syntax:
shading Flat
shading Faceted
shading interp
shading (axes_handle, ...)
described
shading function of the control surface and color of the colored patch graphic object.
Shading flat (de-grid) Each grid line segment and surface has a constant color, which is determined by the color value with the smallest index at the end of the line segment or the corner edge of the surface.
shading faceted A single shading with superimposed black grid lines. This is the default shading mode.
shading interp changes the color in each line or surface by interpolating the color map index or true color value in that line or surface.
shading(axes_handle,…) applies the shading type to the axes specified by axes_handle instead of the objects in the current axes. When using the function form, you can use single quotes. For example:
shading(gca,'interp')
colormap
View and set the current color map
description
colormap map Set the color map of the current figure to one of the predefined color maps. If you set a color map for the figure, the axes and the map in the figure will use the same color map. The length (number of colors) of the new color map is the same as the current color map. When you use this syntax, you cannot specify a custom length for the colormap. For more information about color maps, see What is a color map? .
colormap(map) sets the color map of the current figure to the color map specified by map.
colormap(target,map) sets the color map for the figure, axes, or graphics specified by target, instead of setting the color map for the current figure.
cmap = colormap returns the color map of the current figure, in the form of a three-column matrix composed of RGB triples.
cmap = colormap(target) returns the color map of the figure, axes or graph specified by target.
Axes properties (appearance and behavior of axes)
TickDir-Tick mark direction'in
' (default) |'out' |'both'
Tick mark direction, specified as one of the following values:
'in' - 刻度线从轴线指向内部。(二维视图的默认值)

'out' - 刻度线从轴线指向外部。(三维视图的默认值)

'both' - 刻度线以轴线为中心。
ax.TickDir = 'out' %示例:
scatter3 three-dimensional scatter plot
scatter3(X,Y,Z) displays a circle at the position specified by the vectors X, Y, and Z.
Example
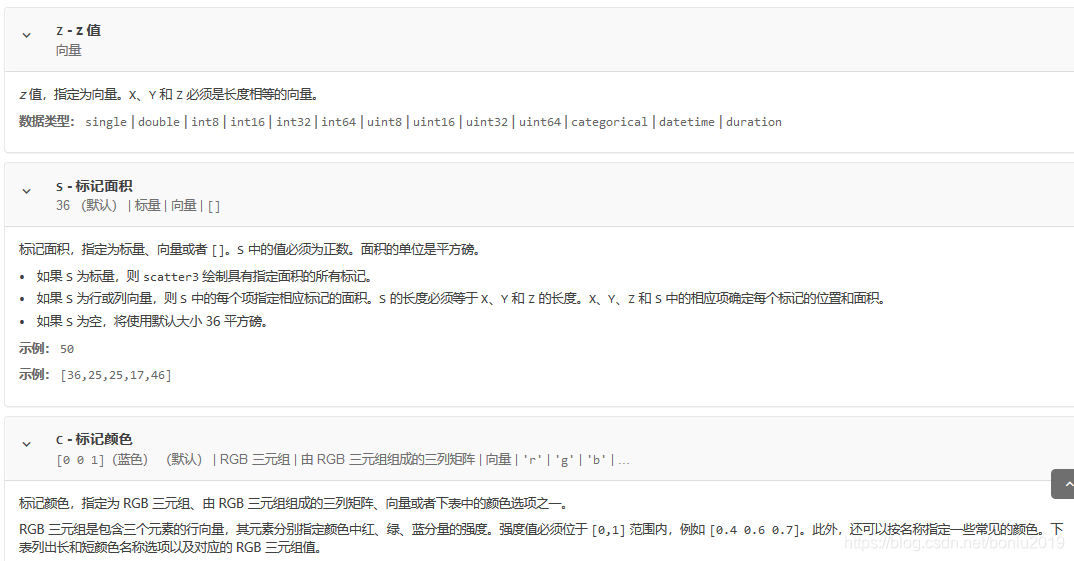
scatter3(X,Y,Z,S) draws each circle using the size specified by S. To draw circles of equal size, specify S as a scalar. To draw each circle of a certain size, specify S as a vector.
Example
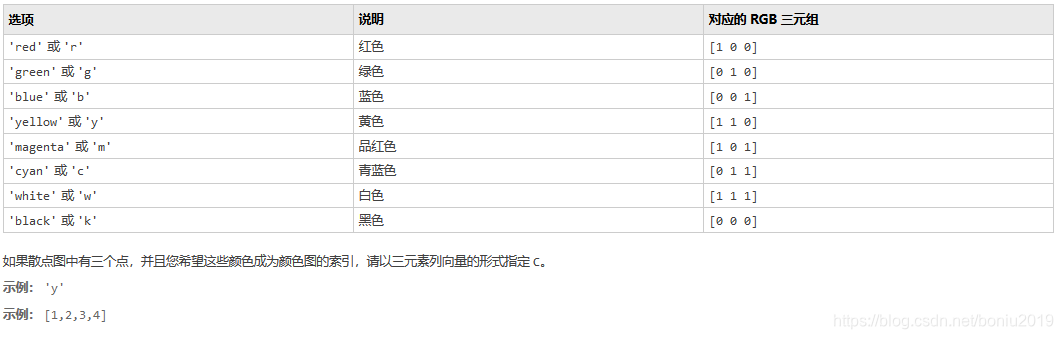
scatter3(X,Y,Z,S,C) uses the color specified by C to draw each circle.
如果 C 是 RGB 三元组,或者是包含颜色名称的字符向量或字符串,则使用指定的颜色绘制所有圆圈。

如果 C 是一个三列矩阵,其中 C 中的行数等于 X、Y 和 Z 的长度,则 C 的每行指定相应圆圈的 RGB 颜色值。

如果 C 是长度与 X、Y 和 Z 的长度相同的向量,则 C 中的值线性映射到当前颜色图中的颜色。
scatter3(___,'filled') fills these circles using any combination of input parameters in the previous syntax.
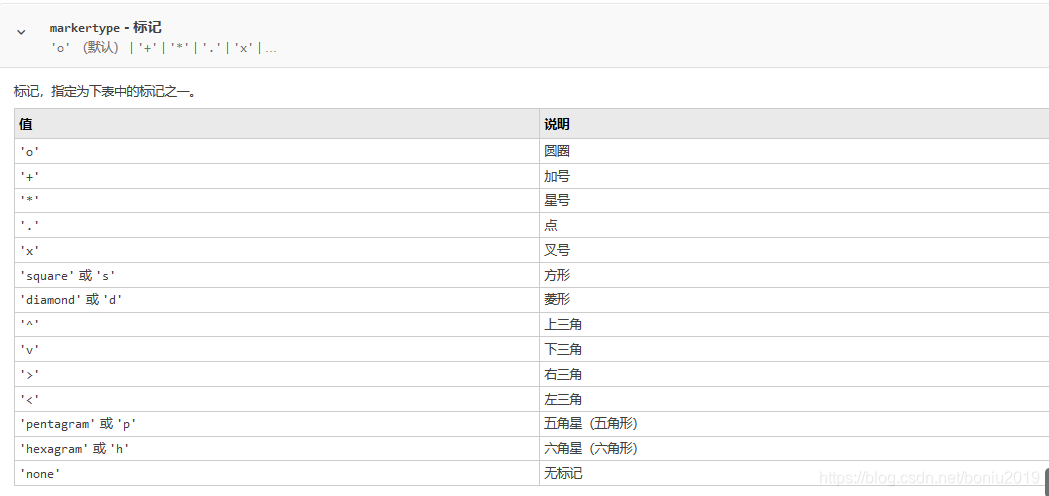
scatter3(___,markertype) specifies the marker type.
scatter3(___,Name,Value) uses one or more name-value pair parameters to modify the scatter plot.
scatter3(ax,___) draws the graph to the axes specified by ax instead of the current axes (gca). The option ax can precede any combination of input parameters in the preceding syntax.
h = scatter3(___) returns the Scatter object. After creating a scatter chart, you can use h to modify its properties.
Color & shape of drawing points
Matlab new font storage directory
F:\ProgramFile\matlab\sys\java\jre\win64\jre\lib\fonts
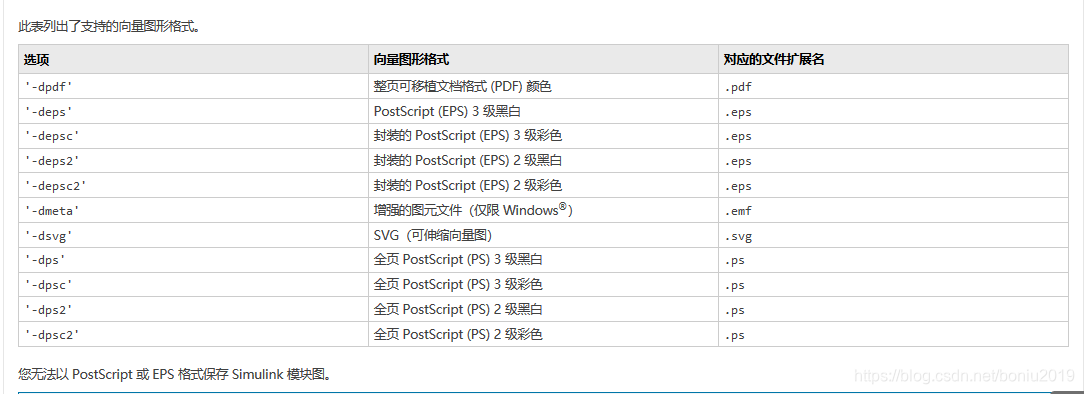
Export picture settings
Link: Portal
shading
shading interp;% interpolation makes the color smooth
a=randn(10);
pcolor(a)
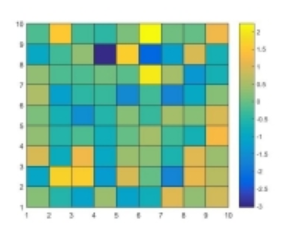
shading interp %shading interp后

shading flat; % ****** 去网格化