Note in some images, and video codes from the B station PPT teacher Guo Yanfu
Advanced Drawing
Advanced 2D drawing (important function instruction)
- FIG logarithm plot of the number of
- plotyy
- histogram chart (overall)
- bar charts charts (individual)
- pie charts pie charts
- ploar chart (similar to the polar diagram)
- stairs and stem charts
- boxplot and error bar
- fill color fill and text
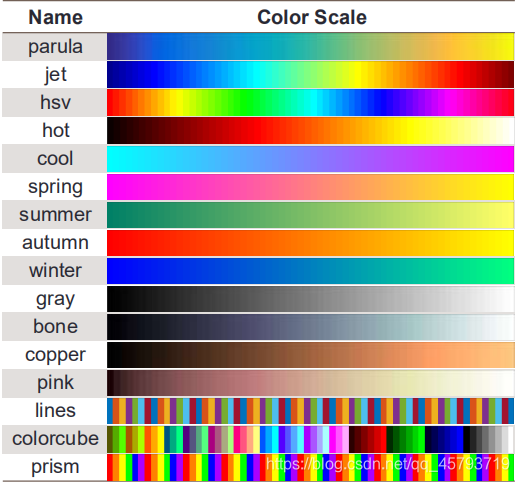
Match colors
- imagesc
- colorbar
- colormap
3D mapping function
-
plot3(x,y,z)
-
3D surface plot:
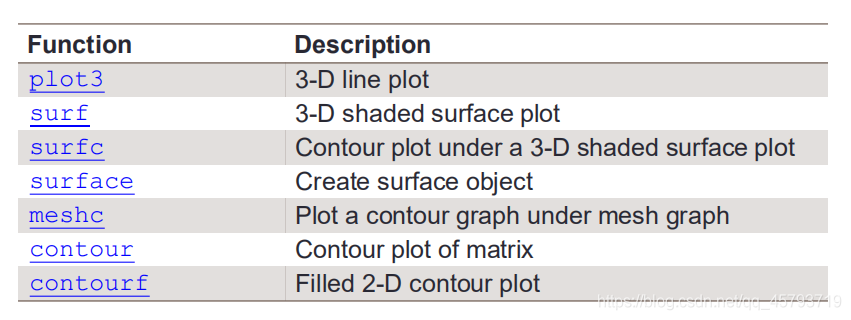
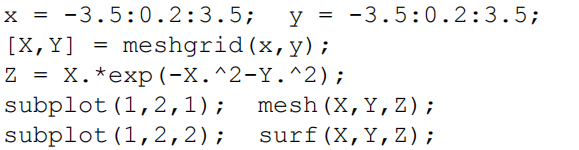
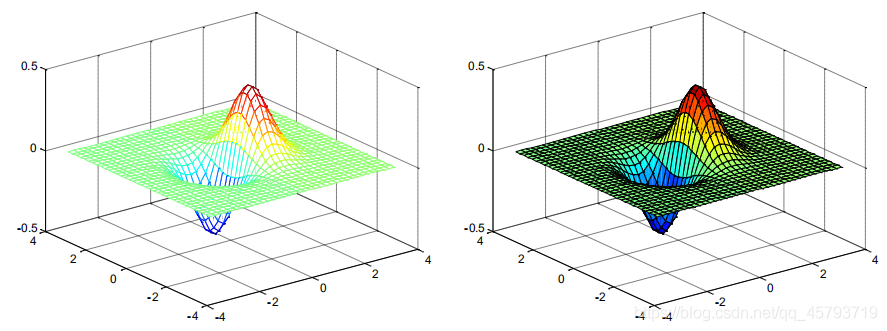
1 meshgrid()
2 mash()和surf()
3 contour()
4 meshc() 和surfc()
5view()
6light()
7patch()
1.1 pairs logarithmic plot
semilogx (x, y): x-axis the logarithm
loglog (x, y): xy axes are logarithmic
set (gca, 'XGrid', 'on'); plus mesh
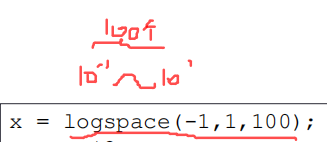
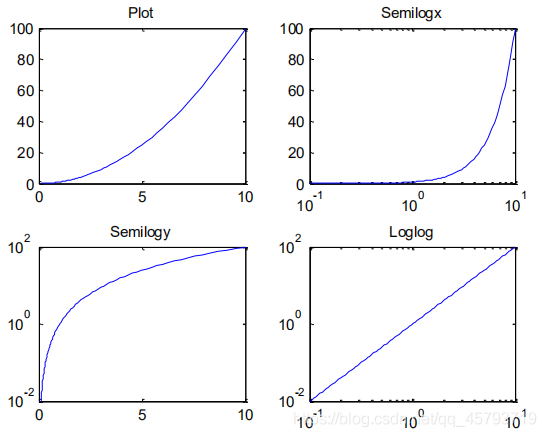
x=logspace(-1,1,100);
y=x.^2;
subplot(2,2,1); plot(x,y);title(‘Plot’);
subplot(2,2,2); semilogx(x,y);title(‘Semilogx’);
subplot(2,2,3); semilogy(x,y);title(‘Semilogy’);
subplot(2,2,4); loglog(x,y);title(‘LogLog’);
1.2
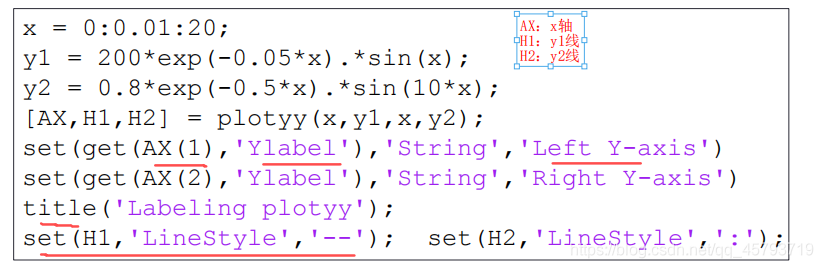
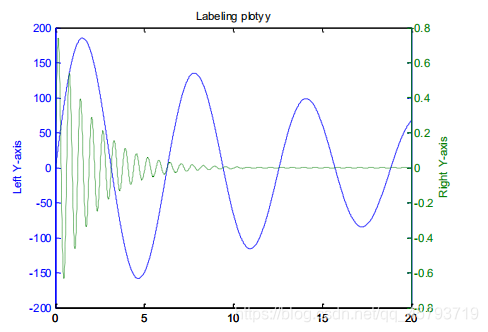
plotyy ()
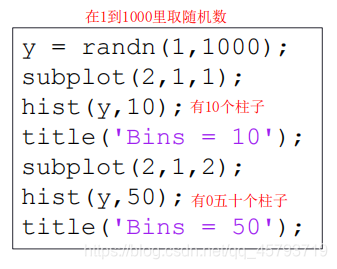
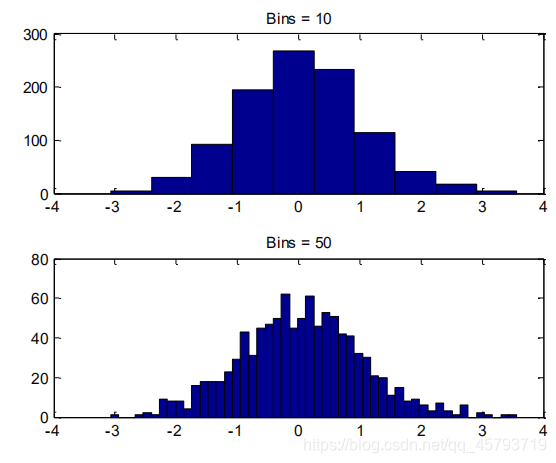
1.3histogram
hist(x,n)
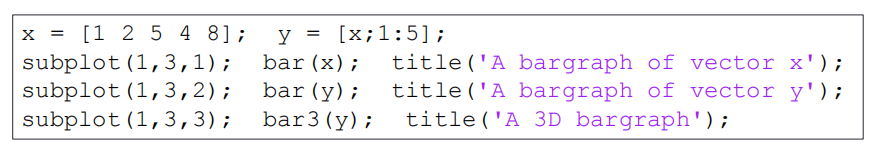
1.4
- bar (y)
- bar3 (y)
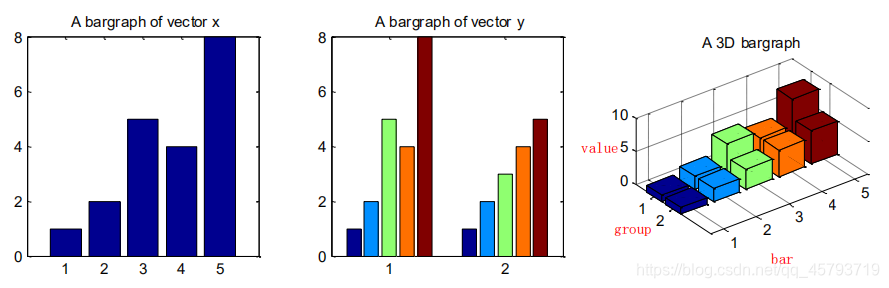
bar (y, 'stacked') ; stacked
barh (y); sideways

x=[1 2 5 4 8];
y=[x;1:5];
barh(y,‘stacked’);
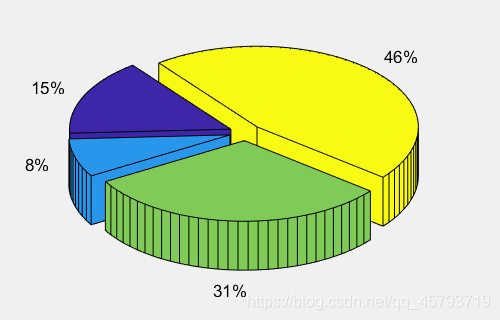
Pie chart 1.5
- pie();
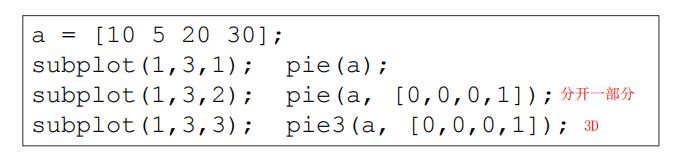
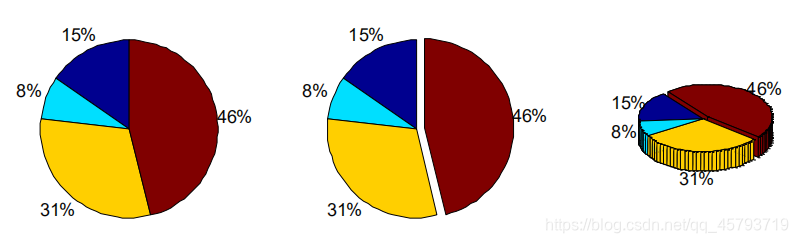

a = [May 10 20 30];
pie3 (a, [1,1,1,1]);
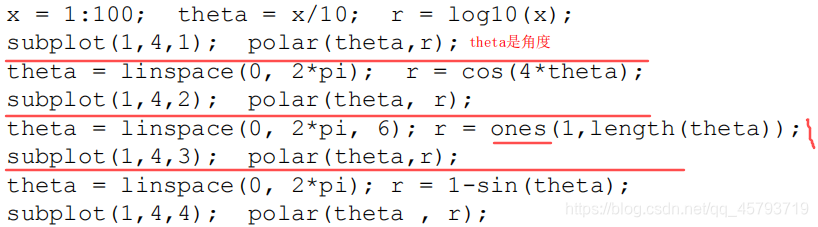
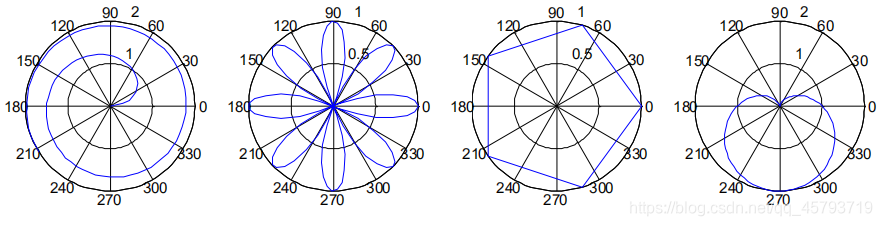
1.6
- polar (theta, r); where theta is the angle, r is the radius of
- stairs(y)
- stem (s)
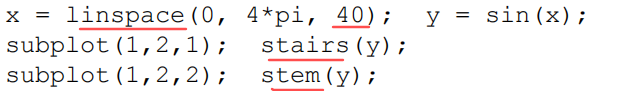
doubt?
1.7
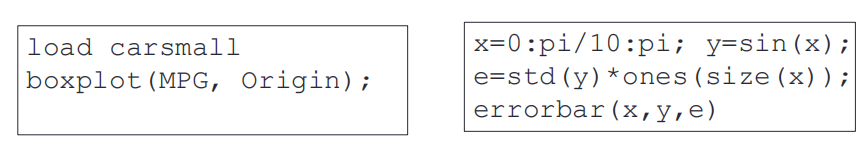
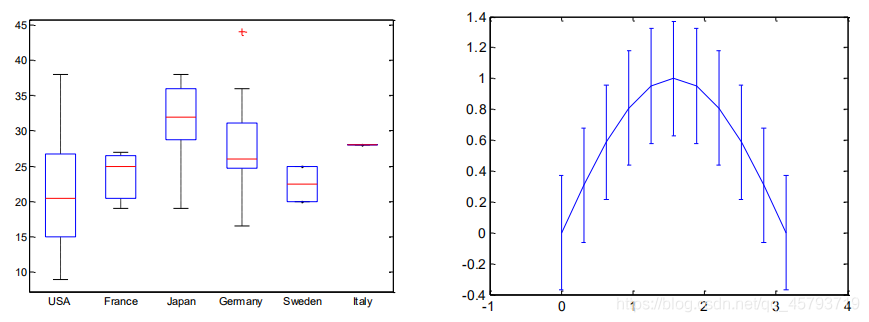
- boxplot(x,y)
- errorbar (x, y, e) where e is the error section
1.8
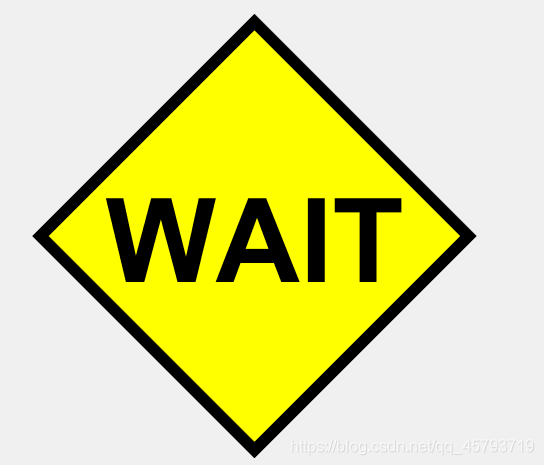
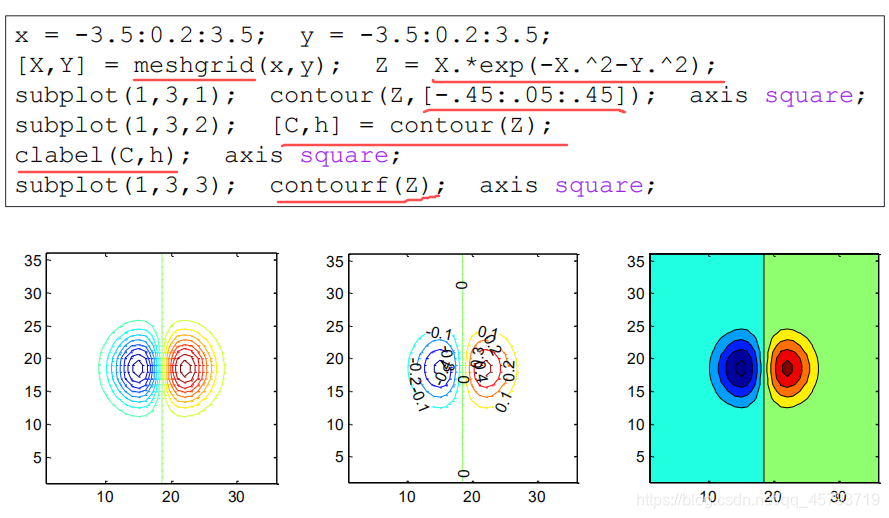
- fill()
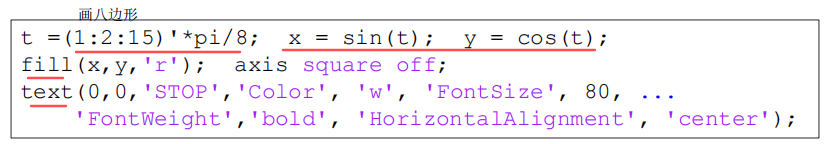
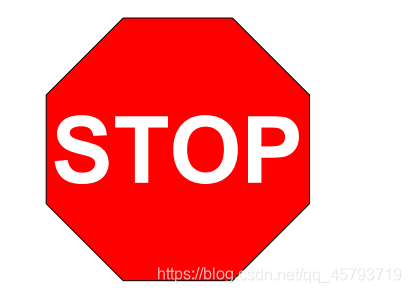
t=linspace(0,2*pi,5);
x=sin(t);
y=cos(t);
h=fill(x,y,‘y’);axis square off;
set(h,‘linewidth’,7);
text(0,0,‘WAIT’,‘Color’,‘k’,‘FontSize’,70,…
‘FontWeight’,‘bold’,‘HorizontalAlignment’,‘center’);
2.0
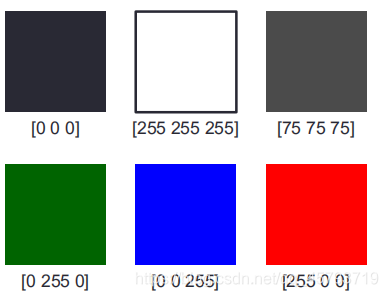
[the RGB]
255 corresponding to the FF
2.1
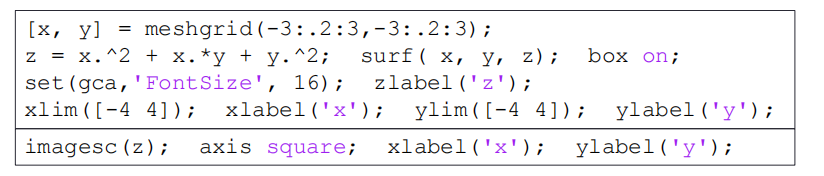
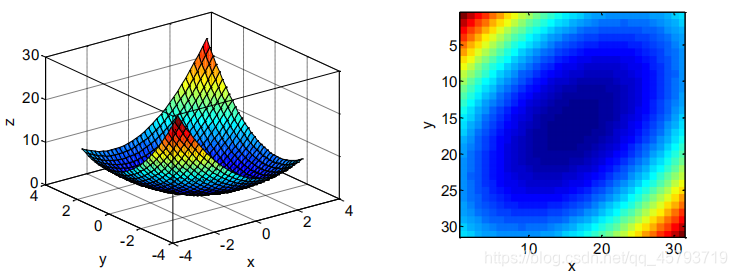
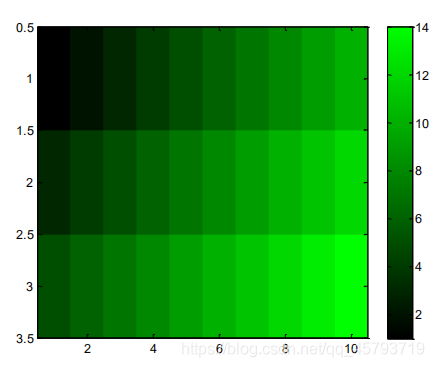
- the imagesc () indicates color value
2.2
- the colorbar () displays a color numerical value corresponding to the next article in the axis
- colormap (Name) value corresponds to the color change
x=[1:10;3:12;5:14];
imagesc(x);
colorbar;
map=zeros(256,3);
map(:,2)=(0:255)/255;
colormap(map);
3.0
3.1
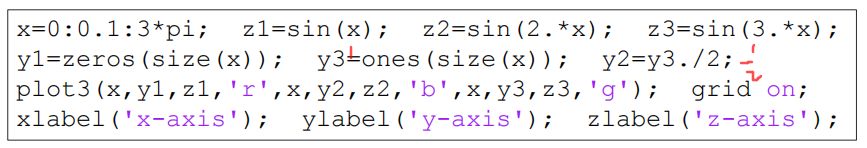
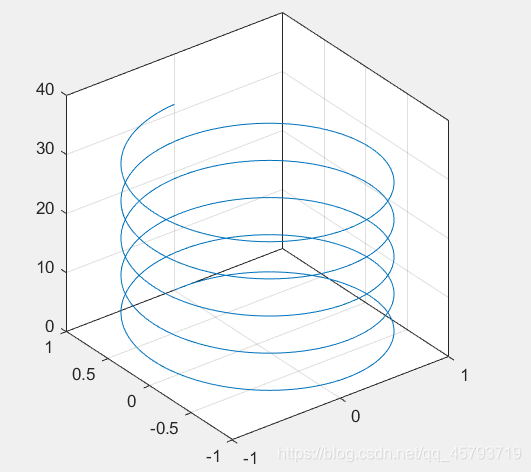
- plot3(x,y,z)
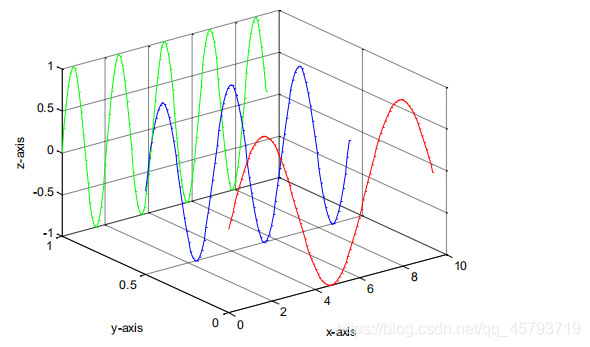
t=0:pi/50:10*pi;
plot3(sin(t),cos(t),t);
grid on;axis square;box on
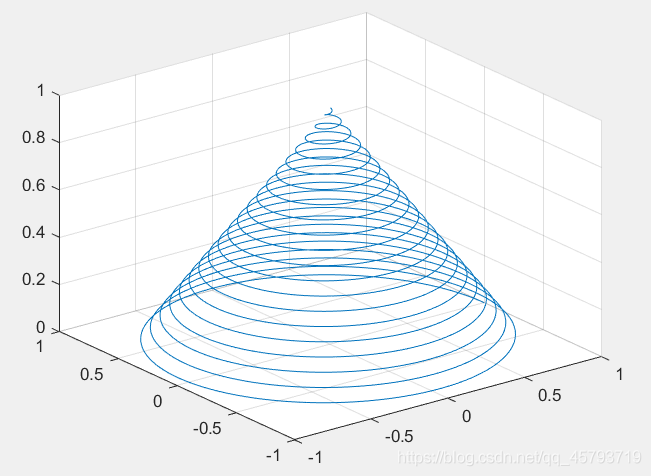
turns=40pi;
t=linspace(0,turns,4000);
x=cos(t).(turns-t)./turns;
y=sin(t).*(turns-t)./turns;
z=t./turns;
plot3(x,y,z);
grid on;
3.2
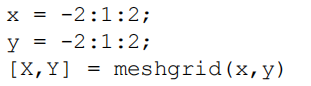
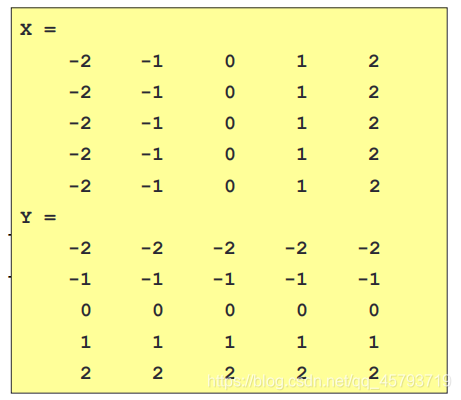
- [X,Y]=meshgrid(x,y) 使用这个函数可以得到两个有对应点的矩阵
3.3
- mesh()没有小格子和surf()有小格子
3.4
- contour()有点类似于投影,让3D变成2D
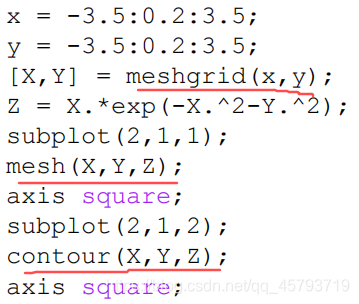
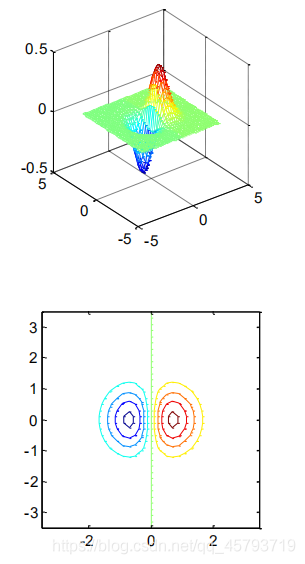
有一页看不懂
3.5
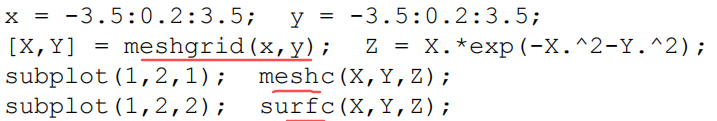
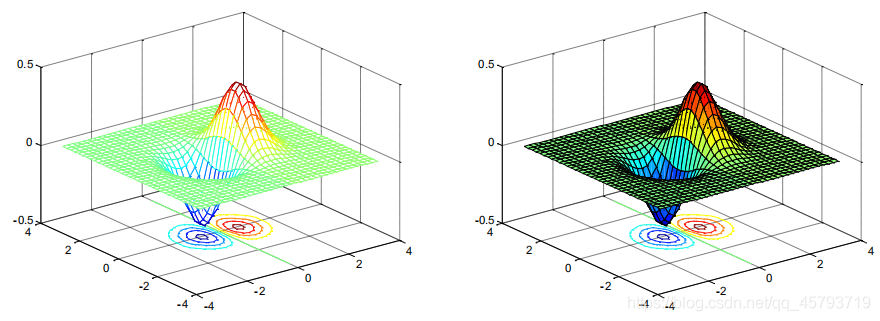
- meshc()和surfc()
- 3D加2D
3.6
- view(x,y)
- x,y是想看的角度
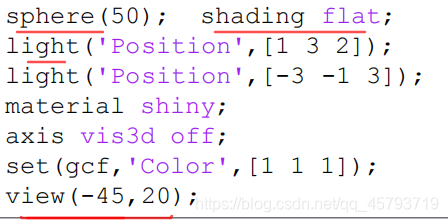
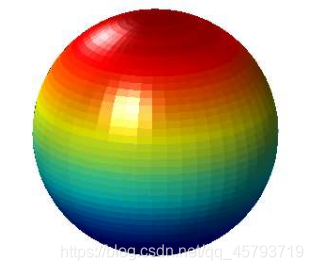
- [X,Y,Z]=sphere(30),其中参数30表示球面沿着经度、纬度方向被分成的面片数。
- shading 设置颜色着色属性
- shading flat 每个网格线段和面具有恒定颜色,该颜色由该线段的端点或该面的角边处具有最小索引的颜色值确定。
- material就是让做出的表面图有质地感,包括亮度,暗度,金属感等等。
- material SHINY makes the objects shiny.
3.7
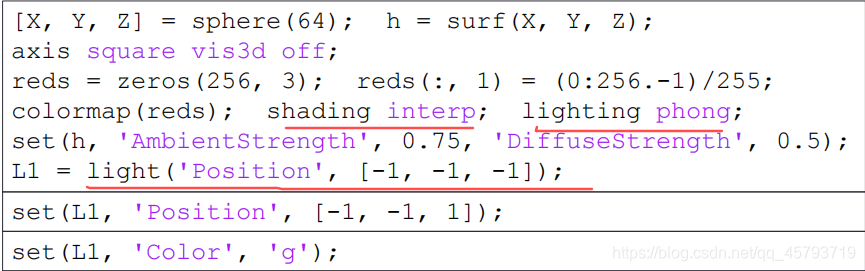
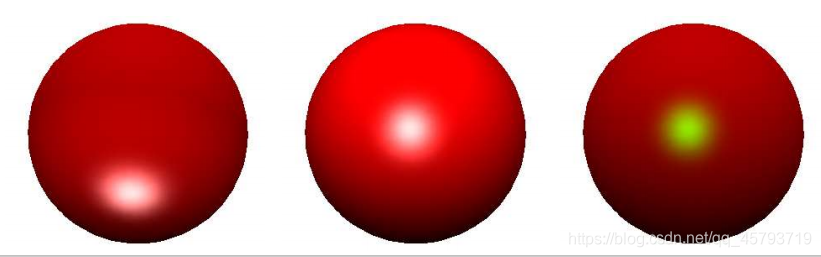
- light(‘position’,[ ])
- shading interp by interpolating lines of each color plane or FIG index or true color values to change the color of the line or plane.
3.8
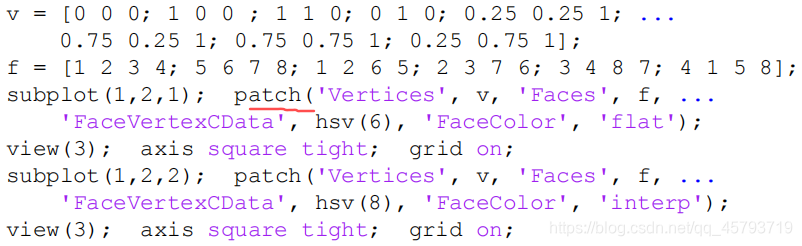
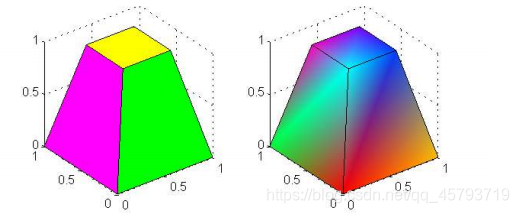
- patch () draw a polygon