The basic registration account of Tencent Maps and basic functions such as display maps are in the previous article of the column. If you are interested, you can take a look.
Today I’m going to talk about a slightly basic operation of Tencent Maps. Not much to say, let’s just jump into the code.
var marker = ref(null)
var map
var center = ref(null)
// 地图初始化
const initMap = () => {
    //定义地图中心点坐标
     center.value = new TMap.LatLng(30.589184, 114.29689)
    //定义map变量,调用 TMap.Map() 构造函数创建地图

     map = new TMap.Map(document.getElementById('container'), {
        center: center.value,//设置地图中心点坐标
        zoom: 6,   //设置地图缩放级别
        mapStyleId: 'style1', //设置地图样式
    });


    //创建并初始化MultiMarker
     marker = new TMap.MultiMarker({
        map: map,  //指定地图容器
        //样式定义
        styles: {
            //创建一个styleId为"myStyle"的样式(styles的子属性名即为styleId)
            //将不同的作物指定为不同的样式
            myStyleOne: new TMap.MarkerStyle({
               "width": 25,
                "height": 35,
                 "src": markImgOne,
                "anchor": { x: 16, y: 32 }
            }),
            myStyleTwo: new TMap.MarkerStyle({
                "width": 25,
                "height": 35,
                "src": markImgTwo,
                "anchor": { x: 16, y: 32 }
            }),
            myStyleThere: new TMap.MarkerStyle({
                "width": 25,
                "height": 35,
                "src": markImgThere,
                "anchor": { x: 16, y: 32 }
            }),
        },
        //点标记数据数组
        geometries: convertedPoints.value
     });
    console.log('坐标数据',convertedPoints.value);
    //初始化infoWindow
    var infoWindow = new TMap.InfoWindow({
        map: map,
        position: new TMap.LatLng(39.984104, 116.307503),
        offset: { x: 0, y: -32 } //设置信息窗相对position偏移像素,为了使其显示在Marker的上方
    });
    infoWindow.close();//初始关闭信息窗关闭
    //监听标注点击事件
    marker.on("click", function (evt) {
        if (iconClidk.value == true) {
            // console.log(evt, '点位点击信息');
            projectInfo.value = { id: '3', name: '湖北省公租房管理第三方评价项目 ·' + evt.geometry.properties.title, sonTask: evt.geometry.properties.num, problem: '1', headName: '王五', phone: "18337391968", }
        }
        //设置infoWindow
        // infoWindow.open(); //打开信息窗
        // infoWindow.setPosition(evt.geometry.position);//设置信息窗位置
        // //将信息与标记点关联起来
        // infoWindow.setContent(evt.geometry.properties.title);//设置信息窗内容
        // console.log(evt)
    })
    //移除控件缩放
    map.removeControl(TMap.constants.DEFAULT_CONTROL_ID.ZOOM);
    // 移除比例尺控件
    map.removeControl(TMap.constants.DEFAULT_CONTROL_ID.SCALE);
    // 移除旋转控件
    map.removeControl(TMap.constants.DEFAULT_CONTROL_ID.ROTATION);

}
Everyone seems to have no difficulty with this) (including point clicks and pop-up boxes). The important thing is the data processing when scattering points and the differentiated display of icon categories.

This is the data returned by the backend and is now processed into the desired format.
const getLocationAndStatusFn = () => {
let params = { projectId: projectId.value }
getLocationAndStatus(params).then(res => {
console.log(res, '获取各位置及状态');
if (res.code == 200 && res.data.length > 0) {
console.log(res,'点位信息');
positionArr.value = res.data
//点位数据
convertedPoints.value = positionArr.value.map(item => {
const [longitude, latitude] = item.position[0].split(',');
// 设置已超时 已完成 进行中图标样式
if (item.isOvertime == false) {
if (item.status == '0' || item.status == '1' || item.status == '2' || item.status == '3') {
styleIdValue.value = 'myStyleTwo'; // 根据status值设置样式
} else if (item.status == '4' || item.status == '5') {
styleIdValue.value = 'myStyleOne'; // 根据status值设置样式
}
} else {
styleIdValue.value = 'myStyleThere';
}
// if(item.)
return {
id: item.district_id,
styleId: styleIdValue.value, //这个用来区分显示不同的图标
position: new TMap.LatLng(parseFloat(latitude), parseFloat(longitude)),
properties: { //附带信息
title: item.name,
address: item.district,
taskId: item.taskId,
status: item.status
}
};
});
}
})
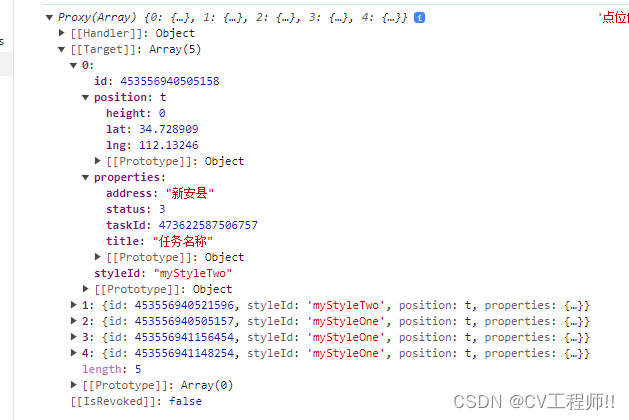
}The final processed format is like this
After processing the data, you can see that I defined 3 styles of pictures in the first code. When I first wrote it, the pictures could not be displayed. Only the default red icon of Tencent Maps was displayed. Finally, I found a solution.
// 地图点位图标
import markImgOne from '@/assets/visualization/icon/01.png';
import markImgTwo from '@/assets/visualization/icon/02.png';
import markImgThere from '@/assets/visualization/icon/03.png';
Your spot pictures must be imported before they can be used.
Finally, there is the method of setting the center point
//设置中心点城市
function setCenter(lat, lng, xiaoqu) {
map.setCenter(new TMap.LatLng(lat, lng))
if (xiaoqu == 1) {
//这个是设置地图的缩放层级
map.easeTo({ zoom: 12 }, { duration: 2000 })
} else if (xiaoqu == 0) {
map.easeTo({ zoom: 7 }, { duration: 2000 })
} else {
map.easeTo({ zoom: 17 }, { duration: 2000 })
}
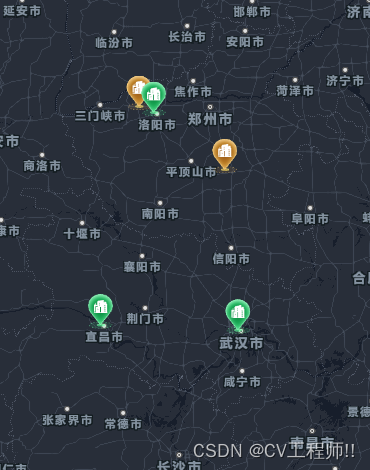
}Finally, take a look at the renderings