Get Gaode key
1. We first go to the Amap official website to register, log in and create the application.

2. Then after we create the application, it does not have a key value. Then we create one directly
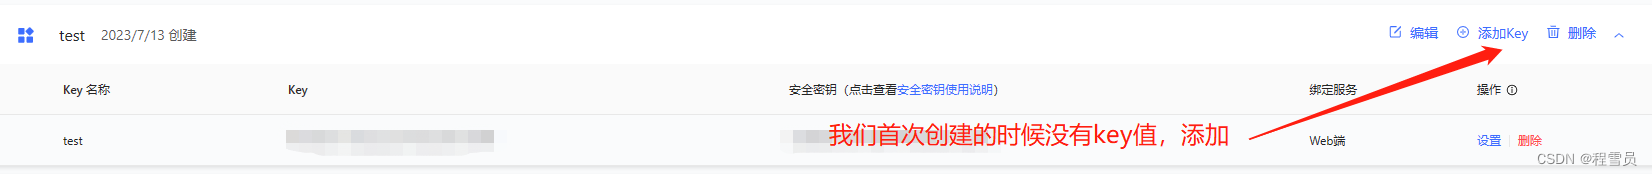
and our key is successfully obtained. Next is the code. It’s time to code.
Download the Gaode map plug-in
npm i @amap/amap-jsapi-loader --save
Then set the div box. Note that the width and height of the box must be given here, otherwise the map will not be displayed.
<template>
    <div class="app-container">
        <div style="background-color: #ffffff;">
            <div id="container"></div>
        </div>
    </div>
</template>
<style>
#container {


    padding: 0px;
    margin: 0px;
    width: 100%;
    height: 800px;
}
</style>
Next is the logic in the script. Here I have commented and marked all the logic in it. We only need to copy our key and then use it.
<script setup>
import AMapLoader from '@amap/amap-jsapi-loader';
/*在Vue3中使用时,需要引入Vue3中的shallowRef方法(使用shallowRef进行非深度监听,
因为在Vue3中所使用的Proxy拦截操作会改变JSAPI原生对象,所以此处需要区别Vue2使用方式对地图对象进行非深度监听,
否则会出现问题,建议JSAPI相关对象采用非响应式的普通对象来存储)*/
import {

     shallowRef } from '@vue/reactivity';
import {

     ref } from "vue";

// const map = shallowRef(null);
const path = ref([]);
const current_position = ref([]);


function initMap() {


    window._AMapSecurityConfig = {


        securityJsCode: '8e920f73eb2e6880a92ea6662eefc476',
    }
    AMapLoader.load({


        key: "89bd0d7a1162dacb5316352587d1bf96", // 申请好的Web端开发者Key,首次调用 load 时必填
        version: "2.0", // 指定要加载的 JSAPI 的版本,缺省时默认为 1.4.15
        // plugins:[''], // 需要使用的的插件列表,如比例尺'AMap.Scale'等
    }).then((AMap) => {


        const map = new AMap.Map("container", {

      //设置地图容器id
            viewMode: "3D",    //是否为3D地图模式
            zoom: 13,           //初始化地图级别
            center: [113.808299, 34.791787], //初始化地图中心点位置
        });
        // 添加插件
        AMap.plugin(["AMap.ToolBar", "AMap.Scale", "AMap.HawkEye", "AMap.Geolocation", "AMap.MapType", "AMap.MouseTool"], function () {


            //异步同时加载多个插件
            // 添加地图插件
            map.addControl(new AMap.ToolBar()); // 工具条控件;范围选择控件
            map.addControl(new AMap.Scale()); // 显示当前地图中心的比例尺
            map.addControl(new AMap.HawkEye()); // 显示缩略图
            map.addControl(new AMap.Geolocation()); // 定位当前位置
            map.addControl(new AMap.MapType()); // 实现默认图层与卫星图,实时交通图层之间切换

            // 以下是鼠标工具插件
            const mouseTool = new AMap.MouseTool(map);
            // mouseTool.rule();// 用户手动绘制折线图,测量距离
            mouseTool.measureArea(); // 测量面积
        });
        // 单击
        map.on('click', (e) => {


            // lng ==> 经度值  lat => 维度值
            current_position.value = [e.lnglat.lng, e.lnglat.lat];
            path.value.push([e.lnglat.lng, e.lnglat.lat]);
            // addMarker();
            // addPolyLine();
        })


        // 实例化点标记
        // 第一种(封成函数来触发)
        function addMarker() {


            const marker = new AMap.Marker({


                icon: "//a.amap.com/jsapi_demos/static/demo-center/icons/poi-marker-default.png",
                position: current_position.value, // 这里我们通过上面的点击获取经纬度坐标,实时添加标记
                // 通过设置 offset 来添加偏移量
                offset: new AMap.Pixel(-26, -54),
            });
            marker.setMap(map);
        }
        // 第二种 直接写死 position 的经纬度值
        /*const marker = new AMap.Marker({
            icon: "//a.amap.com/jsapi_demos/static/demo-center/icons/poi-marker-default.png",
            position: [113.808299,34.791787],
            // 通过设置 offset 来添加偏移量
            offset: new AMap.Pixel(-26, -54),
        });
        marker.setMap(map);*/


        // 折线
        function addPolyLine() {


            const polyline = new AMap.Polyline({


                path: path.value,
                isOutline: true,
                outlineColor: "#ffeeff",
                borderWeight: 1,
                strokeColor: "#3366FF",
                strokeOpacity: 0.6,
                strokeWeight: 5,
                // 折线样式还支持 'dashed'
                strokeStyle: "solid",
                // strokeStyle是dashed时有效
                // strokeDasharray: [10, 5],
                lineJoin: "round",
                lineCap: "round",
                zIndex: 50,
            });
            map.add([polyline]);
        }


    }).catch(e => {


        console.log(e);
    })
}

initMap()
</script>