Pasos detallados para introducir echarts en vue3 : https://blog.csdn.net/m0_67986791/article/details/129385861
Pasos detallados para introducir echarts por separado en los componentes de vue3: https://blog.csdn.net/m0_67986791/article/details /129960204
1. Entrar en la web oficial de echarts
https://echarts.apache.org/zh/index.html
haga clic para descargar】
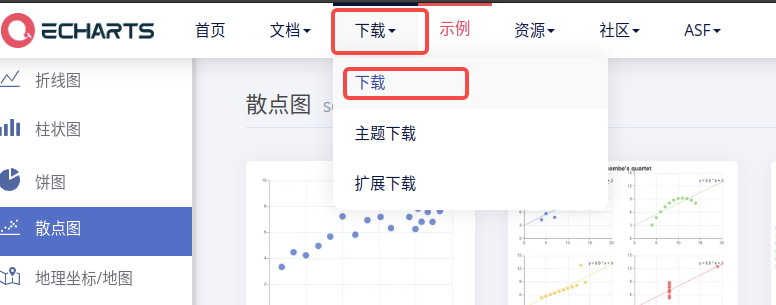
2. Deslice hacia abajo y haga clic en [Personalización en línea]
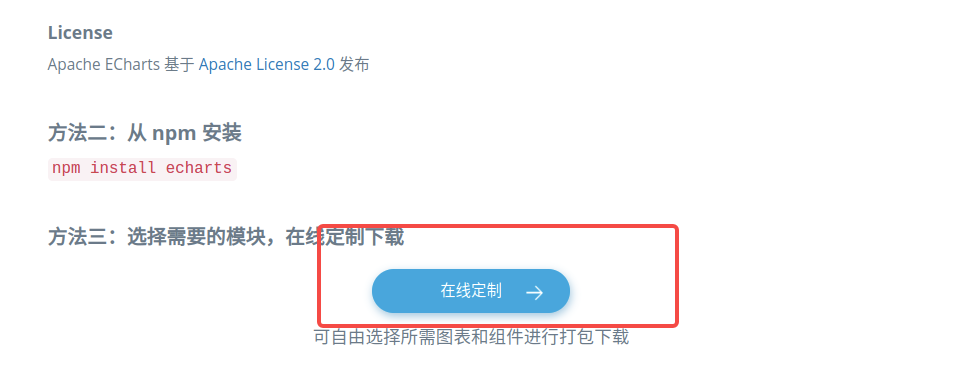
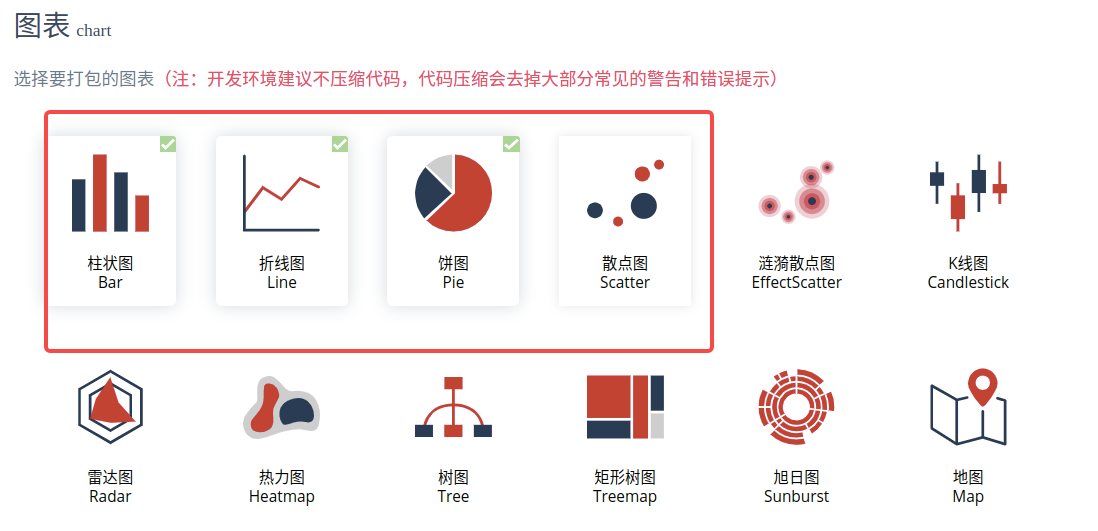
3. Después de seleccionar el gráfico a empaquetar, haga clic en [Descargar] para generar el archivo echarts.min.js
4. Coloque el echarts.min.js descargado en el directorio del mismo nivel e importe el html
<!DOCTYPE html>
<html>
<head>
<meta charset="utf-8" />
<title>ECharts</title>
<!-- 引入刚刚下载的 echarts.min.js -->
<script src="./echarts.min.js"></script>
</head>
<body>
<!-- 为 ECharts 准备一个定义了宽高的 DOM -->
<div id="main" style="width: 600px;height:400px;">
</div>
<script type="text/javascript">
</script>
</body>
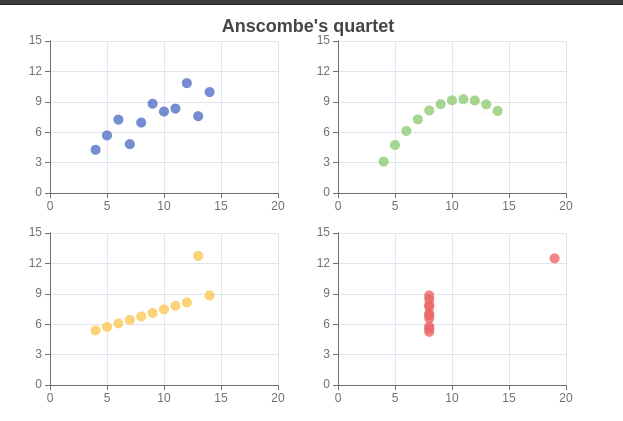
</html>5. Vaya al sitio web oficial para encontrar un caso, encontré un caso de diagrama de dispersión, el siguiente es el código fuente HTML
<!DOCTYPE html>
<html>

<head>
    <meta charset="utf-8" />
    <title>ECharts</title>
    <!-- 引入刚刚下载的 ECharts 文件 -->
    <script src="./echarts.min.js"></script>
</head>

<body>
    <!-- 为 ECharts 准备一个定义了宽高的 DOM -->
    <div id="main" style="width: 600px;height:400px;">
    </div>
    <script type="text/javascript">
        var chartDom = document.getElementById('main');
        var myChart = echarts.init(chartDom);
        var option;

        const dataAll = [
            [
                [10.0, 8.04],
                [8.0, 6.95],
                [13.0, 7.58],
                [9.0, 8.81],
                [11.0, 8.33],
                [14.0, 9.96],
                [6.0, 7.24],
                [4.0, 4.26],
                [12.0, 10.84],
                [7.0, 4.82],
                [5.0, 5.68]
            ],
            [
                [10.0, 9.14],
                [8.0, 8.14],
                [13.0, 8.74],
                [9.0, 8.77],
                [11.0, 9.26],
                [14.0, 8.1],
                [6.0, 6.13],
                [4.0, 3.1],
                [12.0, 9.13],
                [7.0, 7.26],
                [5.0, 4.74]
            ],
            [
                [10.0, 7.46],
                [8.0, 6.77],
                [13.0, 12.74],
                [9.0, 7.11],
                [11.0, 7.81],
                [14.0, 8.84],
                [6.0, 6.08],
                [4.0, 5.39],
                [12.0, 8.15],
                [7.0, 6.42],
                [5.0, 5.73]
            ],
            [
                [8.0, 6.58],
                [8.0, 5.76],
                [8.0, 7.71],
                [8.0, 8.84],
                [8.0, 8.47],
                [8.0, 7.04],
                [8.0, 5.25],
                [19.0, 12.5],
                [8.0, 5.56],
                [8.0, 7.91],
                [8.0, 6.89]
            ]
        ];
        const markLineOpt = {
            animation: false,
            label: {
                formatter: 'y = 0.5 * x + 3',
                align: 'right'
            },
            lineStyle: {
                type: 'solid'
            },
            tooltip: {
                formatter: 'y = 0.5 * x + 3'
            },
            data: [
                [
                    {
                        coord: [0, 3],
                        symbol: 'none'
                    },
                    {
                        coord: [20, 13],
                        symbol: 'none'
                    }
                ]
            ]
        };
        option = {
            title: {
                text: "Anscombe's quartet",
                left: 'center',
                top: 0
            },
            grid: [
                { left: '7%', top: '7%', width: '38%', height: '38%' },
                { right: '7%', top: '7%', width: '38%', height: '38%' },
                { left: '7%', bottom: '7%', width: '38%', height: '38%' },
                { right: '7%', bottom: '7%', width: '38%', height: '38%' }
            ],
            tooltip: {
                formatter: 'Group {a}: ({c})'
            },
            xAxis: [
                { gridIndex: 0, min: 0, max: 20 },
                { gridIndex: 1, min: 0, max: 20 },
                { gridIndex: 2, min: 0, max: 20 },
                { gridIndex: 3, min: 0, max: 20 }
            ],
            yAxis: [
                { gridIndex: 0, min: 0, max: 15 },
                { gridIndex: 1, min: 0, max: 15 },
                { gridIndex: 2, min: 0, max: 15 },
                { gridIndex: 3, min: 0, max: 15 }
            ],
            series: [
                {
                    name: 'I',
                    type: 'scatter',
                    xAxisIndex: 0,
                    yAxisIndex: 0,
                    data: dataAll[0],
                    markLine: markLineOpt
                },
                {
                    name: 'II',
                    type: 'scatter',
                    xAxisIndex: 1,
                    yAxisIndex: 1,
                    data: dataAll[1],
                    markLine: markLineOpt
                },
                {
                    name: 'III',
                    type: 'scatter',
                    xAxisIndex: 2,
                    yAxisIndex: 2,
                    data: dataAll[2],
                    markLine: markLineOpt
                },
                {
                    name: 'IV',
                    type: 'scatter',
                    xAxisIndex: 3,
                    yAxisIndex: 3,
                    data: dataAll[3],
                    markLine: markLineOpt
                }
            ]
        };

        option && myChart.setOption(option);
    </script>
</body>

</html>
Efecto generador:
6.Echarts-configuración básica
La siguiente configuración es importante : serie xAxis yAxis cuadrícula información sobre herramientas título leyenda color
serie
Una lista de series, cada serie determina su propio gráfico tipo por tipo
Datos de icono, especifica qué tipo de icono puede superponerse a varios gráficos.
xAxis : el eje x en la cuadrícula del sistema de coordenadas rectangulares
borderGap: la estrategia de borrado en ambos lados del eje de coordenadas es verdadera. En este momento, la escala solo se usa como una línea divisoria, y las etiquetas y los puntos de datos estarán en el medio de la banda entre las dos escalas.
yAxis : el eje y en la cuadrícula del sistema de coordenadas rectangulares
grid : La cuadrícula de dibujo en el sistema de coordenadas cartesianas.
título : componente del título
información sobre herramientas : componente de cuadro de solicitud
legend:图例组件
color:调色盘颜色列表
数据堆叠,同个类目轴上系列配置相同的stack值后 后一个系列的值会在前一个系列的值上相加。
如有帮助请给博主点个赞~~~~