Implementación del desglose del histograma echarts en Vue

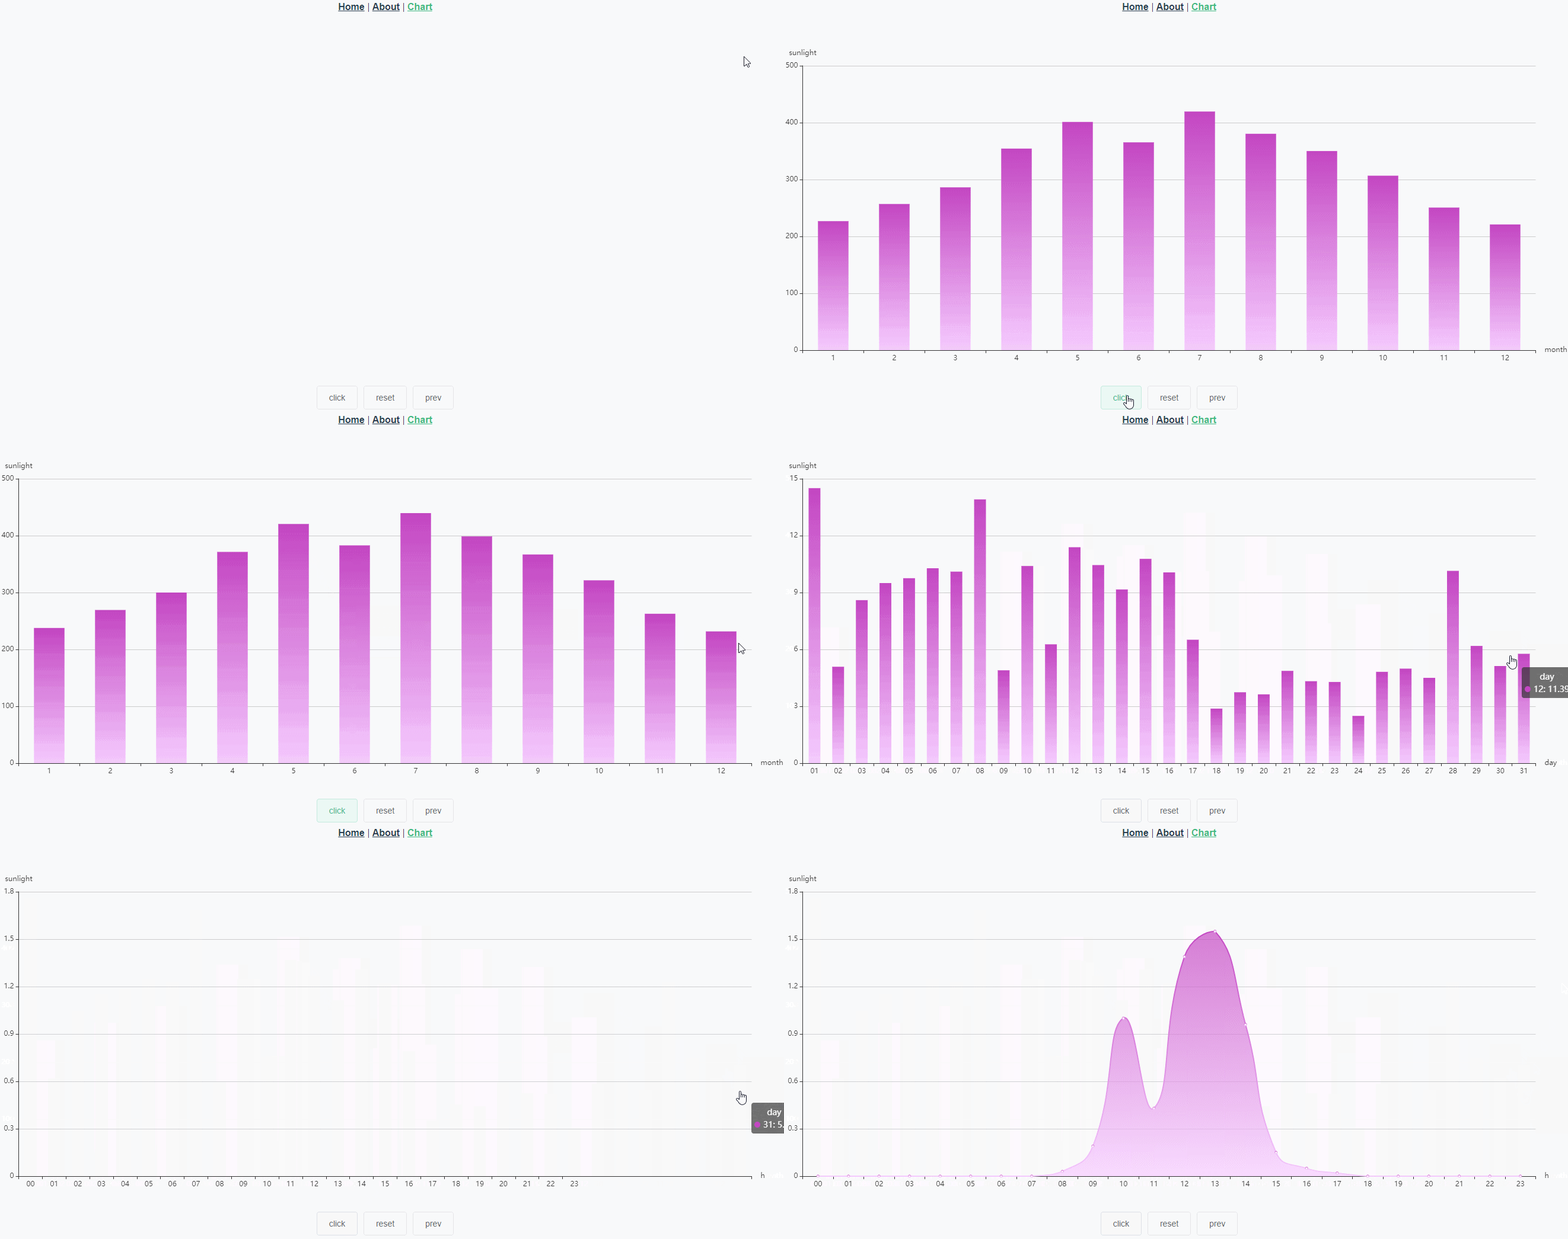
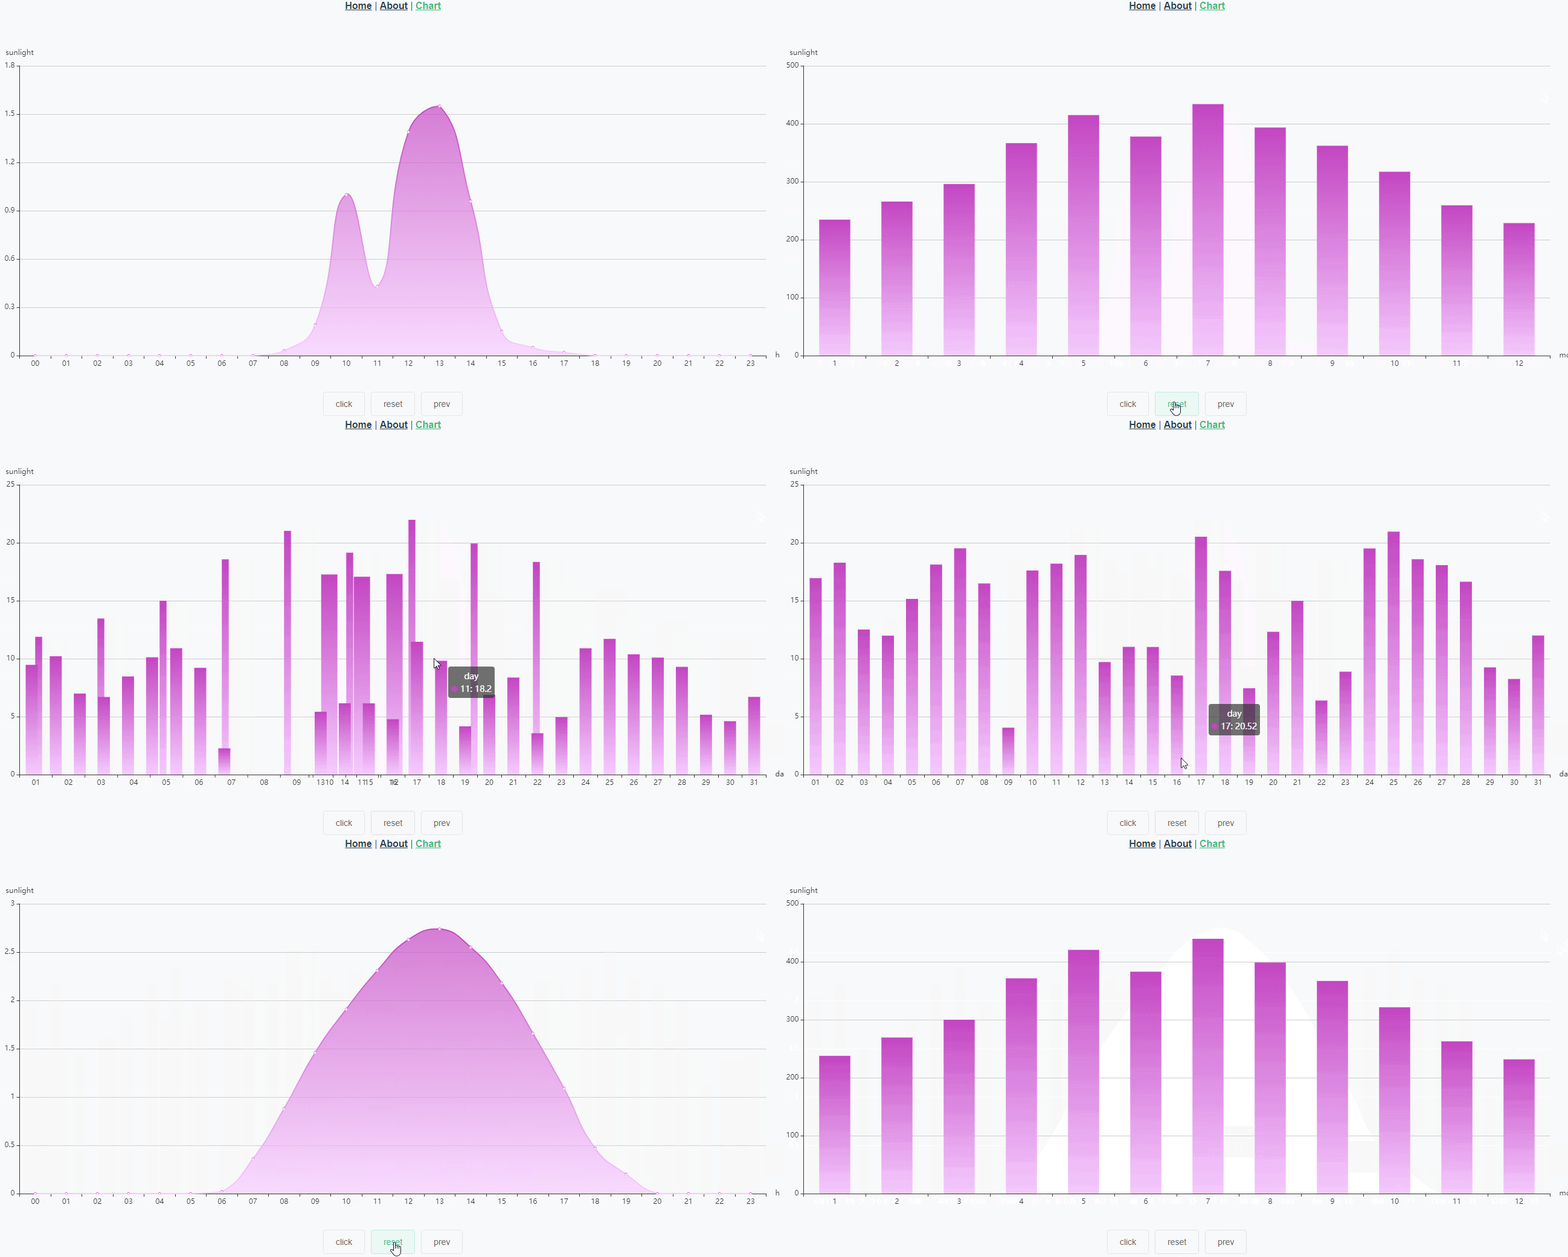
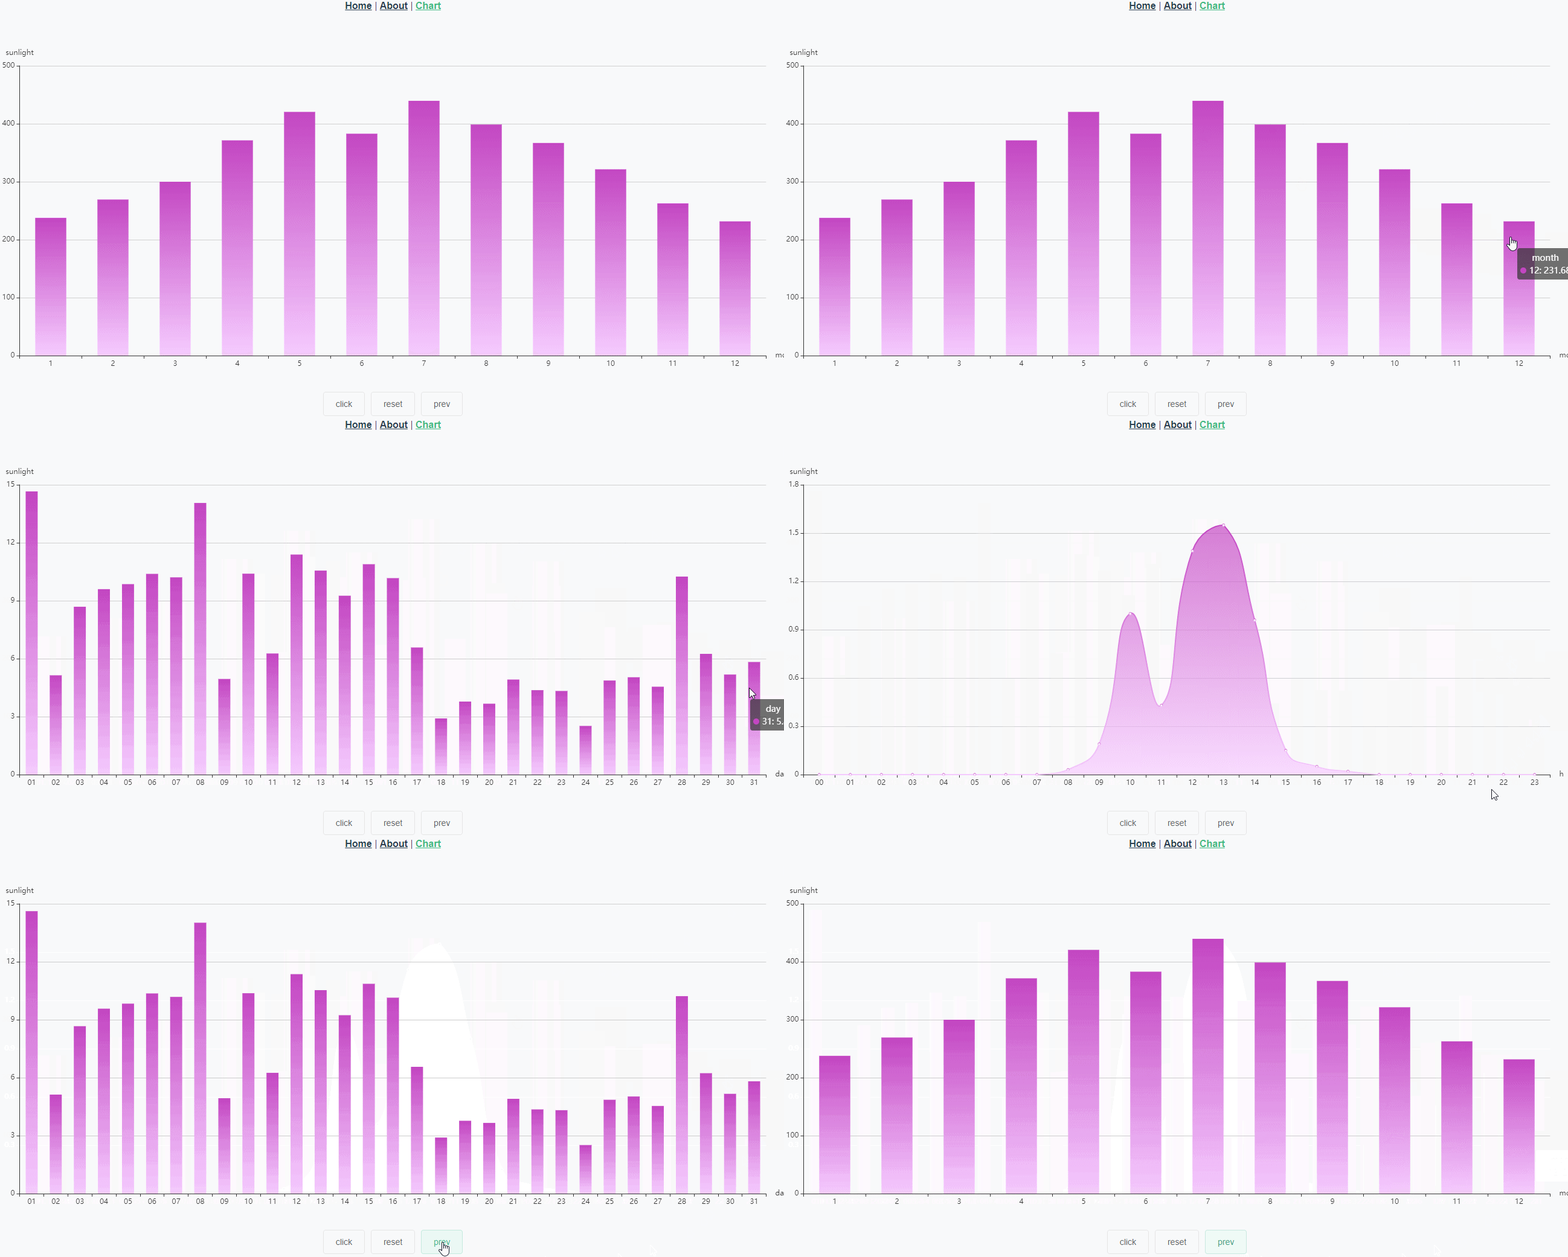
Imagen de efecto

Desglose de la base
Volver al original
Vuelve al paso anterior.

Escenarios de aplicación

Hay muchos escenarios de aplicación para desglosar datos, como ventas anuales a ventas mensuales.

html

<template>
    <div class="chart">
        <div ref="chartEle" id="chart" style="width: 100%; height: 600px; margin: 0 auto;"></div>
        <div class="btn-box">
            <el-button @click="getChartData('month')">click</el-button>
            <el-button @click="reset">reset</el-button>
            <el-button @click="prev">prev</el-button>
        </div>
    </div>
</template>

js

    export default {
    
    
        name: "Chart",
        data() {
    
    
            return {
    
    
                myChart: null,
                status: 2,
                month: '01',
                date: '2019-01-01'
            }
        },
        mounted() {
    
    
            this.myChart = this.$echart.init(this.$refs.chartEle);

            this.clickChart();
        },
        methods: {
    
    
            //渲染图表
            renderChart(xData, yData, name) {
    
    
                let option = {
    
    
                    color: ['#bfccff'],
                    title: {
    
    
                        text: ''
                    },
                    tooltip: {
    
    },
                    xAxis: {
    
    
                        data: xData,
                        name: name
                    },
                    yAxis: {
    
    
                        name: 'sunlight'
                    },
                    series: [{
    
    
                        name: name,     //可以当做一个唯一的属性,用来判断当前的图表
                        type: name == 'h' ? 'line' : 'bar',
                        smooth: true,
                        barCategoryGap: '50%',
                        data: yData,
                        itemStyle: {
    
    
                            color: new this.$echart.graphic.LinearGradient(
                                0, 0, 0, 2,
                                [
                                    {
    
    offset: 0, color: '#C346C2'},
                                    {
    
    offset: 0.5, color: '#F5CBFF'}
                                ])
                        },
                        areaStyle: {
    
    }
                    }]
                };

                this.myChart.setOption(option);

                window.addEventListener('resize', () => {
    
    
                    this.myChart.resize();
                });
            },
            //获取图表数据
            getChartData(name) {
    
    
                const url = '/power/projPower/getAll';

                let data = {
    
    
                    'pid': 990,
                    'status': this.status,
                    'month': this.month,
                    'date': this.date
                };

                this.$ajax.get(url, {
    
    
                    'params': data
                }).then(res => {
    
    
                    if (res.code == 200) {
    
    
                        this.renderChart(res.data.times, res.data.number, name);
                    }
                })
            },
            //图表点击下钻
            clickChart() {
    
    
                this.myChart.on('click', params => {
    
    
                    switch (params.seriesName) {
    
    
                        case 'month':
                            this.status = 1;
                            this.month = params.name.length < 2 ? '0'.concat(params.name) : params.name;
                            this.getChartData('day');
                            break;
                        case 'day':
                            this.status = 0;
                            this.date = params.name.length < 2 ? '0'.concat(params.name) : params.name;
                            this.date = '2019-' + this.month + '-' + this.date;
                            this.getChartData('h');
                            break;
                        default:
                            break;
                    }
                })
            },
            //还原为最开始的数据
            reset() {
    
    
                this.status = 2;
                this.getChartData('month');
            },
            //返回上一步图表数据
            prev() {
    
    
                switch (this.status) {
    
    
                    case 1:
                        this.status = 2;
                        this.getChartData('month');
                        break;
                    case 0:
                        this.status = 1;
                        this.getChartData('day');
                        break;
                    default:
                        break;
                }
            }
        }
    }

Principio de realización

1. El objeto de instancia echarts se declara de forma independiente y solo una vez.
2. El evento de clic en el gráfico se escribe fuera de la función de renderizado.
En el proceso de mi implementación, es importante reducir el grado de acoplamiento, cuanto más simple se pueda dividir el código, mejor y se pueden evitar muchos problemas.

Supongo que te gusta

Origin blog.csdn.net/dizuncainiao/article/details/90707847
Recomendado
Clasificación