The first week study notes
Descriptive statistical data of 0715-0721
table of Contents

First, the central tendency of the data
1. the mode:
A set of data, the maximum number of occurrences, uppercase letters M. A set of data may have multiple modes, the mode may be no. A mode representative of a set of data with poor reliability, but the mode is not affected by the data terminal, and Method sake of simplicity. In a set of data, if the data is very individual changes, select median represents the "central tendency" This set of data is more suitable. Three kinds of methods to solve the number of the congregation: observation: the direct number to find out the highest number of the group; Kim inserted hairs; Pearson empirical method
2. median:
In sorted order, the number in the middle position. A set of data, from small to large order or descending order, the middle number is the median. If this set of data is an odd number, compared with the middle of the number if the number is an even number, compared with the average of the two middle numbers. Probability density function, the median is to place the entire graph into equal areas on both sides.
3. averages:
Generally it refers to the arithmetic mean. A set of data represents the number of central tendency, it refers to all of the data in a set of data and divided by the number of the set of data. Vulnerable to the effects of extreme data.
Arithmetic average number: 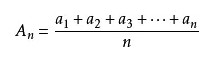
Geometric mean:![]()
weighted average:![]()
4. quantile:
Also known as sub-sites, refers to the probability distribution of a random variable data points into several aliquots, commonly used median (i.e., binary digits), quartiles, and other percentiles. Quartile carved is a statistical median, i.e. all values are arranged in ascending into four equal parts and, in the value position is divided three quartiles. 1. The first quartile (Ql), also known as "small quartile", equal to the sample value of 25% of all the numbers arranged in ascending; 2. Second quartile ( Q2), also known as "median", equal to the sample value of 50% of all the numbers arranged in ascending; 3. third quartile (Q3), also known as "large quartile ", all the sample values equal to the 75% figure after ascending order. The gap between the third quartile and the first quartile, also known as interquartile range. Percentile: statistical terms. If a set of data from small to large, and calculate the cumulative percentile, the percentile of a percentile value of the data is called the corresponding percentile.
5. very poor:
The gap between the maximum and minimum values. Also known as an error or full-pitch range (the Range), represented by R, it is used to represent the variation in the number of statistics (measures of variation), which is the gap between the maximum and minimum values, i.e., the maximum value minus minimum value data obtained from. Range = Max - Min i.e.: R = xmax-xmin
Second, the trend data from the
1. The numerical data
variance: random variables and its mathematical measure of the degree of divergence between the expected (i.e. mean).
Standard deviation: square and subtracting all numbers, the average value of the results obtained by dividing the sum of the number of groups (or number minus one, i.e., variance), then the resulting square root values, this number is obtained from the group of the standard deviation of the data.
Poor: the gap between the maximum and minimum values.
Mean difference: the arithmetic mean value of each variable with the absolute value of the average deviation.
2. The sequence data
interquartile range: upper quartile (Q3, which is located 75%) and the lower quartile (Q1, which is located 25%) of the difference. Q = Q3 - Q1
3. classification data
different public ratio: one from the trend indicators. All the different ratio refers to the ratio of the number of times the overall Sino-African public and all times of the total. In other words, all the different non-pilot ratio means the ratio of the number of all the total frequency of the array.
Third, the relative degree of dispersion
Coefficient of variation
Also known as the coefficient of variation, a simple understanding is used to measure the degree of dispersion of data. Dispersion coefficient, indicating the degree of dispersion of data is large; small dispersion coefficient, indicating the degree of dispersion of data is small. When comparing two or more discrete level information, and if the average number of units of measure the same, standard deviation can be directly compared. If the unit and (or) average number is not the same, comparing the degree of dispersion can not use standard deviation, and standard deviation for an average ratio (relative value) employed to compare.
Coefficient of variation = standard deviation / average
Fourth, the shape of the distribution
1. The coefficient of skewness
To the difference between the average and the median ratio of the standard deviation to measure the degree of skew, skew coefficient expressed by SK: skewness coefficient is less than 0, because the mode Zhizuo the average, the distribution is biased to the left one kind , also known as negative bias. Skewness coefficient greater than 0, because the mode Means right hand, is a right partial distribution, also known as forward-biased. Skewness is a mode according to their nature, the median and mean, skewness is measured by comparing the mode or the median and mean value, i.e. coefficient of skewness is depiction of the distribution and degree oblique direction. The mode, median, average gap larger number three, then the larger the skewness coefficient. That we are doing digging and found that the number three is far worse, you should know skewness coefficient data is particularly great.

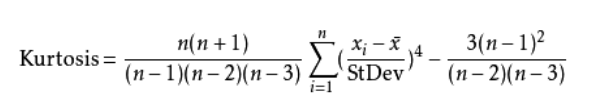
2. The coefficient of kurtosis
Kurtosis (peakedness; kurtosis), also known as kurtosis coefficients. Simply put, it is a flat peak or spike a measure of the degree of data distribution. Statistics measure kurtosis is the coefficient of kurtosis.
1, kurtosis coefficient is the probability distribution function, directly related to the level of probability that the number of the congregation, the higher the probability that the public, the greater the kurtosis coefficients.
2, coefficient of kurtosis of the normal distribution is three, often calculated coefficient of kurtosis will be compared with 3, is less than three peaks have insufficient degree, if more than three peaks have an excessive degree. Anyway understood greater than 3 sharper than normal.
3, in the same standard deviation, kurtosis larger, we have more extreme values distribution.
Conclusion: Thanks east lay wood provide a platform for the study. Let us have the opportunity to learn the common discussion. No public wx: Wood East scholar
2019/07/21
