1. Description of the problem
Suppose a botanical varieties of iris lovers she found very interesting. She collected some measurements each flower Iris:
- The length and width as well as length and width of petals calyx, all units are cm measurements.
She also had a number of measurement data iris, the flower before they have been identified as belonging to the botanical expert setosa, versicolor virginica one or three varieties. For these measurements, she may be determined iris each flower species belongs.
We assume that the botany enthusiasts will encounter three iris in the wild. Our goal is to build a machine learning model,
we can learn from these known varieties of iris measurement data in order to be able to predict new iris varieties
. Because we have known varieties of iris measurement data, so this is a
supervised learning
problem. In this problem, we want to predict one (Iris species) in a number of options. This is a classification (classifification) example of the problem. Possible output (different varieties of iris) called category (class). Each data set iris flowers fall into one of three categories, so this is a three-classification problem.
2, the test code
 1 #!/usr/bin/env python
 2 # -*- coding: utf-8 -*-
 3 # @File  : Iris.py
 4 # @Author: 赵路仓
 5 # @Date  : 2020/2/26
 6 # @Desc  :
 7 # @Contact : [email protected]
 8
 9 import numpy as np
10 import matplotlib.pyplot as plt
11 import pandas as pd
12 import mglearn
13 import pandas as pd
14 from sklearn.datasets import load_iris  # Iris (Iris) data set, which is machine learning and statistical data set in a classic
15  from sklearn.model_selection Import train_test_split
 16
17 iris_dataset = load_iris ()   # load_iris returned iris Bunch object is an object with the dictionary is very Similarly, and which contains the key value
18 is  Print ( " key or iris_dataset: \ n-{} " .format (iris_dataset.keys ()))   # printing
. 19  Print (iris_dataset [ ' DESCR ' ] [: 193] + " \ n-. .. " )   # DESCR key value corresponding to a brief description of the data set. target_names corresponding to the key value is a string array which contains we want to predict the varieties of flowers
20  Print ( "Names the Target: {} " .format (iris_dataset [ ' target_names ' ]))   # three kinds of type name of the flower
21 is  Print ( " the Feature names: {} " .format (iris_dataset [ ' feature_names ' ]))   # three kinds of flower characteristic, the length and width of the petals calyx length width
22 is  Print ( " the type of data: {} " .format (type (iris_dataset [ ' data ' ])))   # of each row of the data array corresponding to a flower, columns representing each flower the four measurement data
23 is  Print ( " the Shape of data: {} " .format (iris_dataset [' Data ' ] .shape))   # array contains 150 different flowers of the measurement data
24  Print ( " First Five rows of Data: \ n-{} " .format (iris_dataset [ ' Data ' ] [:. 5]))   # front flower five data
25  Print ( " the type of target: {} " .format (type (iris_dataset [ ' target ' ])))   # is a one-dimensional array, a data corresponding to each flower which
26 is  Print ( " the Shape of target: {} " .format (iris_dataset [ ' target ' ].  shape))  #
27  Print ( " the Target: \ n-{} " .format (iris_dataset [ ' target ' ]))   # species 012 into three integer representing the three categories
28
29 X_train, X_test, Y_train, android.permission.FACTOR. = Train_test_split (iris_dataset [ ' Data ' ], iris_dataset [ ' target ' ], random_state = 0)
 30  Print ( " X_train Shape: {} " .format (X_train.shape))
 31 is  Print ( " Y_train Shape: {} " .format (Y_train. Shape))
 32  Print (" X_test Shape: {} " .format (X_test.shape))
 33 is  Print ( " android.permission.FACTOR. Shape: {} " .format (Y_test.shape))
 34 is
35  # data created using X_train DataFrame
36  # character using the iris_dataset.feature_names mark data
37 [ iris_dataframe = pd.DataFrame (X_train, Columns = iris_dataset.feature_names)   # abscissa and the abscissa Title
38  # use DataFrame create a scatter plot matrix, colored by y_trian
39 GRR = pd.plotting.scatter_matrix (iris_dataframe, Y_train = C, figsize = (15, 15), marker = ' O ' , hist_kwds = { ' bins ': 20}, s=60, alpha=.8, cmap=mglearn.cm3)
40 plt.show()
NOTE: wherein each row of the data array representative of a flower, four columns represent the measured data of each flower, a total of 150 different flowers. The target is a one-dimensional array, each flower representative data therein, represents an integer of 0,1,2 three three different flower species.
3, measure success: training data and test data
First, the model can not be used to evaluate the data to build the model, because the model is adapted to build a data model, used to test if the match must be 100%. Therefore, to use the new data to test the model.
Part of the data used to construct a machine learning model, called training
training data (training data)
or the
training set (Training SET)
, the data used to construct the machine learning models. The remaining data is used to evaluate the performance of the model, called
the test data (Test Data)
,
the test set (testset -)
or
leave set (SET HOLD-OUT)
. train_test_split scikit-learn function may disrupt the data set and split. 75% of the label and a corresponding data line as the training set, and 25% of the tab as the test data set, 75% and 25% can be changed according to the situation.
In short, the training is to build the data model, and the test data is to test whether the model of success. Represented by X input, respectively, four flower data, represented by Y output.
train_test_split function using a pseudo-random number generator disrupt the data set, using random_state parameter specifies the random number generator seed. So that the function output is fixed, the output of this line is always the same.
The part of the code as follows:
X_train, X_test, Y_train, Y_test = train_test_split(iris_dataset['data'], iris_dataset['target'], random_state=0)
print("X_train shape:{}".format(X_train.shape))
print("Y_train shape:{}".format(Y_train.shape))
print("X_test shape:{}".format(X_test.shape))
print("Y_test shape:{}".format(Y_test.shape))
4, observations
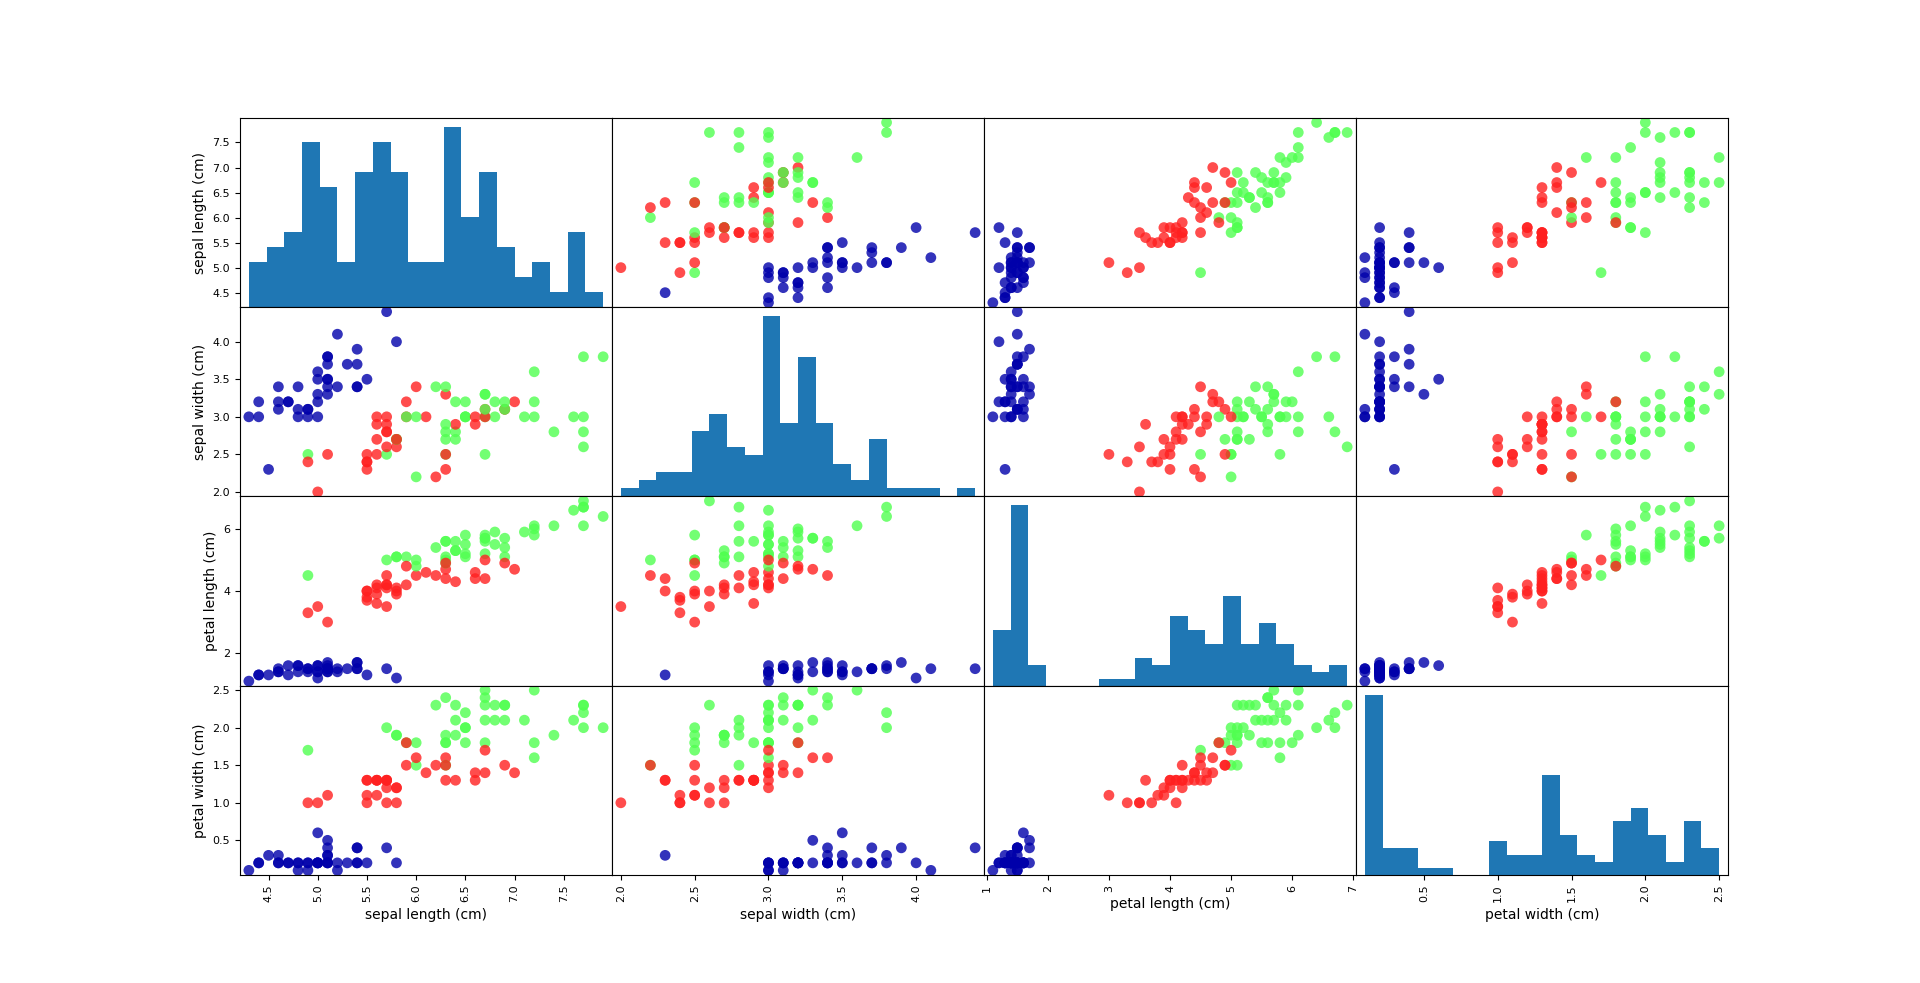
A visual rendering method is a scattergram (scatter plot). The scattergram data as a characteristic x-axis, y-axis to another feature, each of the data points plotted as a point on the FIG. Unfortunately, the computer screen only two dimensions, so we can only draw two features (possibly three). More than 3 plotted against the hard characteristic data set in this way. One way to solve this problem is to draw a scatter plot matrix (pair plot).
The part of the code as follows:
1  # using data created DataFrame X_train
2  # use iris_dataset.feature_names character data mark
. 3 iris_dataframe = pd.DataFrame (X_train, Columns = iris_dataset.feature_names)   # abscissa and the abscissa name
4  # utilizing scattergram created DataFrame matrix, according y_trian coloring
. 5 GRR = pd.plotting.scatter_matrix (iris_dataframe, C = Y_train, figsize = (15, 15), marker = ' O ' , hist_kwds = { ' bins ' :} 20 is, S = 60, = Alpha .8, CMap = mglearn.cm3)
 . 6 plt.show ()
Data show results: