Learn
acquaintance object-oriented way of drawing
the focus of
common plot in three ways, pyplot, pylab, as well as object-oriented,
less than pyplot underlying production capacity, simple to use
pylab fully encapsulated MAtlab, but does not recommend the use of
object-oriented is the essence of Matplotlib, but difficult, strong customization capabilities
below I write an object-oriented drawing mode, image making sinusoidal
1. choose to make a positive image
import pandas as pd
import numpy as np
import matplotlib.pyplot as plt

x=np.linspace(-2*np.pi,2*np.pi,100)#画图所需的X变量
y=np.sin(x)#画图所需的Y变量

fig=plt.figure()
#创建画图所用的‘画图器’
#但是没有画图器这一说,我们只是抽象的将他比做成一个画图使用的纸张,
#显示图像的框架就是纸张的大小
ax=fig.add_subplot(3,3,2)
#我们可以划分画图区间,划分成3×3的画面,画图画在从左到右,在从上到下的第二个框内
t=ax.set_title('object oriented')
#设置名称
plt.title('pyplot')
#设置画像名称
plt.plot(x,y)
plt.show()
2. The figures do Videos in a plurality FIG.
x = np.linspace(-2 * np.pi, 2 * np.pi, 100)
y = np.sin(x)


fig=plt.figure()
ax1=fig.add_subplot(2,2,1)
ax1.plot(x,y)
ax2=fig.add_subplot(2,2,2)
ax2.plot(x,-y)
ax3=fig.add_subplot(2,2,3)
ax3.plot(x,y**2)
ax4=fig.add_subplot(2,2,4)
ax4.plot(x,2*y)
plt.show()
To achieve the final show by creating different mesh ax

3. At the same time draw more of the drawings, the same is not displayed on a map
fig1 = plt.figure()
ax1 = fig1.add_subplot(2, 2, 1)
ax1.plot(x, y)
fig2 = plt.figure()
ax2 = fig2.add_subplot(2, 2, 2)
ax2.plot(x, -y)
fig3 = plt.figure()
ax3 = fig3.add_subplot(2, 2, 3)
ax3.plot(x, y ** 2)
fig4 = plt.figure()
ax4 = fig4.add_subplot(2, 2, 4)
ax4.plot(x, 2 * y)
plt.show()
In the code on the basis of the above made changes, we created four figure, also shows
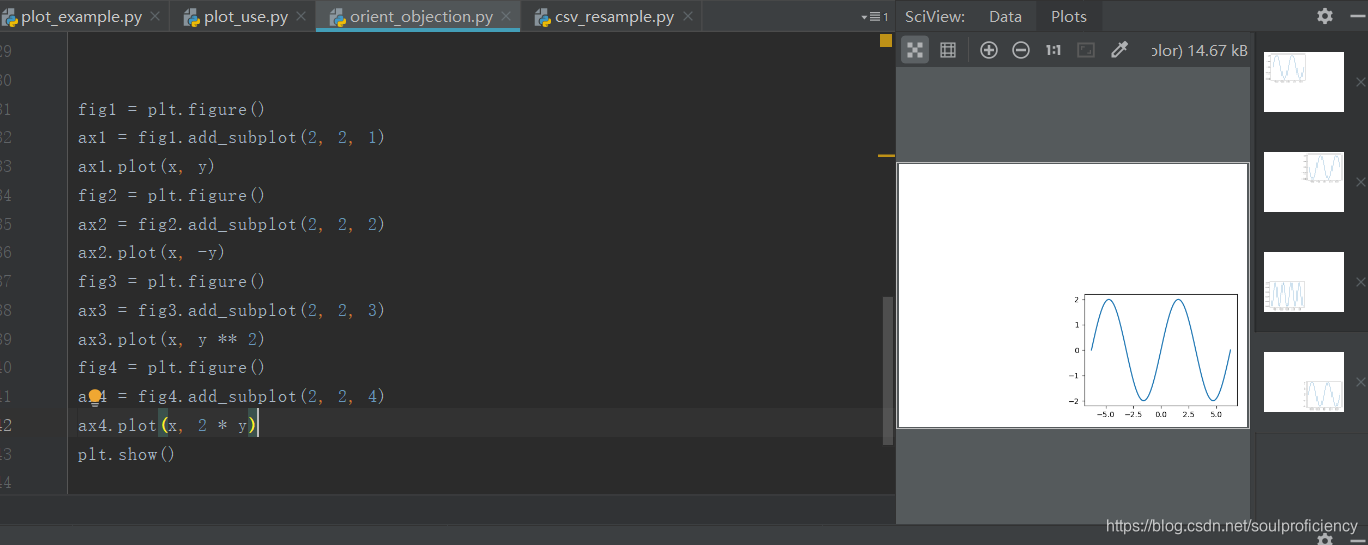
that we can observe, the last side also appeared in four figures
sum up we can see how many fig = plt.figure () will there are several views
of each fig there are how many different ax (axes), in the previous figure there are that many sub-graph, provided that its own subregion must be reasonable
Added: We display when plotting grid graph (grid command)
describes two methods here
1.plt.grid (True) command
fig1 = plt.figure()
ax1 = fig1.add_subplot(1, 1, 1)
ax1.plot(x, y)
plt.grid(True)
plt.show()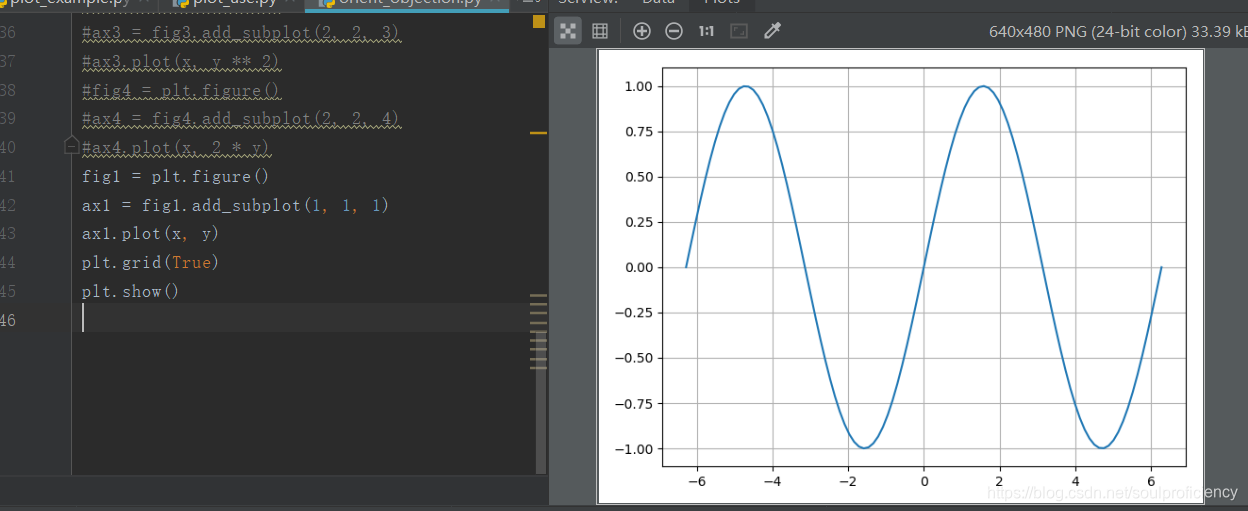
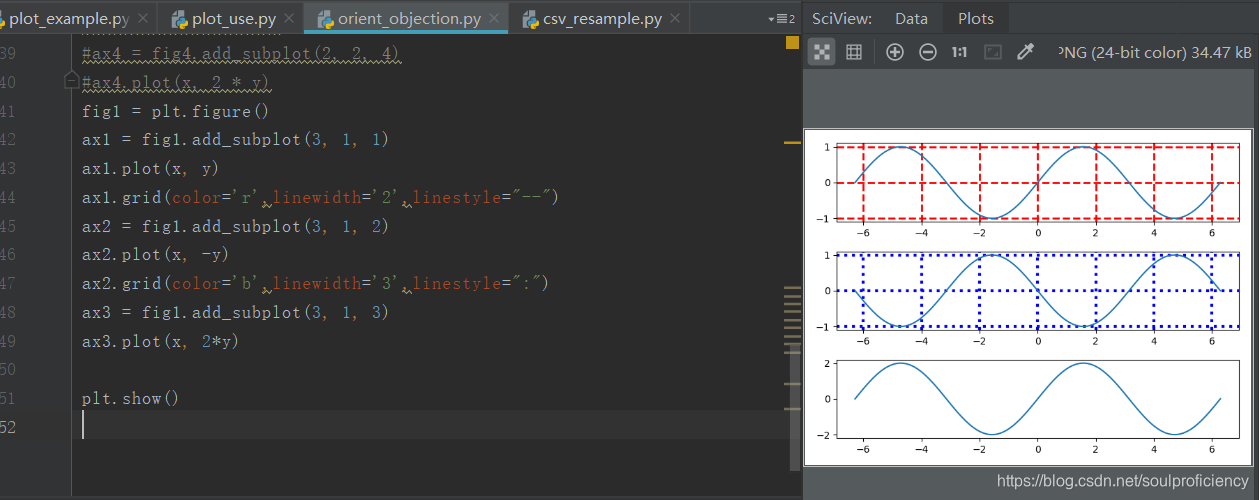
2. In the figure inside doing grid
ax.grid ()
fig1 = plt.figure()
ax1 = fig1.add_subplot(3, 1, 1)
ax1.plot(x, y)
ax1.grid(color='r',linewidth='2',linestyle="--")
ax2 = fig1.add_subplot(3, 1, 2)
ax2.plot(x, -y)
ax2.grid(color='b',linewidth='3',linestyle=":")
ax3 = fig1.add_subplot(3, 1, 3)
ax3.plot(x, 2*y)

plt.show()