Outline
Newcomers are doing the stress test with jmeter time, will be confused by some performance terms, the consequences of a direct result of the test results out of the data can not understand, let alone analysis. This article focuses give you an example to explain some of the terminology jmeter stress tests
Question 1: What is the pressure test
Asked how to do stress tests, a lot of people could only answer: "plus thread group, plus concurrent see the results." So what is the pressure, the pressure reflected from where? I'm afraid these do not know. . .
In the end what is stress? In fact, we stress test is represented by RPS
RPS
RPS is the number of requests (Request Per Second) per second , which describes the size of the pressing pressure actually sent to the server engine.
From the user point of view, rps is the number of clicks per second
requests from the client perspective, rps per second is sent to the server
using the tools of the ultimate goal is to take advantage of the number of threads and the number of iterations per user and simulated click the second pressure value that matches, the service side pressure, to obtain performance data
Rps response time is determined by the number of concurrent and server. May not achieve the desired number of concurrent RPS is too low, too high when the number of concurrent excessive pressure may overwhelm the server directly.
Question 2: jmeter how to adjust the pressure
From the foregoing, we know that the pressure is the number of requests made per second. Let us now understand a jmeter term Ramp-up-period (in seconds )
Ramp-up-period
jmeter thread has an adjustable set value: the Ramp-up-period , all the threads which indicates the start time required in seconds
Figure 1-1 Set 100 threads, the number of iterations = 1, Ramp-up-period = 25, then it means I will start 100 threads in 25 seconds, which is four threads per start.
The time interval between each thread start is 25/100 = 0.25s, which is 250ms.
Another way of understanding, which we expect to represent the pressure on the server is sending four requests per second. That is, set the RPS = 4 / s
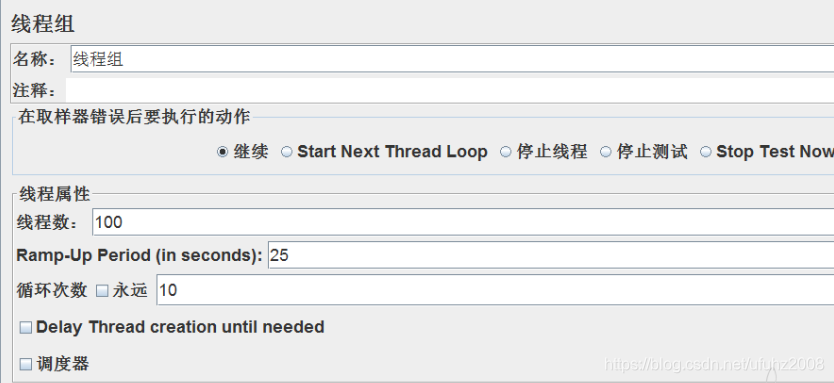
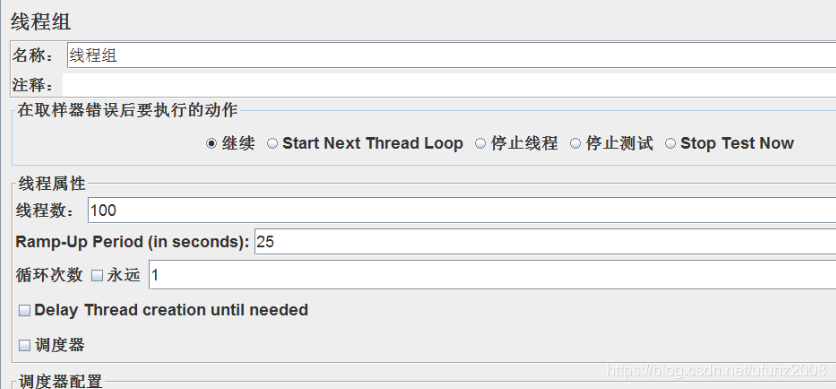 FIG. 1-2 threads 100 are provided, the number of iterations = 10, Ramp-up-period = 25, it means I starts the threads 100 in 25 seconds, each thread 10 iterations. That is 100 threads started 25 seconds and 10 iterations.
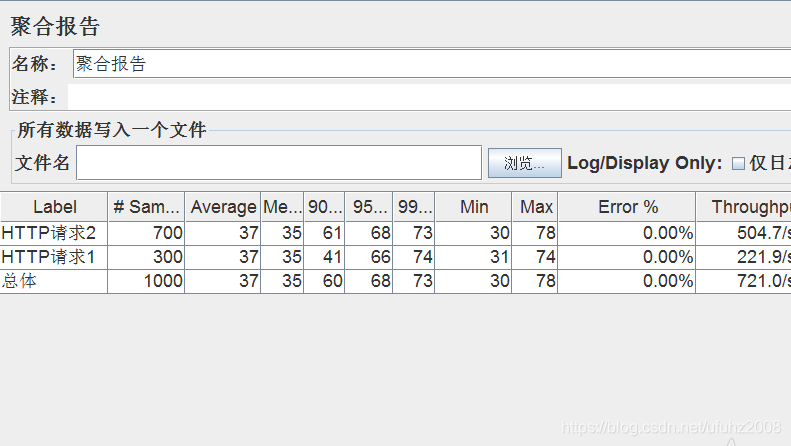
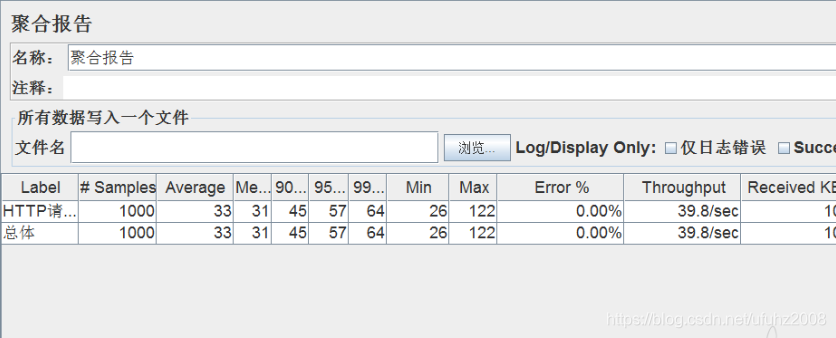
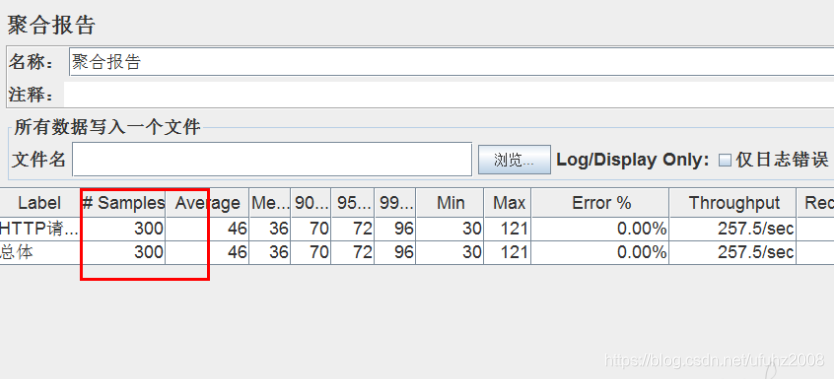
At this time, the RPS = 40 / S . Observation polymerization report 1-3, jmeter 25 seconds in 1000 initiated the request 100 with threads.
 1-3
1-3
The RPS is not jmeter to visually monitored by the listener, but in a single request, and RPS HPS theoretically equal. By HPS listener to verify it.
HPS monitor
TPS monitor
 ## issue 3: jmeter in throughput in the end what is?
It small partners in the use of jmeter, throughput is not often get confused? Everywhere throughput, in the end is what to do with it?
Let's see what throughput element
Timers and target Constant Throughput Throughput Shaping Timer
The controller has a certain logic controller
There is also a report of the polymerization Throughput
Barely, good halo ah. . . what. . . what. . . .
Do not hold collapsed below take you to sort out one by one, to rebuild jmeter world
First understand what is Throughput
Throughput is used to measure throughput, represented generally by TPS and QPS.
TPS represents the number of things through per second, QPS represents the number of queries per second interfaces.
jmeter If only a single port, then the TPS = QPS.
If the scene is a mixture of multi-interface, only the execution of things under control, it can be understood as TPS.
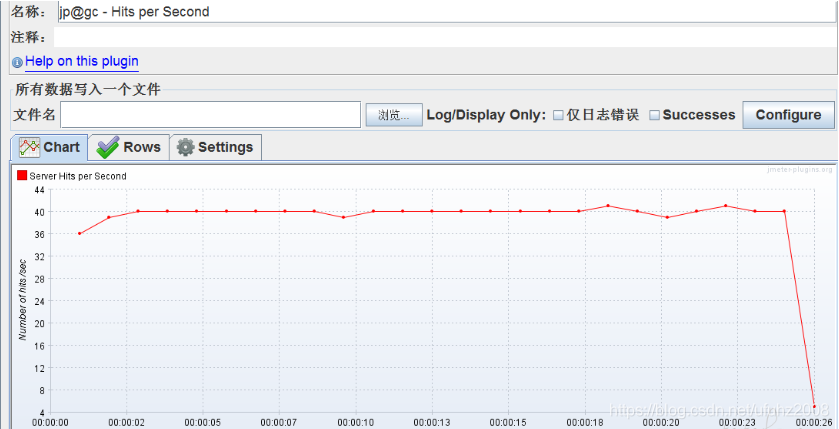
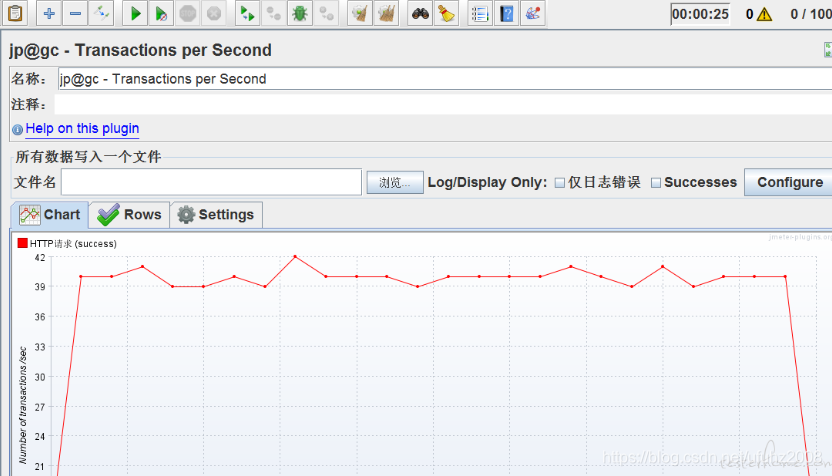
Throughput polymerization report
the traffic throughput TPS FIG Throughput represents the infinite iteration is about 40 / s. Second response means that the request is complete 40.
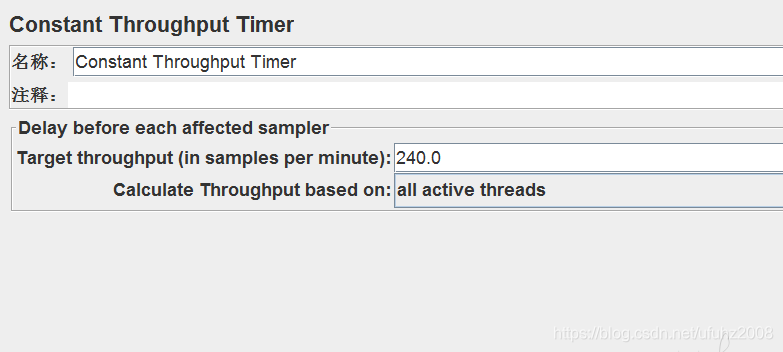
Constant Throughput Timer
Now we add a Constant Throughput Timer at the interface
This is a throughput timer, which can control our TPS.
As shown, the target throughput is set I 240 / min, that is 4 / s.
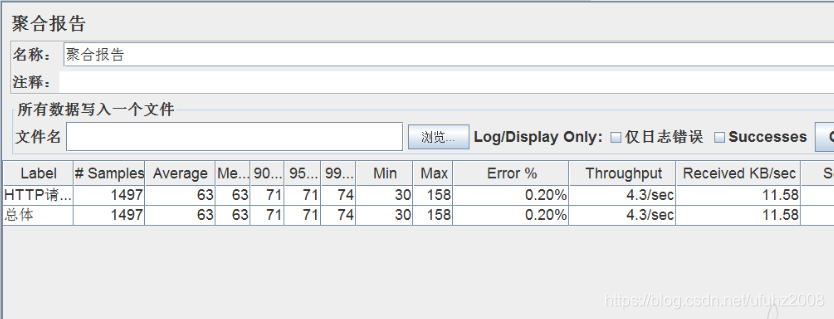
The next run of results can be seen, no matter how much we expect throughput, the actual TPS are strongly compressed in 4 / s, while our average response time becomes very short
Throughput Shaping Timer
look again Throughput Shaping Timer
The following figure it can clearly see the RPS is used to control, i.e. the number of requests per second.
start = 1 end = 100, the duration is 60. We need to represent the RPS in the 60s (the number of requests per second) from a raised to a uniform 100.
Here we can see requests per second uniform lifting
 logic controller - a certain controller
the controller in the throughput refers to the proportion of requests.
For example, we issued a total of 1000 request, the controller at the interface 300 will transmit, proportional control 30%
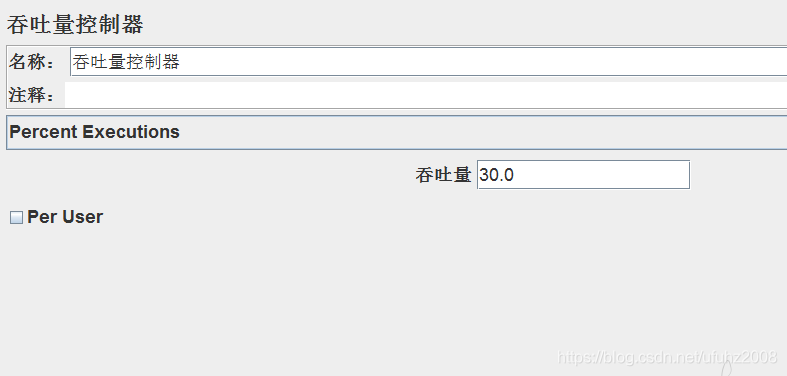
below this figure illustrates a more intuitive proportional allocation request
Proportional assignment request of the controller 1 is 30%, the remaining 70% of the requests are distributed to the controller 2