1. Download, install and use
Download link : jmeter-plugins.org
Installation: The downloaded file is in plugins-manager.jar format, put it into the lib/ext directory under the jmeter installation directory, and then restart jmeter.
Start jemter, click on the option, the bottom column, as shown below:

The interface after opening is as follows:

Installed Plugins (installed plug-ins): the plug-ins already included in the plug-in jar package, you can use these plug-ins by checking the check box;
Available Plugins (downloadable plug-ins): That is, some plug-ins extended by the plug-in, you can download the plug-ins you need by checking the check box;
Upgrades (updatable plug-ins): Some plug-ins that can be updated to the latest version are generally displayed in bold italics. You can download and update by clicking the Apply Changes and Restart Jmeter button in the lower right corner of the screenshot;
PS: It is generally not recommended to update, because the latest plug-ins have some compatibility issues, and it is likely to cause jmeter to be unusable (always report loading exceptions)! ! !
It is recommended to use the latest 3.2 version of jmeter to try to update these plugins.
二、Transactions per Second
Namely TPS: The number of transactions per second, one of the two most important indicators in performance testing. The function of the plug-in is to monitor the TPS performance of the server during the execution of the test script-such as overall trend, real-time average trend, stability, etc.
In the installation package of jmeter itself, although the monitor provides components such as aggregate reports , it can also provide some real-time data, but compared to the more demanding performance testing requirements, it is slightly weak.
The TPS change display diagram of a certain stress test:

三、Response Times Over Time
Namely TRT: Transaction response time, the other of the two most important indicators in performance testing. The main function of the plug-in is to monitor the real-time average value of response time and the overall response time trend during the execution of the test script.
The usage method is as above. After downloading, installing and configuring the plug-in, restart jmeter and add the monitor to see the real-time TRT value and overall performance in real time.
The TRT change display diagram of a certain stress test:

四、PerfMon Metrics Collector
The server performance monitoring data collector. In the performance test process, in addition to monitoring TPS and TRT, it is also necessary to monitor the resource usage of the server, such as CPU, memory, I/O, etc. The plug-in can monitor the server's resource usage in real time during performance testing.
Download address: http://jmeter-plugins.org/downloads/all/ or link: http://pan.baidu.com/s/1skZS0Zb Password: isu5
The download interface is as follows:

Among them, JMeterPlugins-Standard and JMeterPlugins-Extras are client-side plug-ins, and ServerAgent is the server-side plug-in.
After the download is successful, copy the two files, JmeterPlugins-Extras.jar and JmeterPlugins-Standard.jar, and put them in lib/ext in the jmeter installation file, restart jmeter, and you can see the monitor plug-in.
Upload ServerAgent-2.2.1.jar to the server under test, decompress it, enter the directory, Windows environment, double-click ServerAgent.bat to start; Linux environment execute ServerAgent.sh to start, and use port 4444 by default.
If the situation shown in the figure below appears, it indicates that the server configuration is successful:
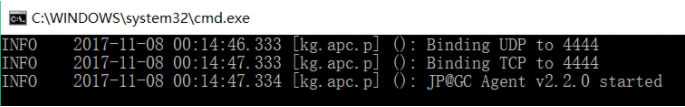
1. Server start verification
CMD enters the command box and observes whether there is a message received. If there is, it means that the ServerAgent has started successfully.
2. Client monitoring test
Add the jp@gc-PerfMon Metrics Collector listener to the test script, then add the server resource options that need to be monitored, start the script, and you can see the curve change of resource usage on the listener interface. As shown below:

After the script is started, you can see the changes in the curve of server resource usage from the interface. Chart represents the main interface display, Rows represents the color represented by the small interface and different resource curves, Settings represents the settings, and you can choose the configuration you need.
PS: Note that the test script needs to run for a period of time before you can see the specific curve changes, otherwise the ServerAgent side will be disconnected!
Five, thread group

1. Number of threads: Indicates the number of threads started, that is, the number of concurrent.
2. Ramp-Up Period: Means to start 1 thread within 1 second, the default value is 0, which means that after the program starts, 1 thread is started immediately. It is not very good to set too large or too small. The best value of Ramp- Up Period = number of threads/throughput .
3. Number of cycles: Indicates how many requests should be sent by each thread.
4. Scheduler: As the name suggests, if the duration is set to 60, it means that it lasts for 1 minute. Usually, the number of cycles and the scheduler can be set to one.
Six, add HTTP request

An HTTP request has many configuration parameters, which will be described in detail below:
1. Name: This attribute is used to identify a sampler, it is recommended to use a meaningful name.
2. Comment: It has no effect on the test, and only the user records user-readable comment information.
3. Server name or IP: The name or IP address of the target server sent by the HTTP request.
4. Port number: the port number of the target server, the default value is 80.
5. Protocol: The protocol used when sending HTTP requests to the target server, which can be http or https, and the default value is http.
6. Method: The method of sending HTTP request. Available methods include GET, POST, HEAD, PUT, OPTIONS, TRACE, DELETE, etc.
7, Content encoding: the encoding method of the content, the default value is iso8859
8. Path: target URL path (not including server address and port)
9. Automatic redirection: If this option is selected, when the response received after sending an HTTP request is 302/301, JMeter will automatically redirect to a new page.
10. Use keep Alive: When this option is selected, the Keep-Alive method is used for HTTP communication between jmeter and the target server, which is selected by default.
11. Use multipart/from-data for HTTP POST: When sending an HTTP POST request, use the Use multipart/from-data method to send, and it is not selected by default.
12. Send parameters with the request: Send URL parameters in the request. For URLs with parameters, jmeter provides a simple parameterization method. The user can set all the parameters in the URL in this table. Each row in the table is a parameter value pair (corresponding to name 1 = value 1 in RUL).
13. Send files with the request: Send files in the request. Generally, HTTP file upload behavior can be simulated in this way. /14. Get all contained resources from the HTML file: When this option is selected, after jmeter sends an HTTP request and obtains the content of the HTML file in the response, it also Parse the HTML and get all the resources contained in the HTML ( Picture, flash, etc.), which is not selected by default. If users only want to obtain specific resources on the page, they can fill in the specific resource expressions that need to be downloaded in the Embedded URLs must match text box below, so that only the specified regular expressions can be matched The URL that points to the resource will be downloaded.
15. Used as a monitor: This sampler is used as a monitor, and graphical statistics based on the sampler can be directly seen in the Monitor Results Listener. The default is not selected.
16. Save response as MD5 hash: Select this option to record only the MD5 value of the server response data during execution, instead of recording the complete response data. When a test with a very large amount of data is required, it is recommended to select this option to reduce the overhead of the sampler recording response data.
7. System throughput QPS (TPS)
System throughput = number of transactions processed per second
QPS (TPS) = concurrent number / average response time
The throughput of a system is usually determined by the two factors of QPS (TPS) and the number of concurrency. These two values of each system have a relative limit value. Under the pressure of application scenario access, as long as a certain item reaches the highest value of the system, the system's The throughput will not go up. If the pressure continues to increase, the throughput of the system will drop instead. The reason is that the system is overloaded, and other consumption such as context switching, memory, etc. leads to a decrease in system performance.
8. Aggregation report
I think the aggregate report should be the most important report in JMeter stress testing software.
1. #Samples: The number of samples, if you have read the previous article, this is the result calculated by our previous formula
(Loop Count(Loop Controler)*Number of Threads*Loop Count(group))
2. Average: Average response time.
3. Median: median, 50% user response time.
4. Line: 90% user response time.
5. Min: Minimum response time.
6. Max: Maximum response time.
7. Error%: The number of requests with errors/total number of requests in this test
8. Throughput: throughput, which means the number of completed requests per second.
9. KB/Sec: The amount of data received from the server per second (only received).
Nine, Linux view program operation
1、Top
The top command is a commonly used performance analysis tool under Linux, which can display the resource occupancy status of each process in the system in real time, similar to the task manager of Windows.
top displays the current process and other conditions of the system. It is a dynamic display process, that is, the current state can be constantly refreshed by the user's keystrokes. If the command is executed in the foreground, it will monopolize the foreground until the user terminates the program. More accurately The top command provides real-time monitoring of the status of the system processor. It will display a list of the most "sensitive" tasks for the CPU in the system. This command can sort tasks by CPU usage, memory usage and execution time; Many features can be set through interactive commands or in personal customization files.
In the Linux system, the top command can be said to be the most convenient tool for analyzing system performance, and top is also an interactive tool; through the top command, you can clearly understand the process information being executed, including process ID, memory usage, CPU usage, etc. . In fact, it is similar to the task manager of the window.
2. Check the CPU usage
sar -u 1 5
Means to collect once every 1 second, a total of 5 collections.
This command can check the CPU usage according to the settings in the actual thread group.
[root@sss ~]# sar -u 1 5
Linux 3.10.0-957.10.1.el7.x86_64 (izuf633l0ge76tv5mzalpmz)      04/16/2019      _x86_64_        (1 CPU)

04:56:03 PM     CPU     %user     %nice   %system   %iowait    %steal     %idle
04:56:04 PM     all      0.00      0.00      0.00      0.00      0.00    100.00
04:56:05 PM     all      0.00      0.00      0.00      0.00      0.00    100.00
04:56:06 PM     all      0.99      0.00      0.99      0.00      0.00     98.02
04:56:07 PM     all      0.00      0.00      0.00      0.00      0.00    100.00
04:56:08 PM     all      0.00      0.00      0.00      0.00      0.00    100.00
Average:        all      0.20      0.00      0.20      0.00      0.00     99.60
3. Check the memory usage
free -m

1352/1838 is the memory usage.
10. How does Linux count the CPU utilization of a process
In the Linux /proc file system, you can see the time slices consumed by all CPUs since the start; for a process, you can also see the time slices consumed by the process. This is a cumulative value that can be output "non-blocking". Obtaining two statistics at a certain time interval can calculate the process CPU utilization during this period.
So, is there a simple, non-blocking way to get the CPU utilization of a process? The answer is: "No." Here is a very appropriate analogy: "It's like someone gave you a photo and asked you to answer the speed of the car in the photo."
1. /proc/stat counts the total CPU consumption
To calculate the total CPU consumption, you can use the following shell command:
cat /proc/stat|grep "cpu "|awk '{for(i=2;i<=NF;i++)j+=$i;print "cpu_total_slice " j;}'
cpu_total_slice 19208187744
2. The CPU time slice consumed by the process
In the proc file system, the time slice consumed by the process can be obtained through /proc/[pid]/stat. The 14th, 15th, 16th, and 17th columns of the output correspond to the process user-mode CPU consumption, kernel-mode consumption, and user-mode waiting respectively. The consumption of the child process, the consumption of the kernel mode waiting for the child process (man proc). So the CPU consumption of the process can use the following command:
cat /proc/9583/stat|awk '{print "cpu_process_total_slice " $14+$15+$16+$17}'
cpu_process_total_slice 1068099
3. "Non-blocking" computing process CPU utilization
It can also be seen from here that there is no such thing as a CPU utilization rate at a certain time, and it is impossible to obtain the CPU utilization rate at a certain time. This is like the concept of "speed" in physics. Without the concept of speed at a certain moment, speed must be within a certain period of time. Then, to calculate the CPU utilization of a certain process "non-blocking", you need to take two event intervals for calculation, and the operation of these two event intervals can be non-blocking. The calculation method is as follows:
At time A, calculate the total CPU time slice consumption of the operating system total_cpu_slice_A; calculate the total CPU time slice consumption of the process; total_process_slice_A;
At time B, calculate the total CPU time slice consumption of the operating system total_cpu_slice_B; calculate the total CPU time slice consumption of the process; total_process_slice_B.
At time B, the CPU utilization of the process during this period can be calculated "non-blocking":
100%*(total_process_slice_B-total_process_slice_A)/(total_cpu_slice_B-total_cpu_slice_A)
11. Common problems in the use of JMeter
1. Why is the peak value in Response Times Over Time different from the maximum value in the aggregate report?
Because the point in Response Times Over Time is a concept of time, it represents the average response time of a request within a period of time, and the maximum value in the aggregate report represents the maximum response time of a request, so the response time The peak value does not match the maximum value in the aggregate report.
2. How many points are in the Response Times Over Time graph, and what is the relationship with the number of requests?
The point in Response Times Over Time is a concept of time, which can be set in the setting. A point is recorded every 500ms. This point represents the average response time of the request during this period.
12. The relationship between CPU usage and CPU idle time?
Multitasking operation uses the CPU in time slices. For example, process A occupies 10ms, process B occupies 30ms, and then idle 60ms, then process A occupies 10ms, process B occupies 30ms, and idle 60ms; if it is all for a period of time So, then the CPU usage during this period of time is 40%.
The CPU's response to the thread is not continuous, and it usually automatically interrupts the thread after a period of time. When the number of unresponsive threads increases, the CPU usage will continue to increase.
Highlights from previous issues:
Summary of Java knowledge system (2021 version)
Summary of basic knowledge of Java multithreading (absolutely classic)
Super detailed springBoot study notes
Summary of common data structures and algorithms
Java design patterns: a comprehensive analysis of 23 design patterns (super detailed)
Summary of Java interview questions (with answers)
reference:
https://www.cnblogs.com/imyalost/p/7751981.html
https://www.cnblogs.com/caiwenjing/p/8694968.html
https://www.cnblogs.com/yuyue2014/p/4789087.html