Performance optimization is the basic tier Internet companies such as BAT programmers the necessary skills, complete the following as we announced a complete performance optimization and methods: web site contains tuning, database, JVM tuning, architecture tune Excellence program.
First: Web Site Tuning
1, minimize HTTP requests: Picture Merge (css sprites), Js script file merge, css file merge.
2, to reduce DNS queries
3, the top of the page on the css, js placed on the bottom of the page
4, compressed js and css
Reduce the file size, removing unnecessary whitespace character format, the comment (i.e., the code format)
5, the js and css extracted in an external file
This one should be applied flexibly to js and css to extract advantage in external files are: to reduce the volume of html, css and js improve the reusability and improve the maintainability of the future
Disadvantages: increase the http request, but this can be resolved by caching.
Under what circumstances would write js and css in the page it can be divided into several cases: js and css code is relatively small; this page is not likely to visit
6, to avoid redirection
Redirects user requests a page that is being transferred to another place, the browser requests a page request to the service, the server tells the browser requests a page has been moved to another page, and tell another page address, the browser then sends request to the redirect address. This will increase the number of round trips between the server and browser, affect site performance.
Redirection status codes are: 301 302 temporary redirection permanent redirection. 304 not modified not really redirect, which is used to tell the file browser to get the request in the cache, to avoid re-download.
7. Remove duplicate scripts
8, using ajax cache
ajax get and post method:
As long as the browser get request, the browser will use the cache, a request for the same address, the server 304 sends a status code to the browser, the browser will use the data cache
post a request to be executed every time the browser does not cache
9, using Gzip compression
10, using a CDN (content delivery network)
Second: Database Tuning
Tuning database, generally divided into the following three parts:
1.SQL Tuning: mainly concentrated in the index, and large data reduction across the table join query.
2. The end database schema design optimization:
Separated read write operation of the database, the database side to solve the bottleneck problem by connection pool vertical resolution and horizontal resolution (sub-library sub-table) by.
3. The connection pool tuning
By principle familiar connection pool, as well as the specific monitoring data connection pool to continue debugging the final connection pool parameters.
Third: by reducing the cache back-end pressure
Currently distributed cache is relatively mature, the common redis, memcached distributed tair and Taobao and other open source.
Selection considerations
If the amount of data is small and does not grow and empty (which can lead to frequent garbage collection) frequently, you can select the local cache. Specifically, then, if you need some support policies (such as the cache is full of eviction policy), you can consider Ehcache; if not required, may be considered HashMap; such as the need to consider multi-threaded scenarios can be considered ConcurentHashMap.
Whether the cache is full, the cache is full of how to do?
For a cache service, in theory, with the increasing number of cached data, with limited capacity, the cache is certainly one day be full. how to respond?
① to caching service, select the appropriate cache eviction algorithm, such as the most common LRU.
② capacity for the current settings, set the appropriate alert value, such as 10G cache, when the cache data 8G reached when the alarm began to advance to troubleshoot problems or expansion.
③ no need to give some long-term preservation of the key, try to set an expiration time.
Fourth: the transformation of asynchronous data request
scenes to be used
Users do not care about or the user does not need to immediately get the result of the processing of these things, this is more suitable for handling asynchronous manner, the principle here is that it can be asynchronous asynchronous.
Common practice
Thread a practice, it is to open up extra thread, where you can open up extra thread or a thread pool using the practice adopted in the IO thread (process request response) than the corresponding task to deal with, so that response in the IO thread to return.
If the amount of data processing tasks designed asynchronous thread is huge, it can be introduced into blocking queue BlockingQueue for further optimization. This is done so that a group of asynchronous threads continue to throw blocking queue data, then additional processing thread from a circulating batch data to take a number of preset size from the queue to batch processing (for example, to send a batch of remote services request), thereby further improving performance.
Another approach is to use Message Queue (MQ) middleware services, MQ is inherently asynchronous.
Fifth: JVM Tuning
When tune?
Some machines key indicators (gc time, gc count, the memory size of each generational change, the machine Load value and CPU usage, JVM threads, etc.) of the alarm monitoring by the monitoring system may look gc log and the like jstat performance data and experience some of the key request command output interface, combined with online service JVM process, basically you can locate the JVM whether the current problems, and the need for tuning.
Tuning Tools:
Jconsole,jProfile,VisualVM
Jconsole: jdk own, simple function, the system may be used in certain load conditions. There are very detailed tracking of garbage collection algorithms. Detailed reference here
JProfiler: commercial software, you need to pay. Powerful. Detailed reference here
VisualVM: JDK comes, powerful, and JProfiler similar. recommend.
How to tune?
Memory release was observed, the collection class check, the object tree
These above tuning tools provide powerful, but in general are generally divided into the following categories feature
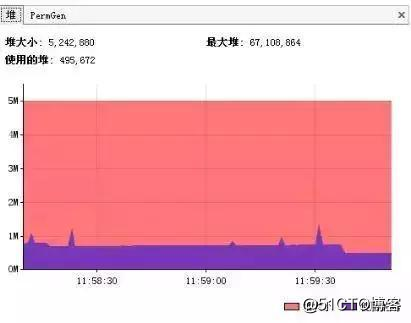
Heap View
View the heap space allocation (the young generation, old generation, permanent generation distribution)
Performance optimization is the basic tier Internet companies such as BAT programmers the necessary skills, complete the following as we announced a complete performance optimization and methods: web site contains tuning, database, JVM tuning, architecture tune Excellence program.
First: Web Site Tuning
1, minimize HTTP requests: Picture Merge (css sprites), Js script file merge, css file merge.
2, to reduce DNS queries
3, the top of the page on the css, js placed on the bottom of the page
4, compressed js and css
Reduce the file size, removing unnecessary whitespace character format, the comment (i.e., the code format)
5, the js and css extracted in an external file
This one should be applied flexibly to js and css to extract advantage in external files are: to reduce the volume of html, css and js improve the reusability and improve the maintainability of the future
Disadvantages: increase the http request, but this can be resolved by caching.
Under what circumstances would write js and css in the page it can be divided into several cases: js and css code is relatively small; this page is not likely to visit
6, to avoid redirection
Redirects user requests a page that is being transferred to another place, the browser requests a page request to the service, the server tells the browser requests a page has been moved to another page, and tell another page address, the browser then sends request to the redirect address. This will increase the number of round trips between the server and browser, affect site performance.
Redirection status codes are: 301 302 temporary redirection permanent redirection. 304 not modified not really redirect, which is used to tell the file browser to get the request in the cache, to avoid re-download.
7. Remove duplicate scripts
8, using ajax cache
ajax get and post method:
As long as the browser get request, the browser will use the cache, a request for the same address, the server 304 sends a status code to the browser, the browser will use the data cache
post a request to be executed every time the browser does not cache
9, using Gzip compression
10, using a CDN (content delivery network)
Second: Database Tuning
Tuning database, generally divided into the following three parts:
1.SQL Tuning: mainly concentrated in the index, and large data reduction across the table join query.
2. The end database schema design optimization:
Separated read write operation of the database, the database side to solve the bottleneck problem by connection pool vertical resolution and horizontal resolution (sub-library sub-table) by.
3. The connection pool tuning
By principle familiar connection pool, as well as the specific monitoring data connection pool to continue debugging the final connection pool parameters.
Third: by reducing the cache back-end pressure
Currently distributed cache is relatively mature, the common redis, memcached distributed tair and Taobao and other open source.
Selection considerations
If the amount of data is small and does not grow and empty (which can lead to frequent garbage collection) frequently, you can select the local cache. Specifically, then, if you need some support policies (such as the cache is full of eviction policy), you can consider Ehcache; if not required, may be considered HashMap; such as the need to consider multi-threaded scenarios can be considered ConcurentHashMap.
Whether the cache is full, the cache is full of how to do?
For a cache service, in theory, with the increasing number of cached data, with limited capacity, the cache is certainly one day be full. how to respond?
① to caching service, select the appropriate cache eviction algorithm, such as the most common LRU.
② capacity for the current settings, set the appropriate alert value, such as 10G cache, when the cache data 8G reached when the alarm began to advance to troubleshoot problems or expansion.
③ no need to give some long-term preservation of the key, try to set an expiration time.
Fourth: the transformation of asynchronous data request
scenes to be used
Users do not care about or the user does not need to immediately get the result of the processing of these things, this is more suitable for handling asynchronous manner, the principle here is that it can be asynchronous asynchronous.
Common practice
Thread a practice, it is to open up extra thread, where you can open up extra thread or a thread pool using the practice adopted in the IO thread (process request response) than the corresponding task to deal with, so that response in the IO thread to return.
If the amount of data processing tasks designed asynchronous thread is huge, it can be introduced into blocking queue BlockingQueue for further optimization. This is done so that a group of asynchronous threads continue to throw blocking queue data, then additional processing thread from a circulating batch data to take a number of preset size from the queue to batch processing (for example, to send a batch of remote services request), thereby further improving performance.
Another approach is to use Message Queue (MQ) middleware services, MQ is inherently asynchronous.
Fifth: JVM Tuning
When tune?
Some machines key indicators (gc time, gc count, the memory size of each generational change, the machine Load value and CPU usage, JVM threads, etc.) of the alarm monitoring by the monitoring system may look gc log and the like jstat performance data and experience some of the key request command output interface, combined with online service JVM process, basically you can locate the JVM whether the current problems, and the need for tuning.
Tuning Tools:
Jconsole,jProfile,VisualVM
Jconsole: jdk own, simple function, the system may be used in certain load conditions. There are very detailed tracking of garbage collection algorithms. Detailed reference here
JProfiler: commercial software, you need to pay. Powerful. Detailed reference here
VisualVM: JDK comes, powerful, and JProfiler similar. recommend.
How to tune?
Memory release was observed, the collection class check, the object tree
These above tuning tools provide powerful, but in general are generally divided into the following categories feature
Heap View
View the heap space allocation (the young generation, old generation, permanent generation distribution)
performance optimization is the basic tier Internet companies such as BAT programmers the necessary skills, the following is a complete performance optimization and complete all method revealed: Includes web sites tuning, database, JVM tuning, architecture tune Excellence program.
First: Web Site Tuning
1, minimize HTTP requests: Picture Merge (css sprites), Js script file merge, css file merge.
2, to reduce DNS queries
3, the top of the page on the css, js placed on the bottom of the page
4, compressed js and css
Reduce the file size, removing unnecessary whitespace character format, the comment (i.e., the code format)
5, the js and css extracted in an external file
This one should be applied flexibly to js and css to extract advantage in external files are: to reduce the volume of html, css and js improve the reusability and improve the maintainability of the future
Disadvantages: increase the http request, but this can be resolved by caching.
Under what circumstances would write js and css in the page it can be divided into several cases: js and css code is relatively small; this page is not likely to visit
6, to avoid redirection
Redirects user requests a page that is being transferred to another place, the browser requests a page request to the service, the server tells the browser requests a page has been moved to another page, and tell another page address, the browser then sends request to the redirect address. This will increase the number of round trips between the server and browser, affect site performance.
Redirection status codes are: 301 302 temporary redirection permanent redirection. 304 not modified not really redirect, which is used to tell the file browser to get the request in the cache, to avoid re-download.
7. Remove duplicate scripts
8, using ajax cache
ajax get and post method:
As long as the browser get request, the browser will use the cache, a request for the same address, the server 304 sends a status code to the browser, the browser will use the data cache
post a request to be executed every time the browser does not cache
9, using Gzip compression
10, using a CDN (content delivery network)
Second: Database Tuning
Tuning database, generally divided into the following three parts:
1.SQL Tuning: mainly concentrated in the index, and large data reduction across the table join query.
2. The end database schema design optimization:
Separated read write operation of the database, the database side to solve the bottleneck problem by connection pool vertical resolution and horizontal resolution (sub-library sub-table) by.
3. The connection pool tuning
By principle familiar connection pool, as well as the specific monitoring data connection pool to continue debugging the final connection pool parameters.
Third: by reducing the cache back-end pressure
Currently distributed cache is relatively mature, the common redis, memcached distributed tair and Taobao and other open source.
Selection considerations
If the amount of data is small and does not grow and empty (which can lead to frequent garbage collection) frequently, you can select the local cache. Specifically, then, if you need some support policies (such as the cache is full of eviction policy), you can consider Ehcache; if not required, may be considered HashMap; such as the need to consider multi-threaded scenarios can be considered ConcurentHashMap.
Whether the cache is full, the cache is full of how to do?
For a cache service, in theory, with the increasing number of cached data, with limited capacity, the cache is certainly one day be full. how to respond?
① to caching service, select the appropriate cache eviction algorithm, such as the most common LRU.
② capacity for the current settings, set the appropriate alert value, such as 10G cache, when the cache data 8G reached when the alarm began to advance to troubleshoot problems or expansion.
③ no need to give some long-term preservation of the key, try to set an expiration time.
Fourth: the transformation of asynchronous data request
scenes to be used
Users do not care about or the user does not need to immediately get the result of the processing of these things, this is more suitable for handling asynchronous manner, the principle here is that it can be asynchronous asynchronous.
Common practice
Thread a practice, it is to open up extra thread, where you can open up extra thread or a thread pool using the practice adopted in the IO thread (process request response) than the corresponding task to deal with, so that response in the IO thread to return.
If the amount of data processing tasks designed asynchronous thread is huge, it can be introduced into blocking queue BlockingQueue for further optimization. This is done so that a group of asynchronous threads continue to throw blocking queue data, then additional processing thread from a circulating batch data to take a number of preset size from the queue to batch processing (for example, to send a batch of remote services request), thereby further improving performance.
Another approach is to use Message Queue (MQ) middleware services, MQ is inherently asynchronous.
Fifth: JVM Tuning
When tune?
Some machines key indicators (gc time, gc count, the memory size of each generational change, the machine Load value and CPU usage, JVM threads, etc.) of the alarm monitoring by the monitoring system may look gc log and the like jstat performance data and experience some of the key request command output interface, combined with online service JVM process, basically you can locate the JVM whether the current problems, and the need for tuning.
Tuning Tools:
Jconsole,jProfile,VisualVM
Jconsole: jdk own, simple function, the system may be used in certain load conditions. There are very detailed tracking of garbage collection algorithms. Detailed reference here
JProfiler: commercial software, you need to pay. Powerful. Detailed reference here
VisualVM: JDK comes, powerful, and JProfiler similar. recommend.
How to tune?
Memory release was observed, the collection class check, the object tree
These above tuning tools provide powerful, but in general are generally divided into the following categories feature
Heap View
View the heap space allocation (the young generation, old generation, permanent generation distribution)
Provide immediate garbage collection
Garbage monitoring (time monitoring the recall)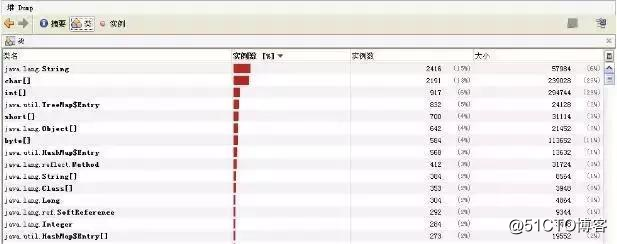
View stack within classes, objects View: The number, type, etc.
Object View citations
With Heap View function, we generally can successfully address the following issues:
- the size of the old generation of the young generation division is reasonable
- Memory Leak
- garbage collection algorithm set is reasonable
Line Monitor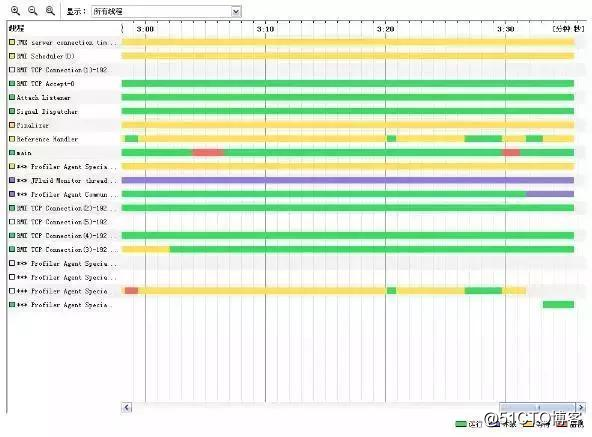
Thread information monitoring: the number of system threads.
Thread Status Monitoring: each thread in what kind of state
Dump thread detail: the operation of the internal threads View
Deadlock checking
Hot Spot Analysis
CPU hot spots: the inspection system which method takes a lot of CPU time
Memory hot spots: the maximum number of checks which objects (objects survive a certain time statistics and destroying objects together) in the system
These two things is helpful for system optimization. We can find the hot spots, there are bottlenecks in the system of targeted search and system optimization, rather than aimlessly optimized all codes.
Snapshot
A snapshot is a system to run at a time of a freeze. When we tune, it is impossible to keep track of all systems with the eyes change, depending on the snapshot feature, we can carry out two different run-time system, an object (or class, thread, etc.) is different, in order to quickly find the problem
For example, I want to check the system for garbage collection in the future, whether the recovered object is also missing a down. Well, I can garbage collected before and after, respectively, a heap snapshot of the situation, then the object contrast to the situation two snapshots.
Memory leak check
Memory leaks are relatively common problem, but the solution is relatively common, where you can focus on that issue, and thread, hot spots issue is the analysis of specific issues.
Memory leaks can generally be understood as a system resource (in all aspects of resources, heap, stack, thread, etc.) in case of misuse, leading after use of resources can not be recovered (or no recovery), resulting in a new resource allocation request could not be completed , cause system errors.
Memory leaks harm the system is relatively large, because he can directly lead to the collapse of the system.
Performance Tuning Summary:
Most major performance bottleneck bottleneck site in the database side, so the tuning is always operating along how to reduce the pressure on the back end, the database side bottlenecks often result in an avalanche of end applications (for example: sql query is too long, long transactions) and so on, so it is necessary to promptly resolve the back-end performance.
1. separate read and write, vertical split, horizontal split reducing the pressure on the rear end of the database.
2. By optimizing the sql statement, indexing, query time to shorten the sql.
2. to address a read operation on the pictures, files, etc. through caching and CDN, to avoid pressure on the database.
3. By optimizing the web end, js, css and other compressed improve large file read time as possible upon CDN.
4. There is a focus on monitoring: for JVM, thread, sql query time and other health indicators on the line real-time monitoring, timely detection of bottlenecks by monitoring to optimization.