
Foreword
Ali Baba console provides only basic capabilities for presentation and workflow Sentinel, and not dependent on the components necessary for production environments, such as persistent back-end database, reliable configuration center. Sentinel present memory state using the stored rules and monitoring data, monitoring the maximum storage time of 5 minutes, restart the console data loss.
Enterprise Edition
Here recommend Ali cloud the official version, AHAS Sentinel console Ali cloud version of Sentinel console, the console provides enterprise-class services, including:
- Request to view real-time link
- There are all kinds of cool monitoring chart
- Reliable real-time monitoring and historical monitoring data query, no self-storage, pull
- Dynamic rules management / push, without self-configure an external data source
Free version, can provide free credit five nodes. Pro opened to enjoy unlimited node limit.
Pro no connection restriction instance, a day after the opening of the first five demoted node is not limiting charging, excess charged accordingly by 3 / day / instance.
Thinking
The official document also provides a guideline, if the need to monitor data persistence features, you can extend self-fulfilling MetricsRepository Interface (version 0.2.0), then registered as Spring Bean and specify the bean name to correspond by @Qualifier annotation in the corresponding position. MetricsRepository interface defines the following functions:
save and saveAll: storing data corresponding monitoring
queryByAppAndResourceBetween: query monitoring data for a resource of an application within a certain period of time
listResourcesOfApp: query all of the resources of an application
Wherein the default data type monitor MetricEntity, comprising an application name, time stamp, the resource name, the number of abnormal, by the number of requests, the number of rejected requests, the average response time and other information.
For storage monitoring data, the user needs according to their memory accuracy, to consider how to store monitoring data. Obviously we want to use the most popular database of timing InfluxDBsolutions, ask not what? Eyes closed enjoy it.
Selection
InfluxDBIs an open source distributed timing, events and metrics database. Using the Go language, no external dependencies.
Application: performance monitoring, application index, IOT sensor data and real-time analysis of the back-end storage.
Powerful SQL syntax class
Http built-in support for reading and writing using http
Based on the event: it supports arbitrary event data
Unstructured (modeless): may be any number of columns
Measurability: You can compute large amounts of data in real time
Sustained high concurrent writes, no update, data compression and storage, low query latency
Support min, max, sum, count, mean, median and a series of functions
Based on the time series, relating to the support of the correlation function of time (e.g., maximum, minimum, sum, etc.)
Reform
InfluxDB installation
First you have to have a database Influxdb recommended Docker installed, more can refer to the end of the text links.
Note that, starting from the 1.1.0 version is not recommended to use administrator interface will be removed in version 1.3.0. Disabled by default. If necessary, it can still be enabled by setting the following environment variables.
The following ports are important, by InfluxDBuse.
- 8086 HTTP API port
- 8083 administrator interface port (if enabled, not so that enabled seemingly 1.7.8), the official recommended
chronograf

With this command to generate a default configuration file:
docker run --rm influxdb influxd config > influxdb.confCreate and run a container:
docker run -d \
        -p 8086:8086 \
        -p 8083:8083 \
        -e INFLUXDB_ADMIN_ENABLED=true \
        -v $PWD/data:/var/lib/influxdb/ \
        -v $PWD/config/influxdb.conf:/etc/influxdb/influxdb.conf:ro \
        --name influx \
        influxdb -config /etc/influxdb/influxdb.conf
Production environment must be open permissions to verify, modify influxdb.conf configuration:
[http]
  enabled = true
  bind-address = ":8086"
  auth-enabled = true # 鉴权
Create a user:
# 进入容器
docker exec -it influx  /bin/sh
# 连接
influx
# 创建用户
CREATE USER admin with PASSWORD 'admin' WITH ALL PRIVILEGES
Exit sign back:
# 用户密码登录
influx -username admin -password admin
# 创建数据库
CREATE DATABASE sentinel_log
Sentinel console transformation
pom.xml introduced influxdb official open-source toolkit:
<dependency>
     <groupId>org.influxdb</groupId>
     <artifactId>influxdb-java</artifactId>
     <version>2.15</version>
</dependency>
Profile introduction:
# 自行替换 API 地址:端口
spring.influx.url=http://127.0.0.1:8086
spring.influx.user=admin
spring.influx.password=admin
spring.influx.database=sentinel_log
Configure Data Source:
/**
 * InfluxDb 配置
 * 创建者 爪哇笔记
 * 网址 https://blog.52itstyle.vip
 */
@Configuration
public class InfluxDbConfig {

    @Value("${spring.influx.url:''}")
    private String influxDBUrl;

    @Value("${spring.influx.user:''}")
    private String userName;

    @Value("${spring.influx.password:''}")
    private String password;

    @Value("${spring.influx.database:''}")
    private String database;

    @Bean
    public InfluxDB influxDB(){
        InfluxDB influxDB = InfluxDBFactory.connect(influxDBUrl, userName, password);
        try {
            /**
             * 异步插入:
             * enableBatch这里第一个是point的个数,第二个是时间,单位毫秒
             * point的个数和时间是联合使用的,如果满100条或者2000毫秒
             * 满足任何一个条件就会发送一次写的请求。
             */
            influxDB.setDatabase(database)
                    .enableBatch(100,2000, TimeUnit.MILLISECONDS);
        } catch (Exception e) {
            e.printStackTrace();
        } finally {
            influxDB.setRetentionPolicy("autogen");
        }
        influxDB.setLogLevel(InfluxDB.LogLevel.BASIC);
        return influxDB;
    }
}
MetricsRepository implement an interface, overriding implementations:
/**
 * 数据CURD
 * 创建者 爪哇笔记
 * 网址 https://blog.52itstyle.vip
 */
@Component("inInfluxdbMetricsRepository")
public class InInfluxdbMetricsRepository implements MetricsRepository<MetricEntity> {

    @Autowired
    public InfluxDB influxDB;

    @Override
    public synchronized void save(MetricEntity metric) {
       //省略代码,太长了,参考内存写法,参考 saveAll 这里是单条插入
    }

    @Override
    public synchronized void saveAll(Iterable<MetricEntity> metrics) {
        if (metrics == null) {
            return;
        }
        BatchPoints batchPoints = BatchPoints.builder()
                .tag("async", "true")
                .consistency(InfluxDB.ConsistencyLevel.ALL)
                .build();
        metrics.forEach(metric->{
            Point point = Point
                    .measurement("sentinelInfo")
                    //这里使用微妙、如果还有覆盖数据就使用纳秒,保证 time 和 tag 唯一就可以
                    .time(System.currentTimeMillis(), TimeUnit.MICROSECONDS)
                    .tag("app",metric.getApp())//tag 数据走索引
                    .addField("gmtCreate", metric.getGmtCreate().getTime())
                    .addField("gmtModified", metric.getGmtModified().getTime())
                    .addField("timestamp", metric.getTimestamp().getTime())
                    .addField("resource", metric.getResource())
                    .addField("passQps", metric.getPassQps())
                    .addField("successQps", metric.getSuccessQps())
                    .addField("blockQps", metric.getBlockQps())
                    .addField("exceptionQps", metric.getExceptionQps())
                    .addField("rt", metric.getRt())
                    .addField("count", metric.getCount())
                    .addField("resourceCode", metric.getResourceCode())
                    .build();
            batchPoints.point(point);
        });
        //批量插入
        influxDB.write(batchPoints);
    }

    @Override
    public synchronized List<MetricEntity> queryByAppAndResourceBetween(String app, String resource, long startTime, long endTime) {
       //省略代码,太长了,参考内存写法
    }

    @Override
    public synchronized List<String> listResourcesOfApp(String app) {
       //省略代码,太长了,参考内存写法
    }
}
They were modified MetricFetcherand MetricControllerin metricStoreinjection mode, used Influxdbto achieve:
/**
 * 注入
 * 创建者 爪哇笔记
 * 网址 https://blog.52itstyle.vip
 */
@Autowired
@Qualifier("inInfluxdbMetricsRepository")
private MetricsRepository<MetricEntity> metricStore;
Once configured, we restart the console, and then access the client project, if the console print the following data, the configuration was successful:
2019-09-21 19:47:25 [sentinel-dashboard-metrics-fetchWorker-thread-2] INFO  okhttp3.OkHttpClient - --> POST http://118.190.247.102:8086/write?db=sentinel_log&precision=n&consistency=all (486-byte body)
2019-09-21 19:47:25 [sentinel-dashboard-metrics-fetchWorker-thread-2] INFO  okhttp3.OkHttpClient - <-- 204 No Content http://118.190.247.102:8086/write?db=sentinel_log&precision=n&consistency=all (46ms, 0-byte body)
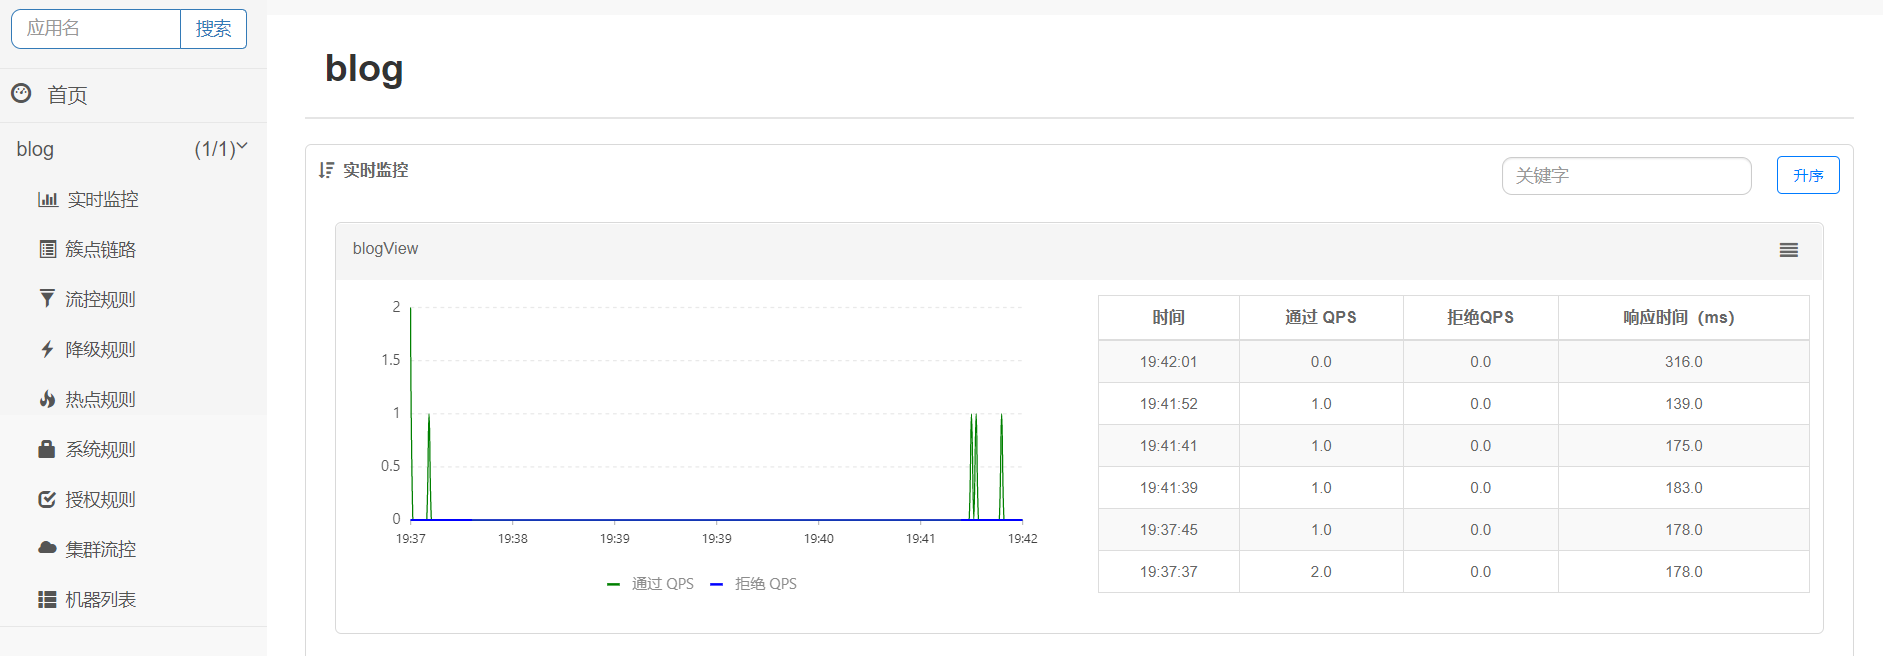
Multi-client access several items, then log in to view the console, the following effects appear, indicating successful transformation:
Precautions:
The official did not realize the front end of the search query time according to need self-realization
The default console real-time monitoring official inquiry was recently ranked one minute hot resources, see Methods
listResourcesOfAppReal-time monitoring of official right side of the console Table default query is a hot topic the last five minutes of access details, see Methods
queryTopResourceMetric
summary
For the official version of castration, flow control timing data storage database implementation of five minutes, for a production environment or helpful, such as real-time data analysis, focus resources, monitoring and early warning, and so on. Little friends can also produce based on actual demand combined Chronograf, Grafanamake more cool big screen monitor.
Source
https://gitee.com/52itstyle/sentinel-dashboard
reference
https://blog.52itstyle.vip/archives/4460/
https://hub.docker.com/_/influxdb
https://hub.docker.com/_/chronograf
https://github.com/influxdata/influxdb-java
https://github.com/influxdata/influxdb-python
https://help.aliyun.com/document_detail/97578.htm