
Foreword
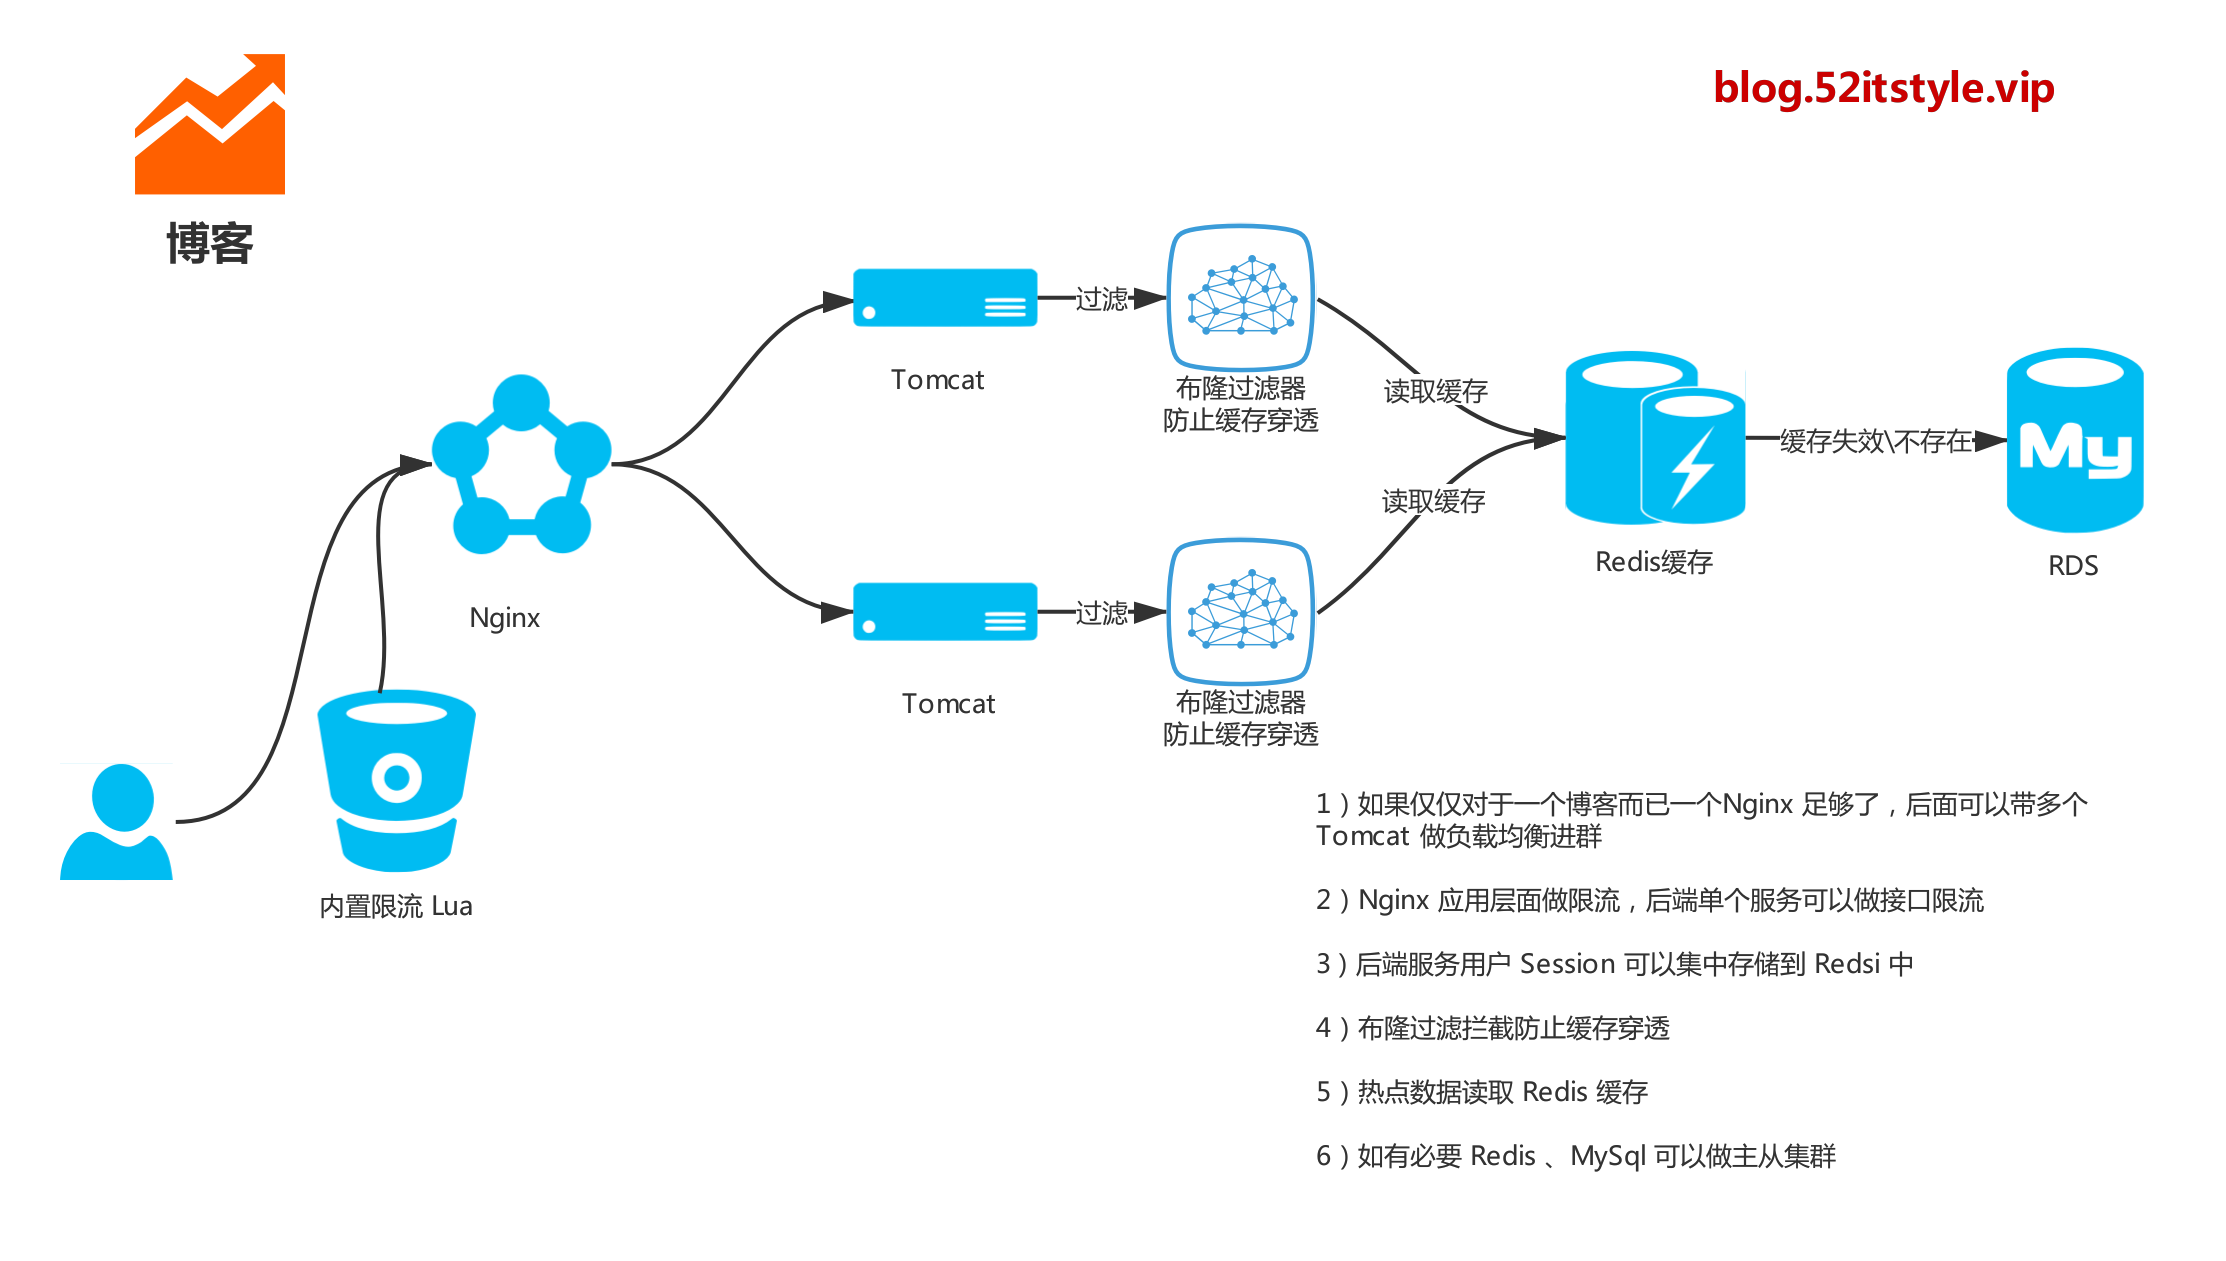
Hundred thousand Bowen ultimate architecture, we use Tomcat cluster, but this does not guarantee that the system will not go wrong, in order to ensure the stable operation of the system, we also need to Tomcat effective operation and maintenance control measures, problems will not or a long period of time will tell. The pot can be a little early in the morning no one wanted to back, one set up for this purpose based on the current following such a set of monitoring and early warning systems.
Chart
related software
- Nginx: proxy access Grafana
- Grafana: Visualization panel (Dashboard), has a very nice graphics and layout display
- Influxdb: open-source time series database for recording metrics, events and perform analysis
- Statistical data collection systems and services: Telegraf
- Docker: open-source application container engine that lets developers can package their applications as well as a portable container dependencies into
Monitoring Architecture
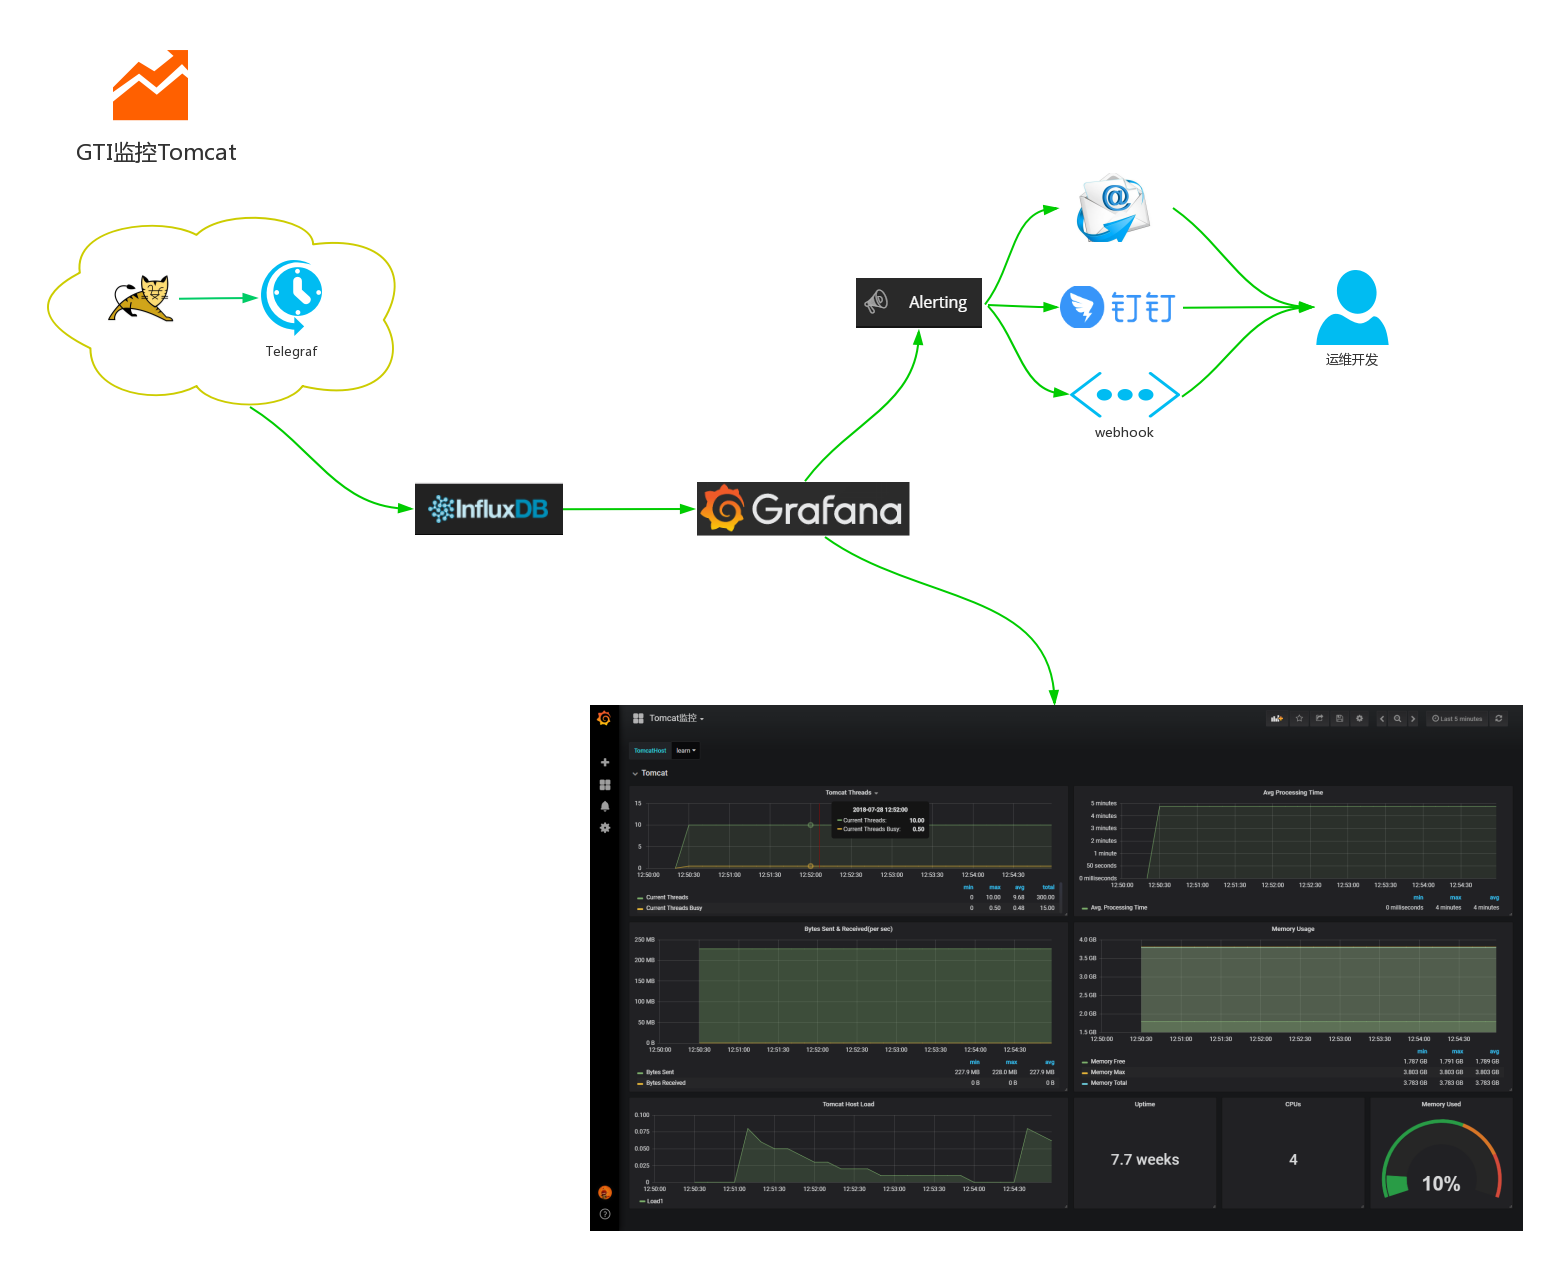
GTI monitoring and early warning systems, architectures Process Description:
- The first step: data collection, Telegraf data acquisition parameters Tomcat
- Data storage, Influxdb storage Telegraf acquisition: Step
- The third step: data visualization, Grafana monitor panel configuration Tomcat
- Step four: early warning notification, configure nails, mail warning
Installation configuration
Here only Grafana, Telegraf, Influxdb, Tomcat do the appropriate installation instructions, Nginx and Docker please refer to the information on their own.
Grafana
Grafana only one access panel visual data source, here for convenience, we choose Docker installation.
mkdir grafana
ID=$(id -u)
docker run -d --user $ID --name=grafana  --volume "$PWD/grafana:/var/lib/grafana" -p 3000:3000 grafana/grafana
# 如果生产环境配置,最好提前配置好域名
docker run -d --user $ID --name=grafana --volume "$PWD/data:/var/lib/grafana" -p 3000:3000 -e "GF_SERVER_ROOT_URL=http://monitor.52itstyle.vip" grafana/grafana
After successful execution, execute the following command:
docker psIf grafana run container appears the installation was successful.
Check container-related parameters:
docker inspect docker.io/grafana/grafanaenter:
docker exec -it grafana /bin/shGrafana grafana.ini default profile of the container in / etc / grafana, this file is not mapped out. However, you can create and run a container, re-create the copy run out of the container.
Parameter Description (here the interception of some key parameters):
##################### Grafana 几个重要的参数(参考一下) #####################
[paths]
# 存放临时文件、session以及sqlite3数据库的目录
;data = /var/lib/grafana

# 存放日志的地方
;logs = /var/log/grafana

# 存放相关插件的地方
;plugins = /var/lib/grafana/plugins

#################################### Server ####################################
[server]
# 默认协议 支持(http, https, socket)
;protocol = http

# 默认端口
;http_port = 3000

# 这里配置访问地址,如果使用了反向代理请配置域名,发送告警通知的时候作为访问地址
root_url = http://grafana.52itstyle.vip

#################################### Database ####################################
[database]

# 默认使用的数据库sqlite3,位于/var/lib/grafana目录下面
;path = grafana.db

#################################### Session ####################################
[session]
# session 存储方式,默认是file即可  Either "memory", "file", "redis", "mysql", "postgres", default is "file"
;provider = file

#################################### SMTP / Emailing ##########################
[smtp]
# 邮件服务器配置,自行修改配置
enabled = true
host = smtp.mxhichina.com:465
user = [email protected]
# If the password contains # or ; you have to wrap it with trippel quotes. Ex """#password;"""
password = 123456
;cert_file =
;key_file =
;skip_verify = false
from_address = [email protected]
# 这里不要设置中文,否则会发送失败
from_name = Grafana
Influxdb
Create and run a container
docker run -d -p 8083:8083 -p 8086:8086 -e ADMIN_USER="root" -e INFLUXDB_INIT_PWD="root" -e PRE_CREATE_DB="telegraf" --name influxdb tutum/influxdb:latestMeaning of each parameter:
-d:容器在后台运行

--name:容器名称

-e:指定环境变量,容器中可以使用该环境变量

-p:将容器内端口映射到宿主机端口,格式为 宿主机端口:容器内端口;8083是influxdb的web管理工具端口,8086是influxdb的HTTP API端口
After successful execution, execute the following command:
docker psIf the container appears stating influxdb run successfully installed.
Access address: http: // ip: 8083 /
Telegraph
docker pull telegrafThe telegraf Related copied to the destination host
docker cp telegraf:/etc/telegraf/telegraf.conf ./telegrafTomcat data collection:
If you want to monitor multiple Tomcat, here to configure multiple [[inputs.tomcat]] can, but be sure to configure different tags to identify.
[[inputs.tomcat]]
url = "http://192.168.1.190:8080/manager/status/all?XML=true"
# Tomcat访问账号密码 必须配置
username = "tomcat"
password = "tomcat"
timeout = "5s"
# 标识Tomcat名称、根据实际项目部署情况而定
[inputs.tomcat.tags]
host = "blog"

[[inputs.tomcat]]
url = "http://192.168.1.190:8081/manager/status/all?XML=true"
# Tomcat访问账号密码 必须配置
username = "tomcat"
password = "tomcat"
timeout = "5s"
# 标识Tomcat名称、根据实际项目部署情况而定
[inputs.tomcat.tags]
host = "bbs"
To collect data influxdb:
[[outputs.influxdb]]
# urls = ["udp://localhost:8089"] # UDP endpoint example
urls = ["http://localhost:8086"] # required,这个url改成自己host
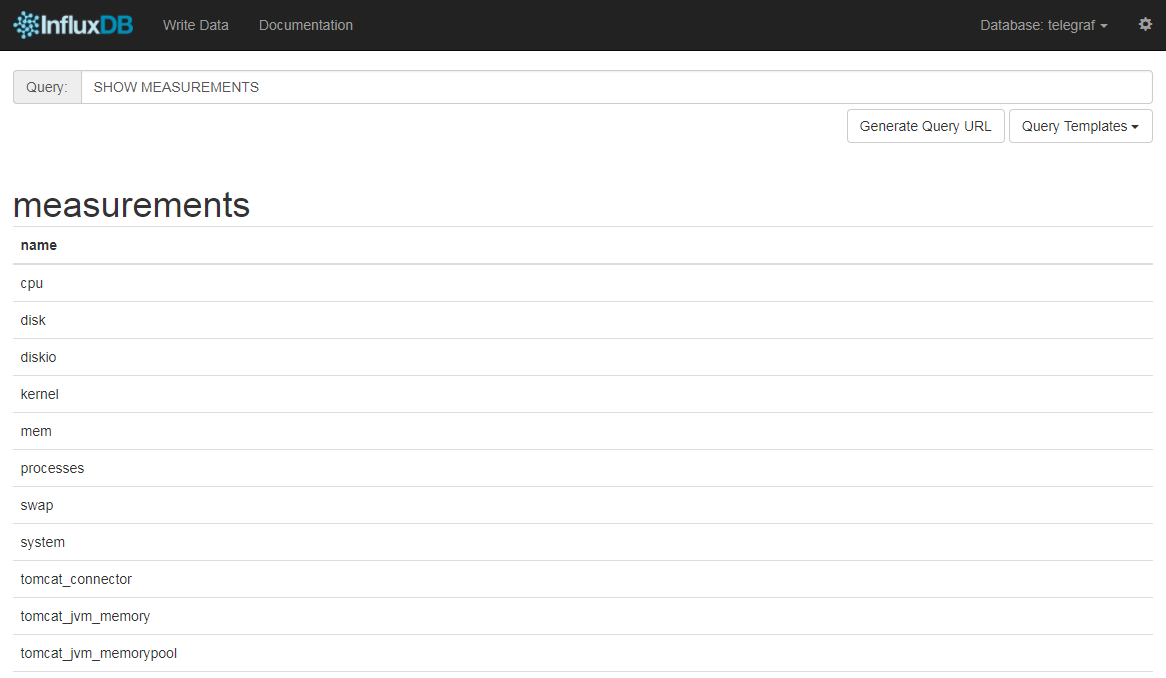
## The target database for metrics (telegraf will create it if not exists).
database = "telegraf" # 这个会在influx库创建一个库Copy the configuration file to the container:
docker cp telegraf.conf telegraf:/etc/telegraf/telegraf.confRestart telegraf Service:
docker restart dockerTomcat
Since telegraf collect relevant data you need to configure Tomcat access to, where we choose to do Tomcat7 configuration instructions.
Modify the tomcat-users.xml file located in the conf:
<tomcat-users>
<user username="tomcat" password="tomcat" roles="manager-gui,manager-script,manager-jmx,manager-status"/>
</tomcat-users>
Restart Tomcat container, go to the following address:
http://ip:8080/manager/status/all?XML=true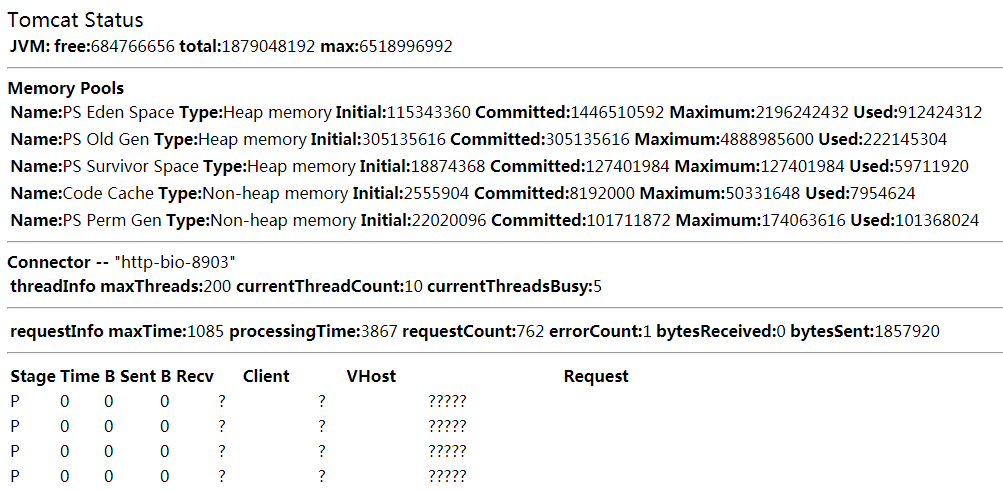
If the above screen appears, indicating successful configuration.
Monitoring Configuration
In turn start after Tomcat, Influxdb, Telegraf, Grafana complete, we enter Grafana backstage management configuration.
Influxdb configuration Source:
Select datasources / Add datasource
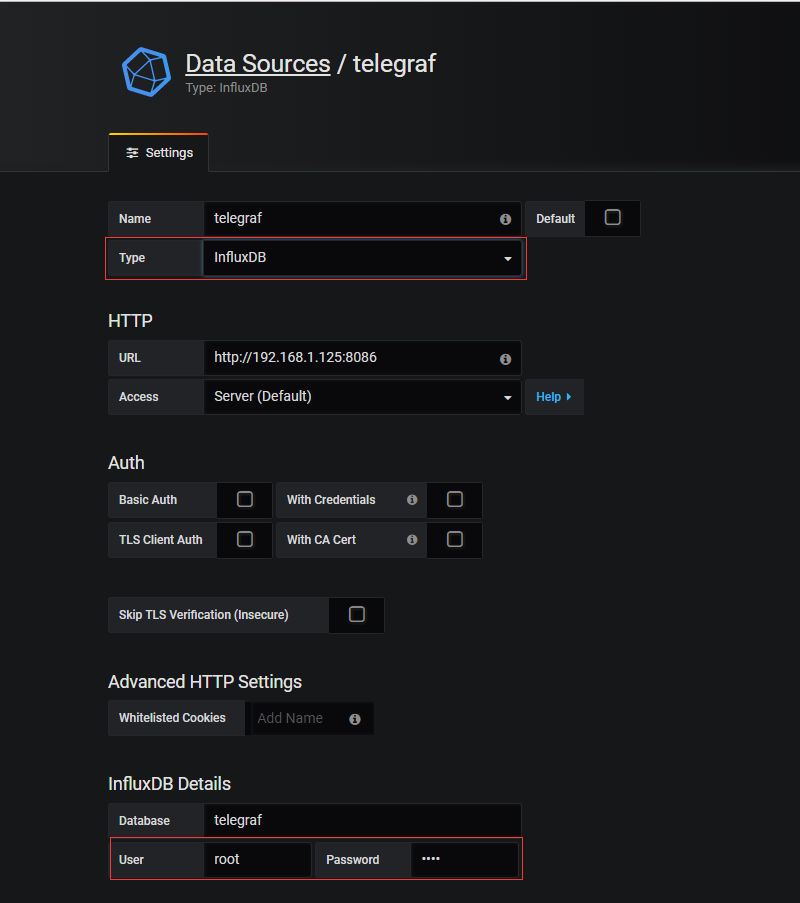
Enter the correct HTTP address and account password database, click Save, if the green prompt box appears, indicating successful configuration.
Configuring Tomcat dashboard:
Select the dashboard / import
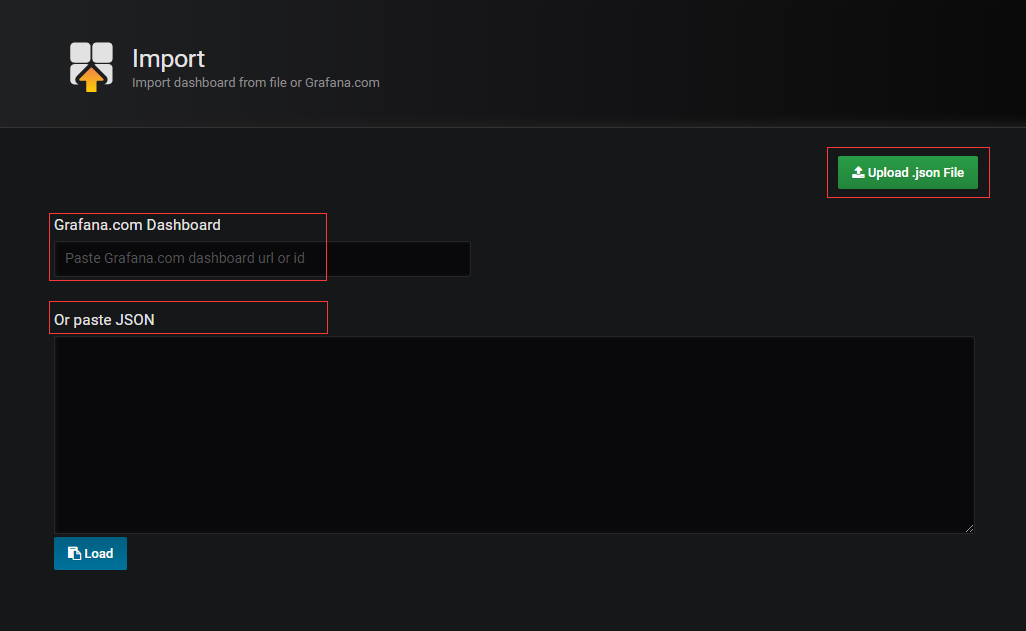
There are three ways to import panel:
- The official panel to select the input ID or URL
- Direct copy paste JSON format code
- Import third-party panel JSON file format
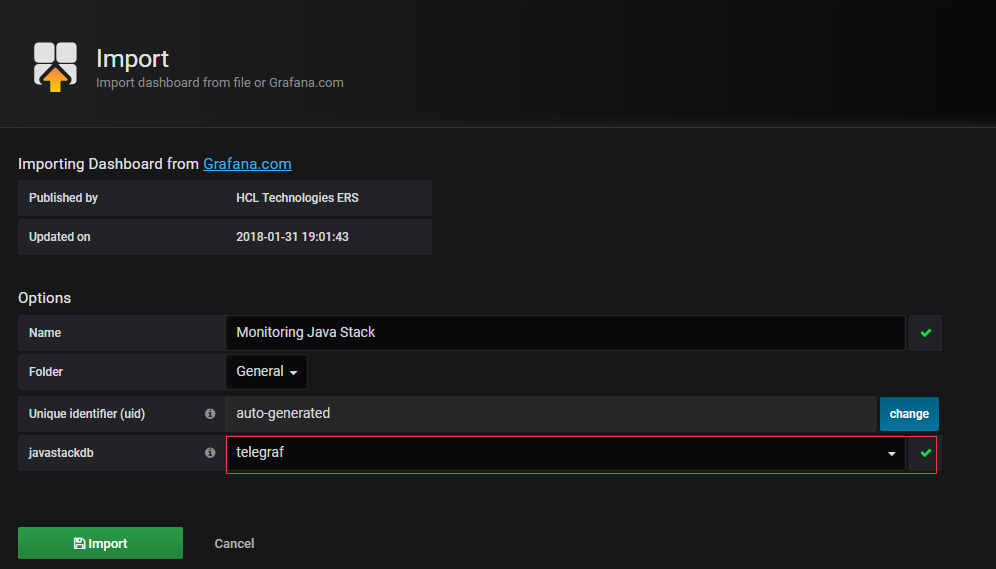
Here we import advance their own custom saved Tomcat monitoring panel, and click Import to save.
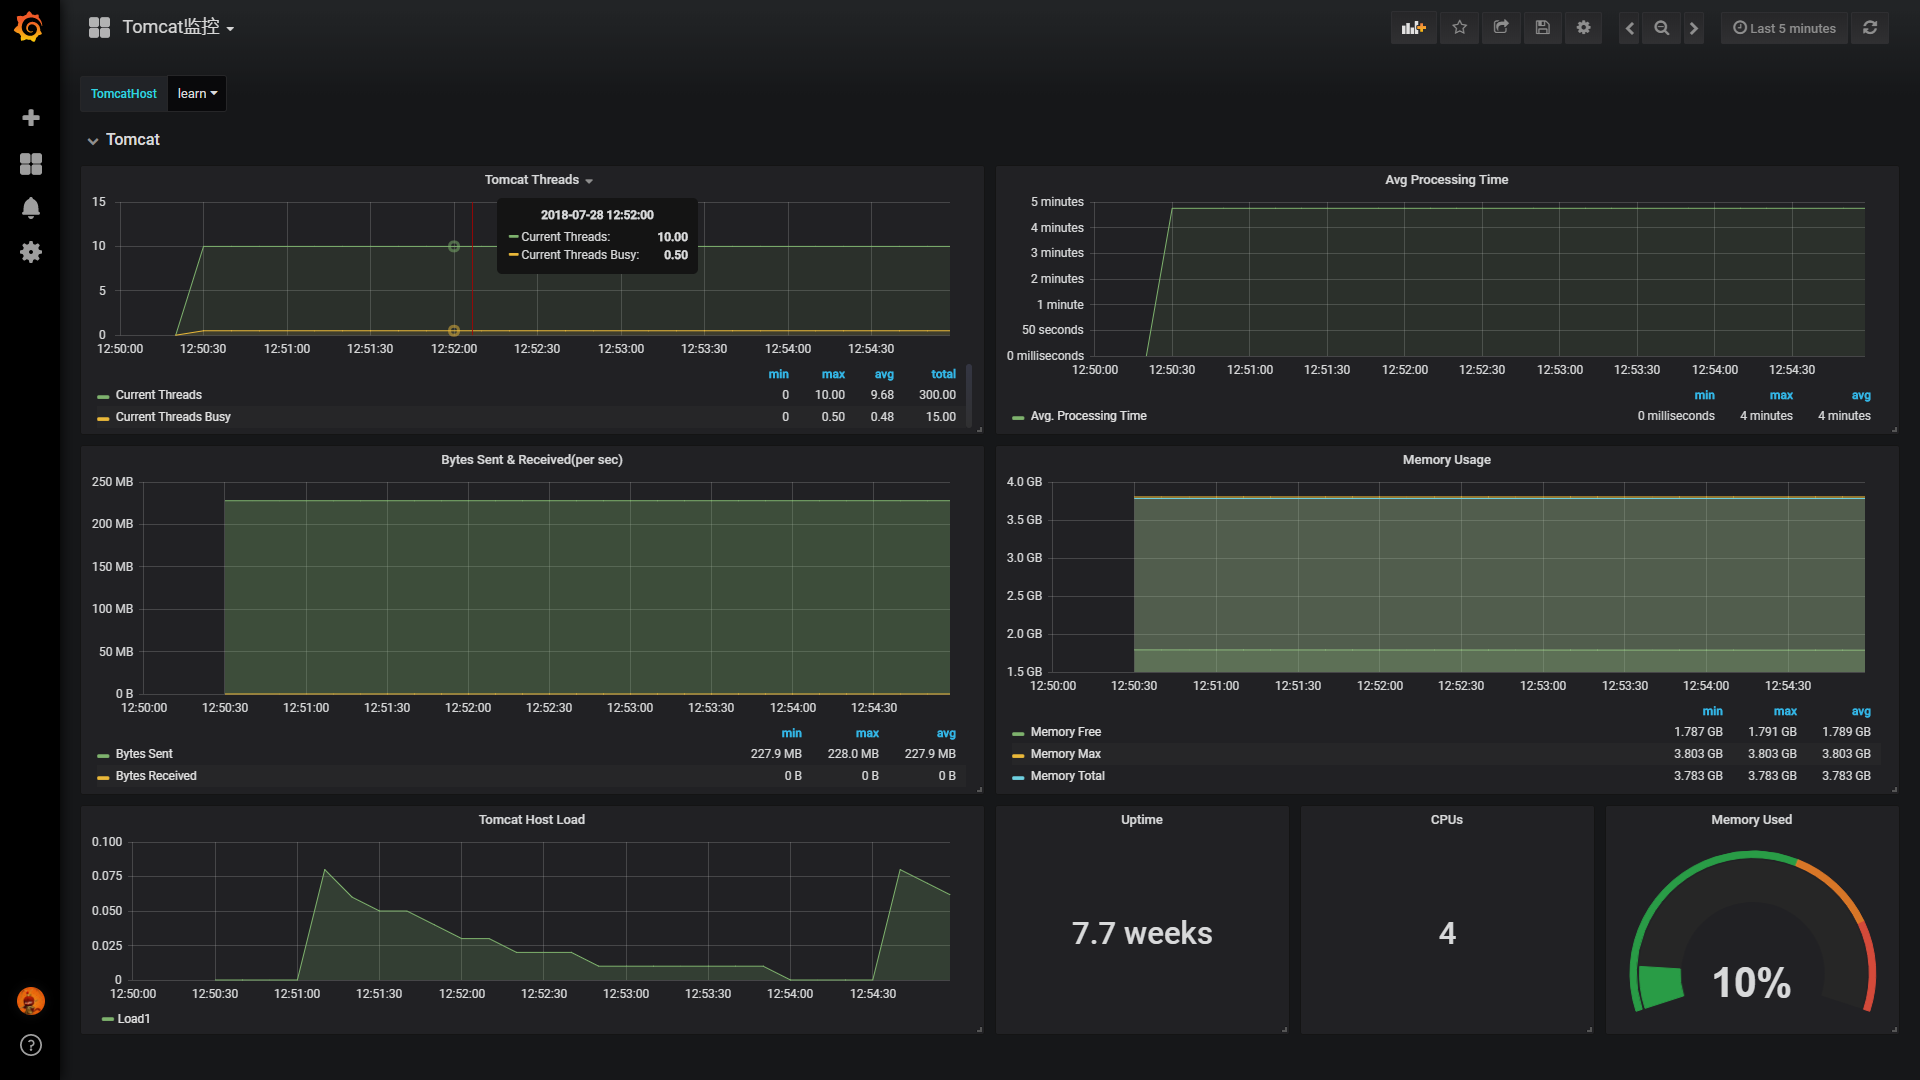
If nothing else, it will be like the following figure.
Alarm Configuration
Pre-done so much, our ultimate goal is to advance warning notice, to make appropriate adjustments before the system is ready to impending disaster. Here we are with a threshold number of threads Tomcat as a warning notice.
Click the thread panel - Select Edit:
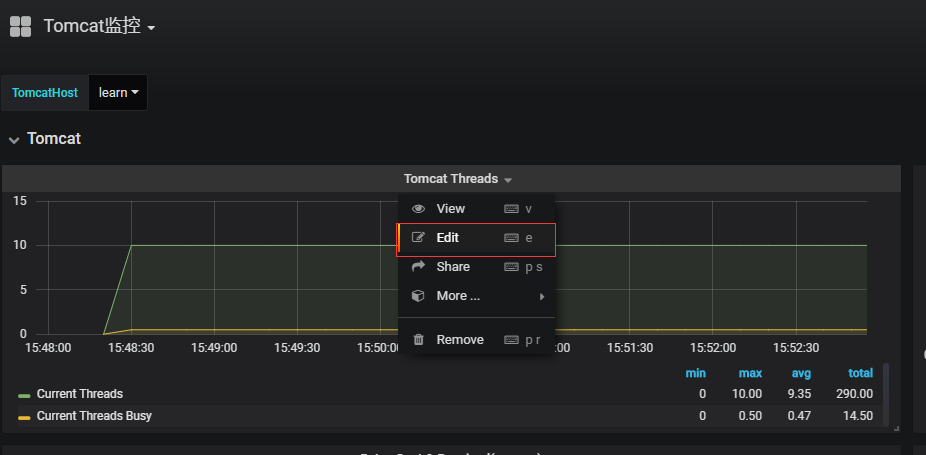
Configuration parameters:

1, Alert name, you can customize.
2, frequency of execution, where I chose to be tested once every 60s.
3, criteria, default is avg, here is the drop-down box, choose their own on demand.
4, query (A, 5m, now), the letter A represents the selected metrics provided in SQL, other arrangements may be selected in the metrics, but here is the radio. From now on behalf of 5m to five minutes before, namely that point before 5m as the starting point of time, now is the end point of time, in addition to where you can enter your own time manually.
5, set warning critical point, where manual input, and the same function 6, 6 may be moved manually, two operations are equivalent.
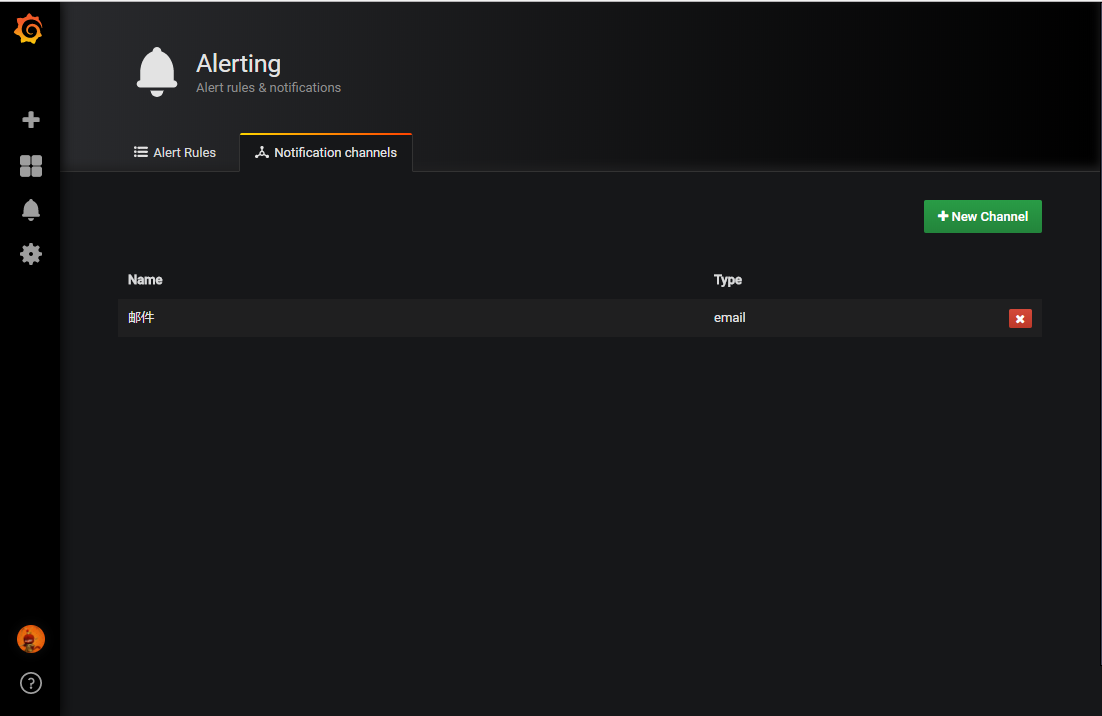
Configuration information and early warning notification methods:
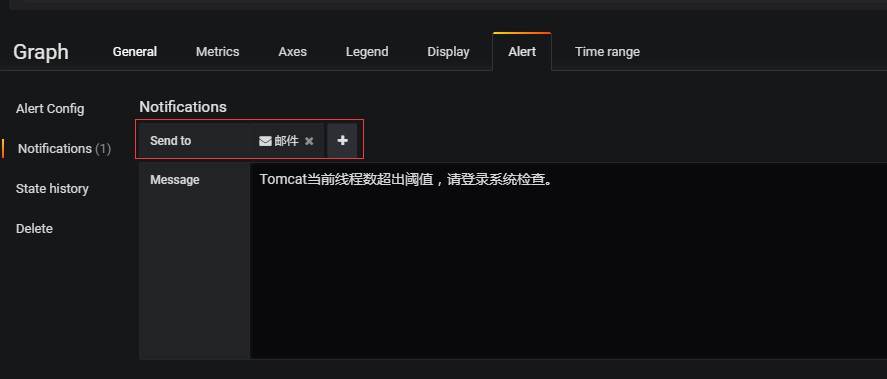
Here we chose the e-mail alert notifications, but you want to configure in advance, refer to the beginning grafana.ini in SMTP / Emailing relevant parameters.

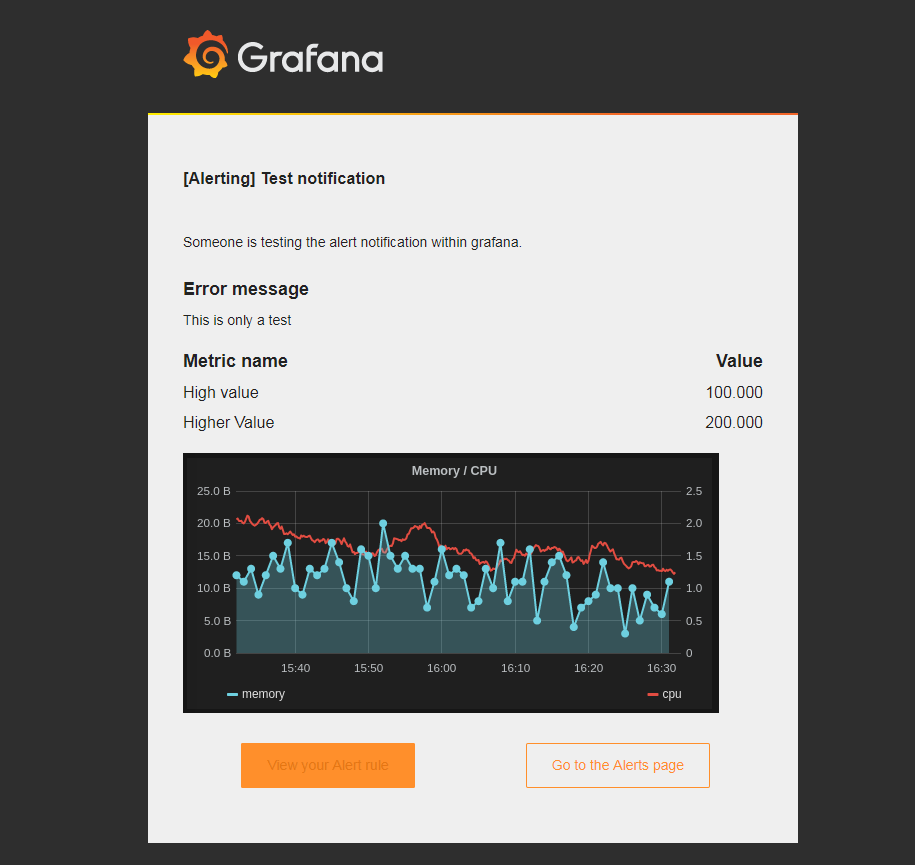
Click Send test, suggesting success will send a warning to the specified mailbox Demo:
to sum up
Reason, this one thing is very strong. Especially for small and medium companies, among a variety of mature open source group to build a set of perfectly integrated monitoring system, time costs, labor costs, technology costs can be minimized.
Reference Documents
We installation process, version may vary, the relevant page of the exhibition is inconsistent, but will not affect the final rendering function.
https://docs.influxdata.com/influxdb/
https://docs.influxdata.com/telegraf/
https://blog.52itstyle.vip/archives/2014/