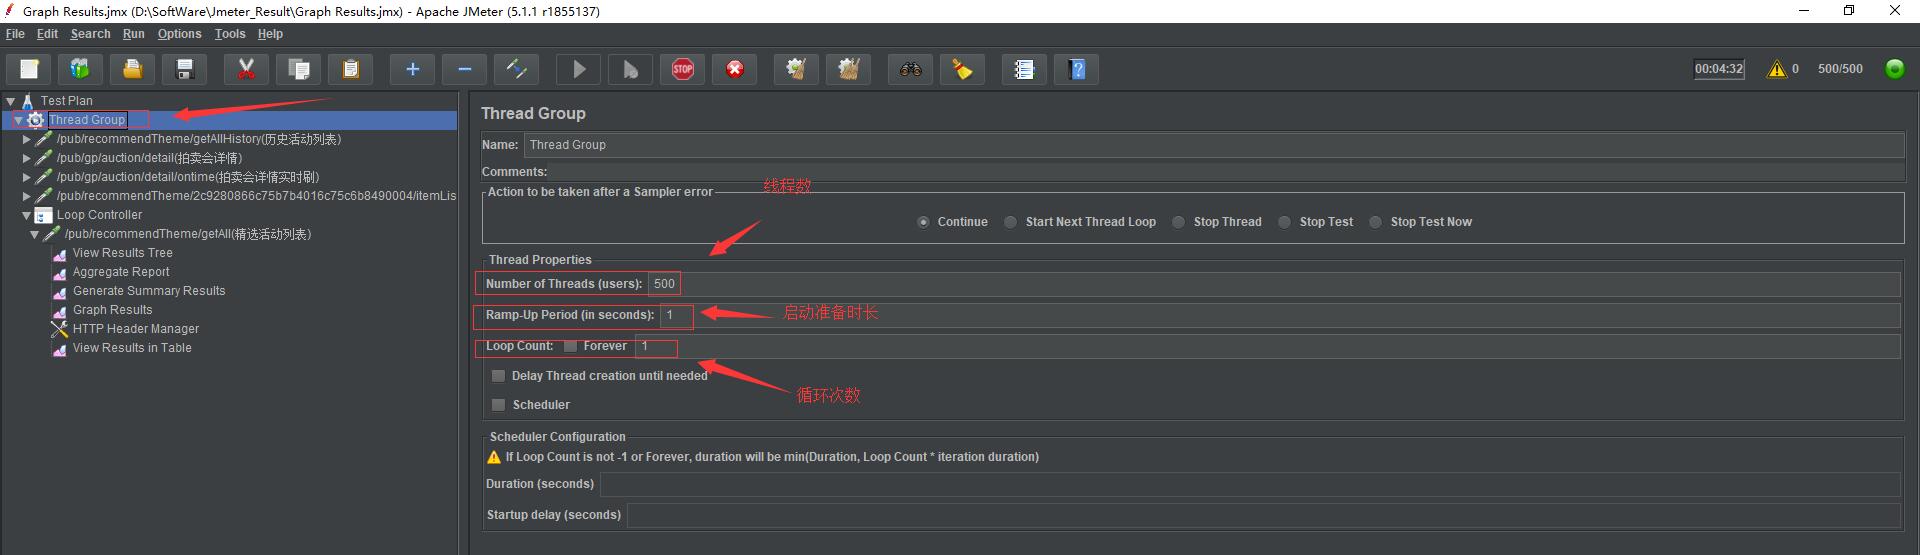
A Thread group
The main thread group consists of three parameters: the number of threads, long (Ramp-Up Period (in seconds)) When ready, the number of cycles.
Threads: the number of virtual users. A virtual user occupies one process or thread. How many virtual users set up where the number of threads is set.
Preparing long (in seconds) when: the number of virtual users to set how long it takes all started. If the number of threads is 20, when the long preparation for the 10, then 10 seconds to start 20 threads. That is to start two threads per second.
Cycles: transmission request times for each thread. If the number of threads 20, 100 cycles, each thread 100 requests the transmission. The total number of requests is 20 * 100 = 2000. If you check the "Always", then all threads will always send a request to opt out of running a script.
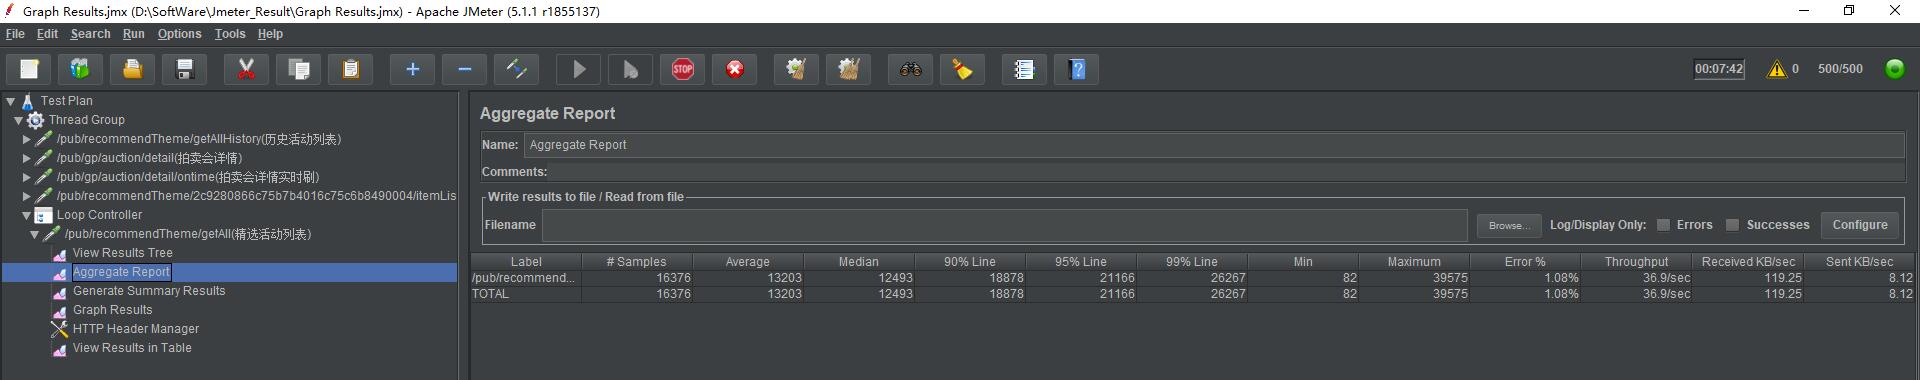
II. The results
Label: JMeter of each element (e.g. HTTP Request) has a Name attribute, shown here is the value of the Name attribute
Samples: this test that you have issued a total number of requests, if simulate 20 users, each iteration 100, this display 2000
Average: Average response time - the default is the average response time of a single Request, the Controller Transaction when used, may be displayed in units of Transaction Average response time
Median: the median, which is 50% of the user response time
90% Line: 90% response time for the user
Note: the meaning of 50% and 90% of the number of concurrent users
Min: minimum response time
Max: Maximum response time
The total number of requested number of errors occurring in this test / request: Error%
Throughput: Throughput - the number of requests represented default completed per second (Request per Second), when using a Transaction Controller, can also represent a similar number of LoadRunner Transaction per Second
KB / Sec: second server receives the amount of data, equivalent to the LoadRunner Throughput / Sec
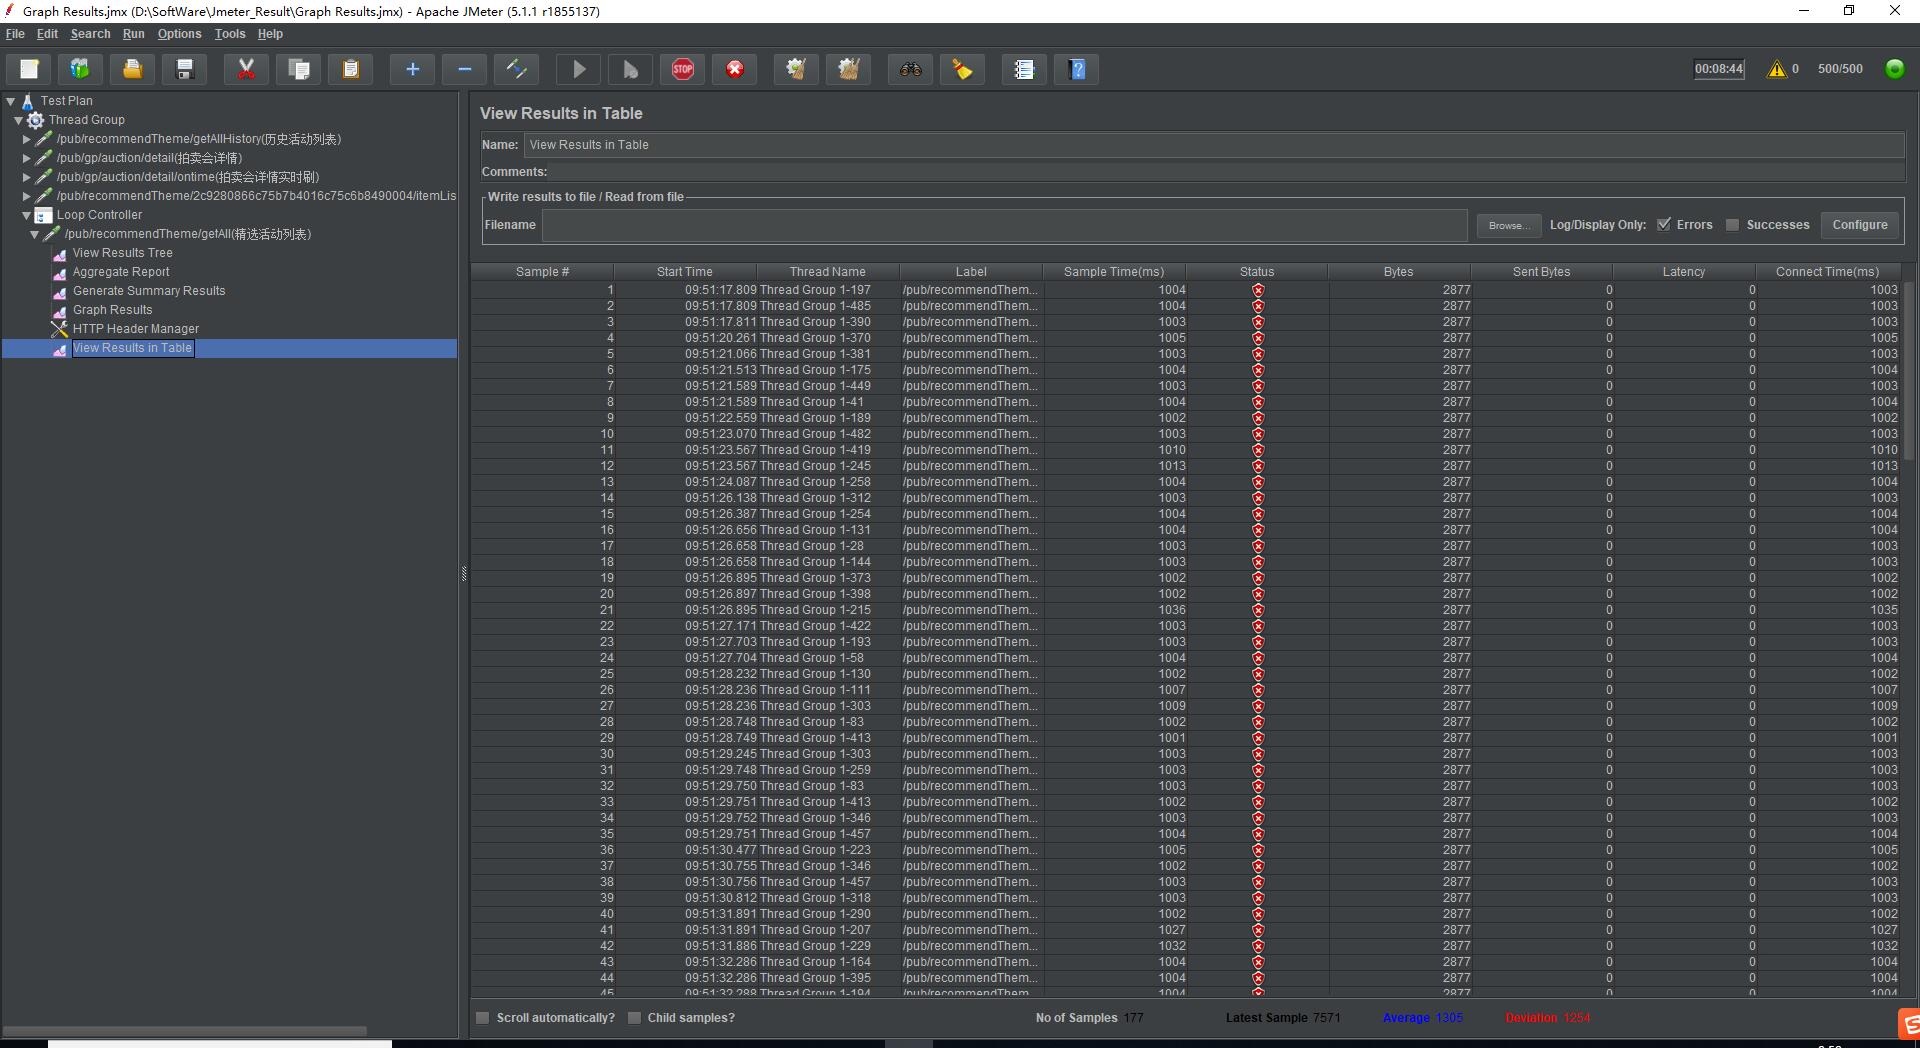
Sample: sequence number for each request
Start Time:每个请求开始时间
Thread Name:每个线程的名称
Label:Http请求名称
Sample Time:每个请求所花时间,单位毫秒
Status:请求状态,如果为勾则表示成功,如果为叉表示失败。
Bytes:请求的字节数
样本数目:也就是上面所说的请求个数,成功的情况下等于你设定的并发数目乘以循环次数
平均:每个线程请求的平均时间
最新样本:表示服务器响应最后一个请求的时间
偏离:服务器响应时间变化、离散程度测量值的大小,或者,换句话说,就是数据的分布