Part 1. Pandas acquaintance
As a data processing tool, Pandas itself integrates Numpy (data calculation processing) and matplotlib (drawing), which is convenient data processing capabilities, easy to read and write files, and support multi-dimensional representation that it is widely used in the data analysis use.
Pandas on a data structure, there are three common forms: DataFrame, Series and Panel. About three data structures on a simple level, it can be understood as: Series represents nearly one-dimensional arrays; DataFrame is close to the two-dimensional data table has an index ranks; Panel data is close to the multi-dimensional representation.
To sum it up: Panel is DataFrame container, DataFrame a Series of container.
Part 2. Pandas learning
About sort of knowledge, I think the chart after finishing do have a level of understanding on the way to more favorable subsequent retrieval and familiar, after all, think of the time with all this knowledge point, you can retrieve. The following inventory conducted by way of the mind map (recently started to explore the usefulness of an excellent mind mapping):
pending upgrade--------
Part 3. Practice makes perfect
Last week on statistical data has a certain code, applications today do a whole on the stock data, combined with a very convenient and practical pandas.DataFrame.details () method, you can easily get a general index.
import pandas_datareader.data as web
import matplotlib.pyplot as plt
import datetime
start = datetime.datetime(2018,3,28) #获取数据的时间段-起始时间
end = datetime.date.today() #获取数据的时间段-结束时间
stock = web.DataReader("BILI", "yahoo", start, end) #获取BILIBILI自2018年3月28日至今的股票数据
stock["Change"]=stock["Close"]-stock["Open"] #统计一天的涨幅
stock_details = stock.describe() #显示一般的统计数据指标
up_days = stock[stock["Change"]>=0].shape[0] #上涨天数
down_days = stock[stock["Change"]<0].shape[0] #下跌天数
print('BILI股票具体数据表格',stock)
print('BILI股票相关统计数据',stock_details)
print('从2018/3/28至今,共上涨:%d 天' %up_days)
print('从2018/3/28至今,共下跌:%d 天' %down_days)
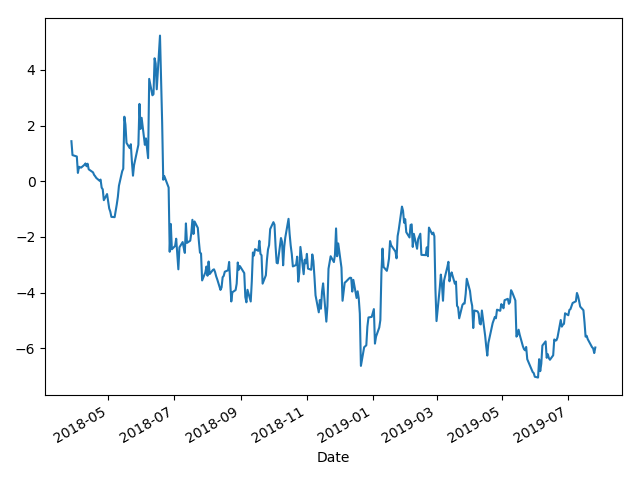
stock["Change"].cumsum().plot() #涨幅连续统计图表
plt.show()By the describe()available methods

After successive gains obtained after the stock market overall simple changes