Today we look at how to monitor our msyql database by TPS and QPS zabbix monitoring, mention these two concepts, we start to understand what is QPS, TPS it? How they calculated it? We look
QPS (Questions Per second :): query processing per second, indicate how many times per second can handle the request, this means that Mysql is the number of queries per second, it applies to both InnoDB engine and MysqlSAM
How to calculate it and calculate the QPS it?
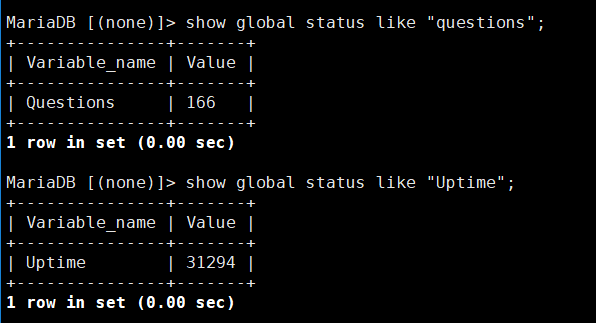
Very simple to obtain the corresponding value of Questions and uptime by "msyqladmin status", can then be obtained by Questions / Uptime
question=mysqladmin status |awk '{print $6}
uptime= mysqladmin status |awk '{print $2}'
QPS=question/uptime

TPS(Transactions Per Second)
The number of transactions per second, simply means that the number of transmission transaction processing database, which is the number of a single database server processing unit time of the transaction. , Transactional storage engines such as InnoDB features such indicators
TPS is calculated based on the sum and dividing com_commit and com_rollback uptim
rollback=mysqladmin extended-status | awk '/\<Com_rollback\>/{print $4}'
commit=mysqladmin extended-status | awk '/\<Com_commit\>/{print $4}'
tps=(com_rollback+com_commit)/uptime
ok ~ know how to calculate after QPS and TPS, will be easier, we will write the script, you can use the shell directly here
# mkdir /usr/local/zabbix/script -p
vim /usr/local/zabbix/script/monitor.sh

#!/bin/bash
#Script time:2018-07-30
#Contact information Email:[email protected]
Uptime=`mysqladmin status | awk '{print $2}'`
QPS() {
 Questions=`mysqladmin status | awk '{print $6}'`
 awk 'BEGIN{printf "%.2f\n",'$Questions'/'$Uptime'}'
}
#TPS
TPS() {
 rollback=`mysqladmin extended-status | awk '/\<Com_rollback\>/{print $4}'`
 commit=`mysqladmin extended-status | awk '/\<Com_commit\>/{print $4}'`
 awk 'BEGIN{printf "%.2f\n",'$(($rollback+$commit))'/'$Uptime'}'
}
$1
# chmod 755 -R /usr/local/zabbix/script/monitor.sh
# vim /usr/local/zabbix/etc/zabbix_agentd.conf.d/performance.conf
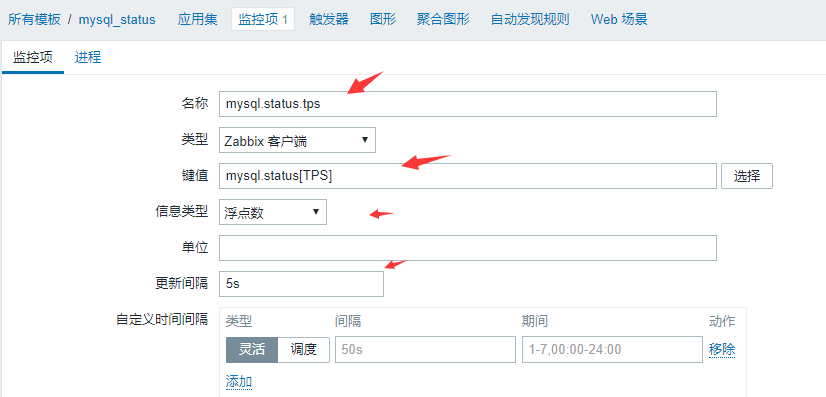
UserParameter=mysql.status[*],/usr/local/zabbix/script/monitor.sh "$1"
# Egrep -v "# | ^ $" /usr/local/zabbix/etc/zabbix_agentd.conf # zabbix-agent configuration is as follows
LogFile=/tmp/zabbix_agentd.log
Server=192.168.2.129
ServerActive=192.168.2.129
Hostname=192.168.2.144
Timeout=8
Include=/usr/local/zabbix/etc/zabbix_agentd.conf.d/performance.conf
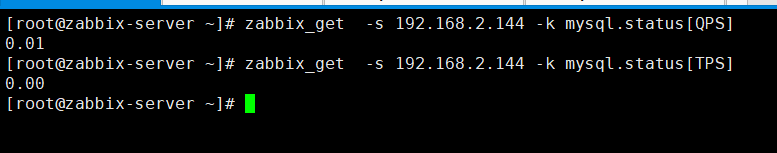
Server-side test: You can get key value
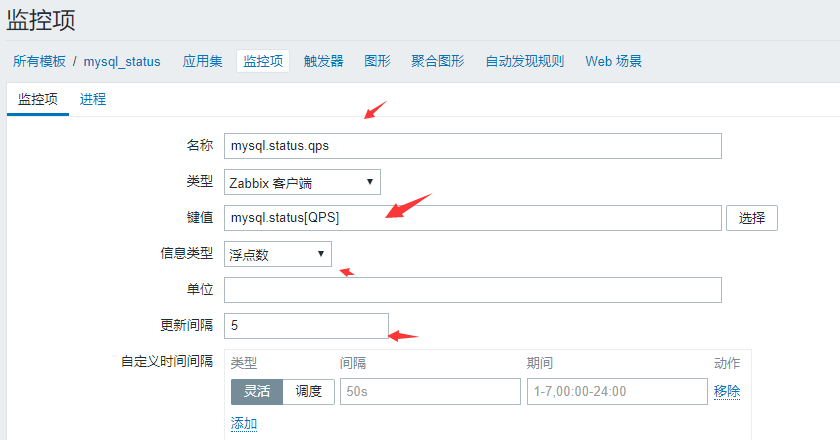
[Add] monitoring items
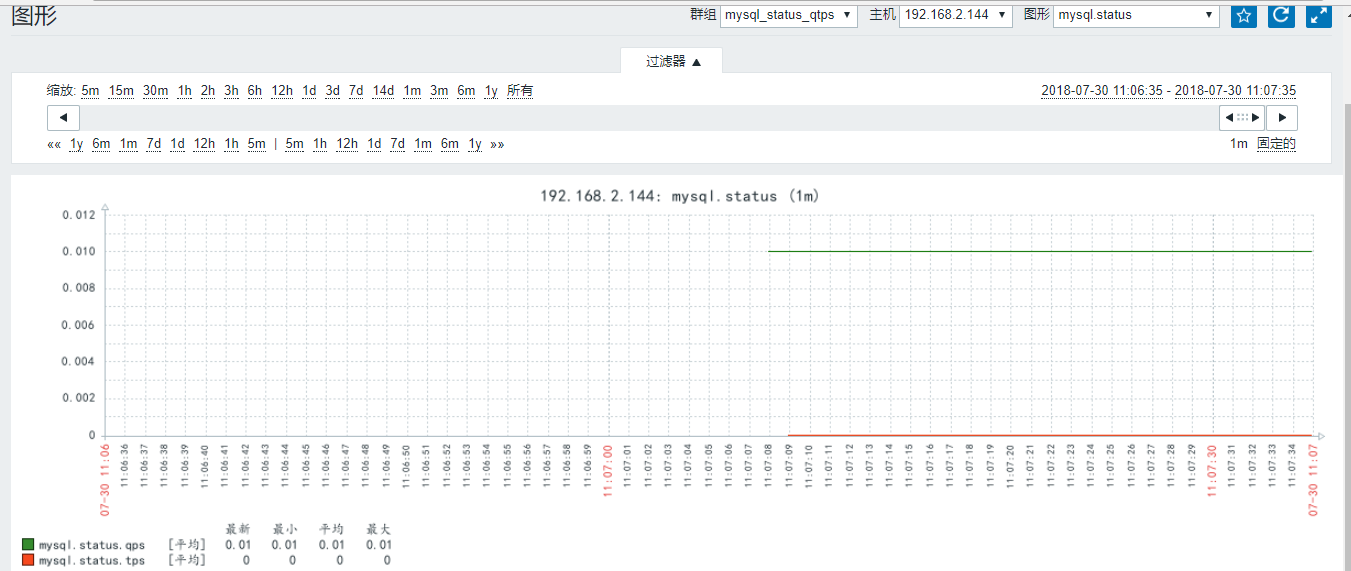
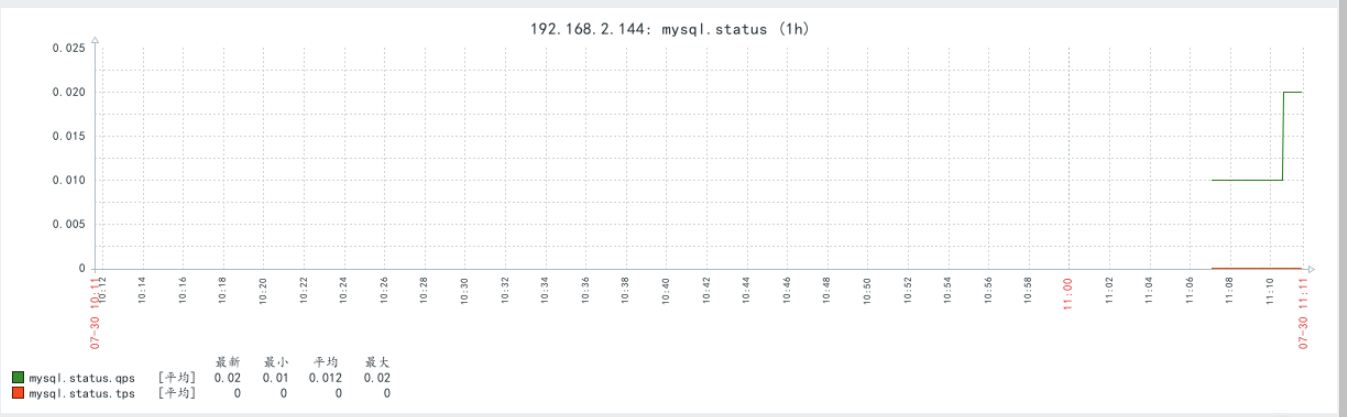
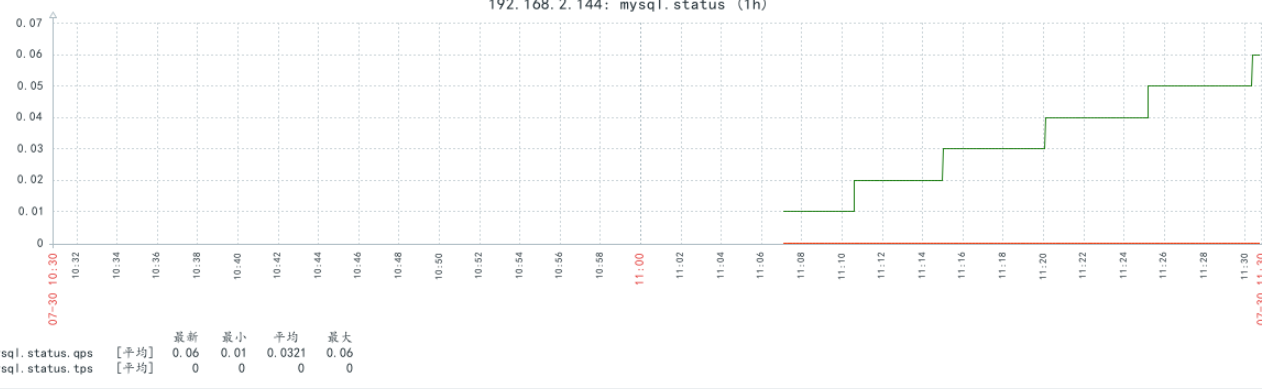
QPS is above the value of monitoring and TPS status, because it is their own tests, not too many queries and transactions transaction volumes, so monitoring is very small
Idea Summary:
1) First, we are not zabbix mysql monitoring these performance indicators, so we want to customize, we want to obtain the value Quetions and uptime calculated by QPS mysql Status, then we obtain the values of the addition commit and rollback in dividing the uptime of the time value, not only can get the number of queries per second, QPS and TPS transaction processing and number
2) definition of the script written in key value (defined in the UserParameter)
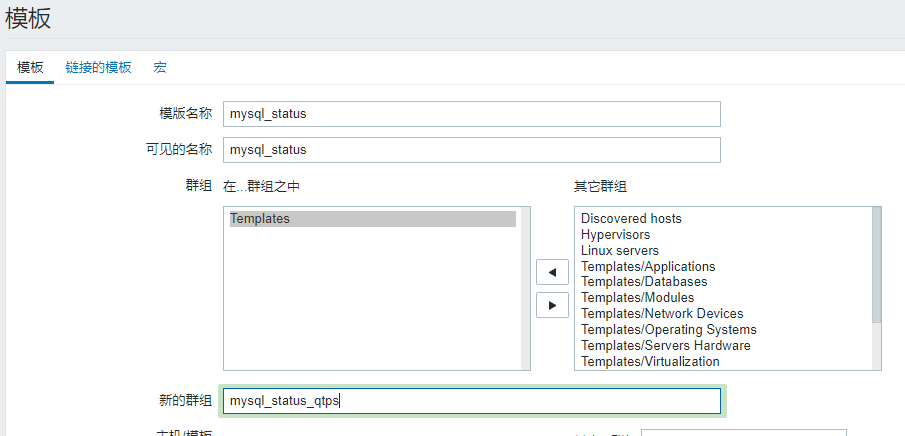
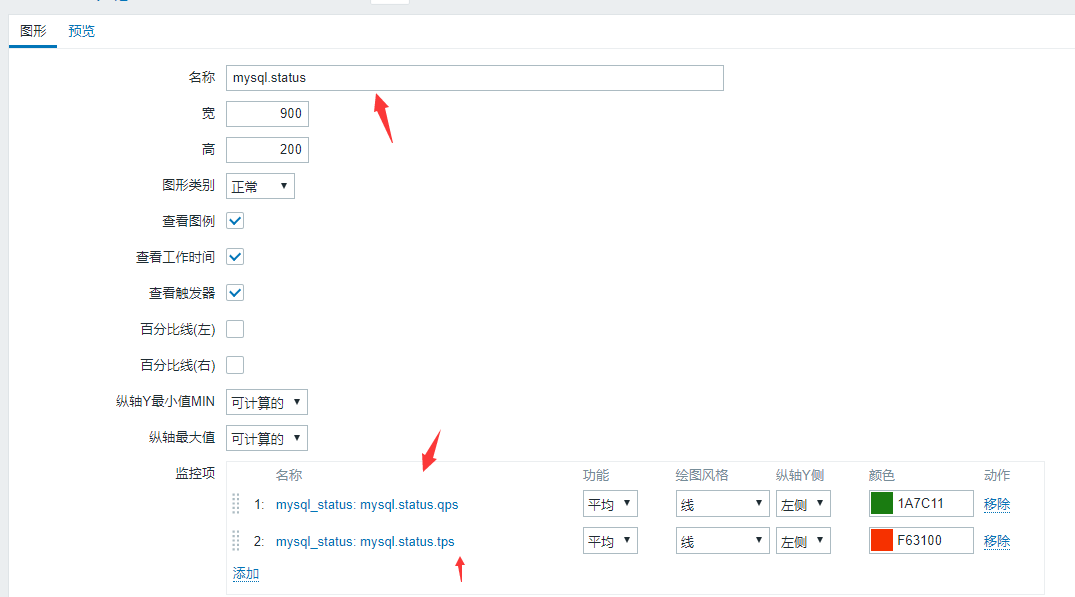
3) Create a template