On one introduces the function pushgateway the pros and cons as well as the deployment of use, this machine a few examples to remind ourselves of how custom monitoring indicators used.
First, the vessel monitoring start time (shell)
Use prometheus been two months, but never find the time to run the container index (there is a similar indicator is the time to create a container). After learning custom monitoring indicators, the first instance it should be to get it.
Prerequisite is deployed pushagateway!
In the monitored machine (linux), create the following script
#! / bin / the bash

allname Docker PS = `--format" .Names {} {} "#` Get the name of the vessel all running

function dockerruntime () {
    T = `Docker Inspect -f '{} {.State.StartedAt } '$ # 1` obtaining start time of each container
    t1 = `date +% s -d " $ t "` # converted into time stamp
    t2 = `date +% s` # obtain the current time timestamp
    let tt = t2-t1 # runtime calculated
    echo $ TT
}

the sudo RM -fa
echo "" "# docker_runtime the TYPE gauge
# time sec docker_runtime the HELP" "" # >> a pushgateway uploaded to the data writing a file

for i in $ { } allname
do
    T $ = `dockerruntime i`
    echo "docker_runtime {name = \" $ I \ "} $ T">> a # formatted data can not be written to use single quotes will block of $ i
DONE

curl --data-binary "@a" HTTP: // pushgatewayIP: 9091 / metrics / the Job / docker_runtime / instance / XA-LSR-billubuntu # modify parameter names and addresses to a specific url number of upload data in a file

sudo rm -fa # empty the temporary files
Add execute permissions to the script, after the execution of landing webUI pushgateway
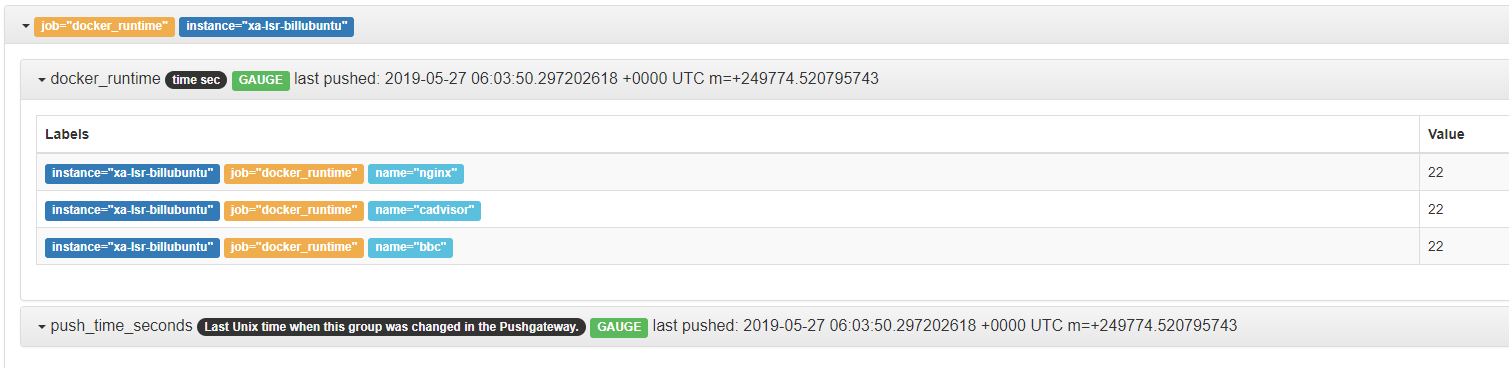
You can see the machine to be monitored pushgateway, PUSH data, meaning the search to three containers on the monitored machine, the name of each job called "docker_runtime"
The script is added periodically scheduled task, once per minute, if there are requirements on time, the script above may be slightly modified, performed once every 15s or 30s.
Now enter the query in the query box prometheus the "docker_runtime" are able to obtain the above data.
【note】
Note that the type of data to upload
If you upload data types are UNTYPE so prometheus will not be recognized, resulting in the pushgateway data can not be accepted! Therefore, special attention needs to format the data sent.
Data types are only four counter gauge summary histogram
Two, python send data to pushgateway
Client installation prometheus
pip install prometheus_client
1, counter type
#counter is growing, restart time will be set to 0, the number for the task, only to rise
# using the flask to build a suggestion page
import prometheus_client
from prometheus_client import Counter
from prometheus_client.core import CollectorRegistry
from flask import Response, Flask
app = Flask(__name__)
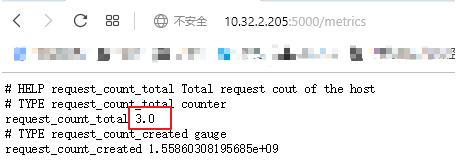
requests_total = Counter("request_count", "Total request cout of the host")
@app.route("/metrics")
def requests_count():
requests_total.inc()
# requests_total.inc(2) 每一次刷新会增加2
return Response(prometheus_client.generate_latest(requests_total),
mimetype="text/plain")
@app.route('/')
def index():
requests_total.inc()
return "Hello World"
if __name__ == "__main__":
app.run(host="0.0.0.0")
result:
2, gauage type
import prometheus_client
from prometheus_client import Counter,Gauge
from prometheus_client.core import CollectorRegistry
from flask import Response, Flask
app = Flask(__name__)
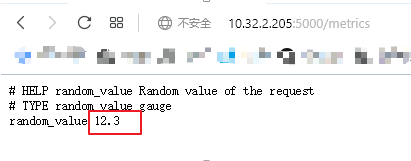
g = Gauge("random_value", "Random value of the request")
@app.route("/metrics")
def s():
with open("a.txt",'r') as f:
num=f.read()
g.set(num)
return Response(prometheus_client.generate_latest(g),
mimetype="text/plain")
@app.route('/')
def index():
requests_total.inc()
return "Hello World"
if __name__ == "__main__":
app.run(host="0.0.0.0")
result:
Send the above effect is to generate a small local website, the next step is the selected data to pushgateway
#在被监控机上写python代码
#CollectorRegistry可以同时注册多个自定义指标并返回给prometheus
importprometheus_client
fromprometheus_clientimportGauge
fromprometheus_client.coreimportCollectorRegistry
importrequests
defv1(): #获取监控数据的值
return2.3
defv2():
return3.60
n1=v1()
n2=v2()
REGISTRY=CollectorRegistry(auto_describe=False)
#自定义指标必须利用CollectorRegistry进行注册,注册后返回给prometheus
#CollectorRegistry必须提供register,一个指标收集器可以注册多个collectoryregistry
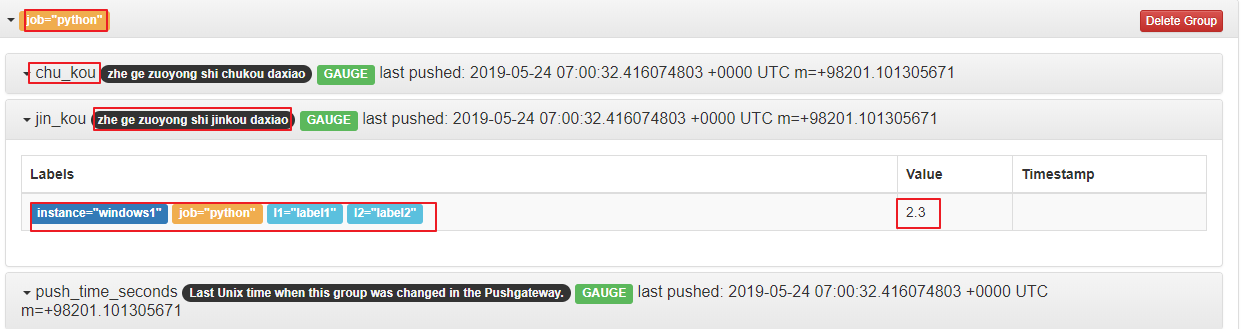
jin=Gauge("jin_kou","zhegezuoyongshijinkoudaxiao",["l1",'l2','instance'],registry=REGISTRY)
chu=Gauge("chu_kou","zhegezuoyongshichukoudaxiao",["l1",'l2','instance'],registry=REGISTRY)
#“jin_kou” 指标名称
# "zhegezuoyongshichukoudaxiao" 指标的注释信息
# "[]" 定义标签的类别及个数
jin.labels(l1="label1",l2="label2",instance="windows1").inc(n1)
chu.labels(l1="label1",l2="label2",instance="windows1").inc(n2)
#“[]”中有几个,就需要写几个个数要完全一致
requests.post("http://pushgatewayIP:9091/metrics/job/python/",data=prometheus_client.generate_latest(REGISTRY))
#向指定的API发送post信息,将注册的信息发过去
#API中的 “python”是 job的名字
结果: