grafana combined prometheus offers a number of templates, although these templates to monitor almost common monitoring indicators, but some special indicators failed to provide (may be I did not find the index name). Affected zabbix of naturally think of a custom monitor items, promethues also supported.
I. Introduction
Pushgateway prometheus is an important component, with which components may be implemented automatically monitoring index, from the literal meaning, the member will not push to prometheus data, but external push to collect the intermediate data as an index of a component, will periodically prometheus pull data from the pushgateway.
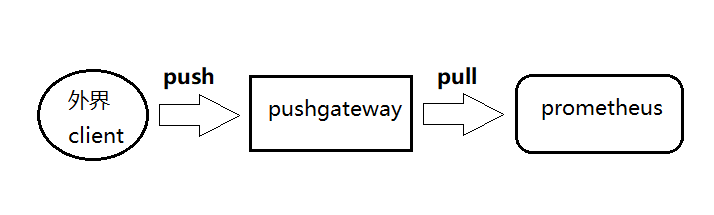
pushgateway of Prometheus will not pull into a push, it just allows the user to push his index information and records. And not all of user data during a time from pushgateway Prometheus push pull up, but the last push data onto the client side. Thus the client side to be set to push data pushgateway end prometheus less time to pull the time data, so that data can be guaranteed prometheus date.
[Note] If the client has not been pushed to new indicators pushgateway, then Prometheus acquired data is the last push of client data until indicators disappear (default 5 minutes).
Prometheus itself is not stored in the index, but sent the case to prevent unexpected restart of pushgateway, abnormal work, allowing pushgateway at the temporary index, parameter --persistence.interval = 5m, the default save five minutes, five minutes later, local stored index will be deleted.
The reason for using the pushgateway:
. 1, prometheus defaults pull mode, since the problem is not a network or a firewall, can not lead to pull data prometheus each node.
2, monitor business data, different data needs to be aggregated and unified collected by prometheus
pushgateway defects:
1, aggregate data from multiple nodes to pushgateway, when it goes down great impact
2, pushgateway can continue to push all of the monitoring data, even if the monitor has been off the assembly line, will get old monitoring data. Need to manually clean up unwanted data
3, after the restart data loss
Second, start
1, docker start pushgateway
need to log dockerhub
Docker user name and password to enter the Login
  docker pull prom/pushgateway
  docker run -d --name pushgateway -p 9091:9091 --restart=always prom/pushgateway
2, 9091 Access Port (http: // pushgatewayIP: 9091)
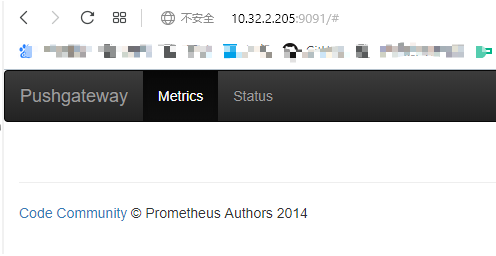
Pushgateway proved successful deployment
3, the added pushgateway node prometheus
Open prometheus profile
- job_name: 'pushgateway'
  static_configs:
  - targets: ['pushgatewayIP:9091']
  honor_labels: true        #作用:如果没有设置instance标签,Prometheus服务器也会附加标签,否则instance标签值会为空
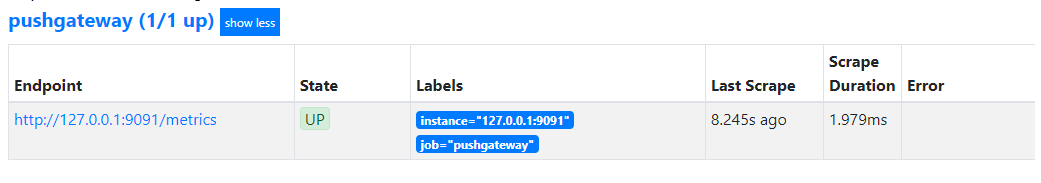
重启prometheus后,登陆web UI,查看prometheus的targets
4、测试
向pushgateway发送数据
	echo "test 123" | curl --data-binary @- http://pushgatewayIP:9091/metrics/job/test
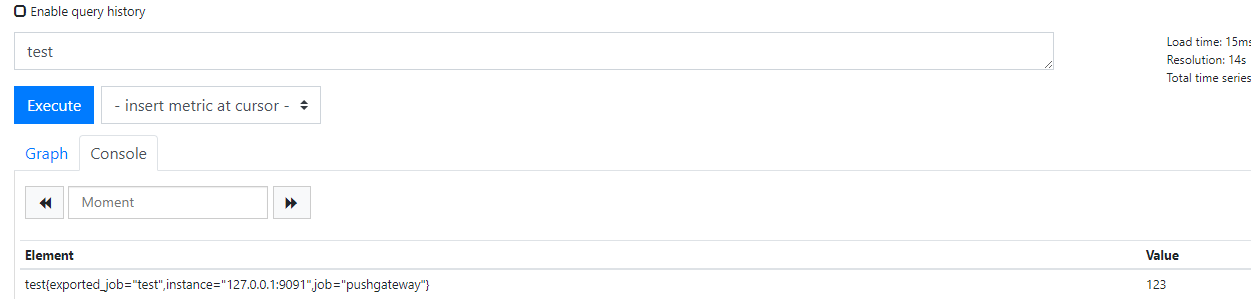
上述测试的目的是,在被监控的机器上,想pushgateway发送了一条数据,内容是“test 123”,指标名称是“test”,指标值是“123”;
http://pushgatewayIP:9091/metrics/job/test,此次也声名了,在pushgateway处建立一个job为test的指标。
推送的API路径
	所有的推送都是通过HTTP完成的,API路径如下:
	/metrics/job/<JOBNAME>{/<LABEL_NAME>/<LABEL_VALUE>}
	JOBNAME:job标签的值
        / 是转义符
登陆prometheus webUI查询指标是否生成
三、pushgateway发送数据的API格式
API格式:
http://pustgatewayIP/metrices/job/job名/标签名/标签值(一般 标签名 采用 instance)
例子:
http://pustgatewayIP/metrics/job/
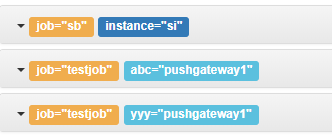
/sb/instance/si
/testjob/abc/pushgateway1
/testjob/yyy/pushgateway1
分别触发上述三个API,打开pushgateway的web UI
四、发送的数据类型
1、发送counter类型
可以一次发送单个,也可以发送多个数据
cat <<EOF | curl --data-binary @- http://pushgatewayIP:9091/metrics/job/docker_runtime/instance/xa-lsr-billubuntu
    # TYPE docker_runtime counter
	docker_runtime{name="cadvisor"} 33
	docker_runtime{name="nginx"} 331
	docker_runtime{name="abc"} 332
EOF
2、发送gauage类型
可以一次发送单个,也可以发送多个数据
cat <<EOF | curl --data-binary @- http://pushgatewayIP:9091/metrics/job/docker_runtime/instance/xa-lsr-billubuntu
    # TYPE docker_runtime gauge
    # HELP docker_runtime time sec
    docker_runtime{name="nginx"} 22
   docker_runtime{name="cadvisor"} 22
   docker_runtime{name="bbc"} 22
EOF
3、curl的另一种发送形式
--data-binary <data> 与-d, --data类似,如果以@开头,则后面必须跟着文件名,并且文件中的换行符,回车符会保留,也不会做
将要发送的数据写入文件“a”,作用是将文件中的数据发送到指定地方
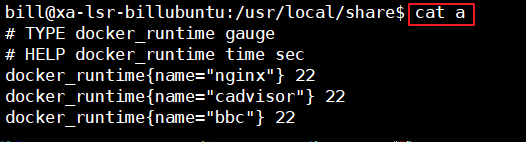
curl --data-binary "@a" http://pushgatewayIP:9091/metrics/job/docker_runtime/instance/xa-lsr-billubuntu