What is Prometheus?
Prometheus is a monitoring system SoundCloud open source, open-source version of Google BorgMon monitoring system. With the rise of container and Kubernetes technology, Prometheus more and more people's attention.
Whether it is the traditional data center or cloud data center, whether it is physical machines, virtual machines or containers, construction of the entire data center monitoring are not open around the topic. Good monitoring system requires not only compatible with various devices and environments, but also requires high performance, high reliability and ease of operation and maintenance and other characteristics, Prometheus is one of them. With the rise of container-related technologies, Prometheus is gradually becoming the standard vessel monitoring, and for legacy applications and devices also have good compatibility.
Prometheus has GO written language is made using Pull way to obtain monitoring information, and provides multi-dimensional data model and flexible query interface. Prometheus not only by static configuration file monitoring objects, also supports auto-discovery mechanism, monitored object can be obtained through a variety of ways Kubernetes, Consul, DNS and other dynamic. In terms of data collection, with the Go language of high concurrency, Prometheus can be stand-alone monitoring data collected hundreds of nodes; in data storage, with the timing to optimize local database, single Prometheus can collect ten million index per second , if you need to store large amounts of historical monitoring data, it also supports remote storage.
Prometheus ecosystem component architecture:
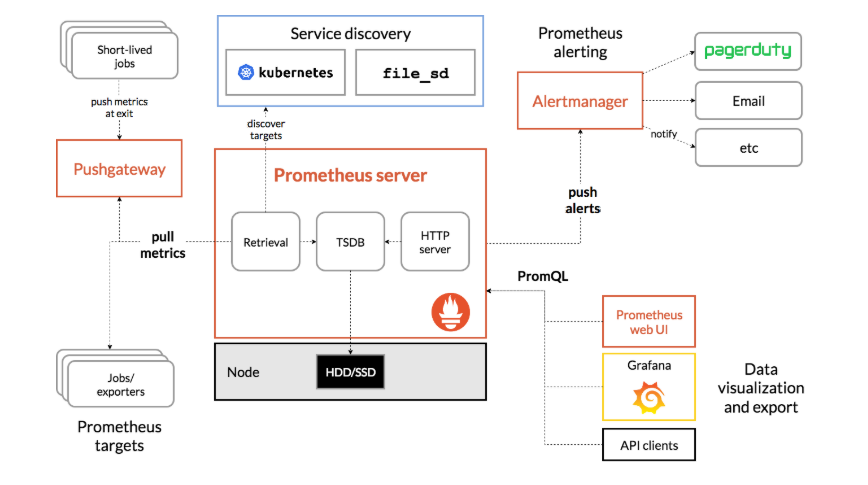
Prometheus Server is responsible for the timing crawl Metrics data on the target, the target needs to be exposed each grab an HTTP service interface for Prometheus regular crawl. This call is monitored objects acquired monitoring data approach is called Pull. Pull Prometheus unique way reflects the design philosophy and in most cases, a different monitoring system Push mode.
However, some existing systems is achieved by push manner, access to the system, Prometheus PushGateway provide support for these systems to PushGateway active push metrics, and just the timing to fetch data Prometheus on Gateway.
AlertManager is a component independent of Prometheus, after triggering a high-level rules set in advance in the Prometheus, Prometheus will push the alarm information to AlertManager.
Prometheus supports two types of storage:
- One is local storage. Prometheus comes through timing database to save data to a local disk, for performance reasons, it is recommended to use SSD. But local storage capacity is limited, it is recommended not to save more than a month of data.
- The other is a remote storage for storing large amounts of surveillance data. By conversion adapter intermediate layer, Prometheus currently supporting OpenTSDB, InfluxDB, Elasticsearch back-end storage for remote write remote read and stored by the adapter, Prometheus interfaces, they can access remote storage used as Prometheus.
Reproduced in: https: //www.cnblogs.com/weidongliu/p/11021622.html