Think about it, write their own program does not tune, that's too bad it
Themselves when Windows programming interface of the modal get it working, but also to do modal command line? Trust me. Linuxgdb debugging than you think much more fun! ! ! !
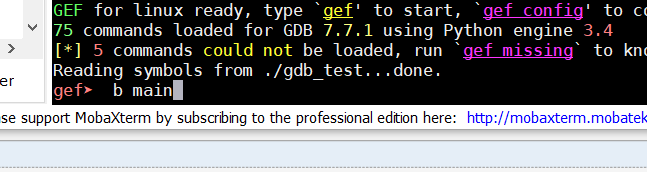
In Linux, gdb debugging is very powerful. Here you can install a small plug-in: wget -q -O- https://github.com/hugsy/gef/raw/master/scripts/gef.sh | sh
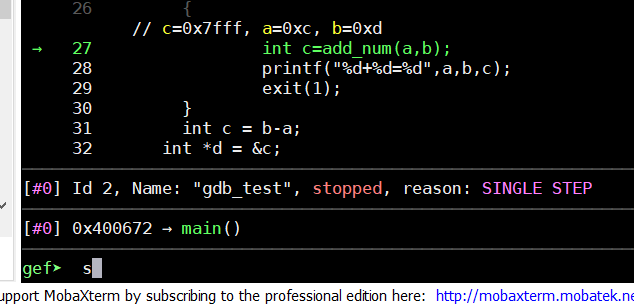
#include<stdio.h>
#include<stdlib.h>

int add_num(int a,int b)
{
    printf("this is a test!");
    return a+b;

}


int main(int args,char*argv[])
{
    int a=12,b=13;
    pid_t pid;
    pid = fork();
    if(pid<0)
    {
        perror("fork");
        exit(1);
    }
    if(pid==0)
    {
        int c=add_num(a,b);
        print("%d+%d=%d",a,b,c);
        exit(1);
    }
    int c = b-a;
     int *d = &c;
     print("%d-%d=%d",b,a,*d);
     return 0;
}
Here fork () is to create a child process. Insert it: the child and the parent have the same code segment. That is, there will be two processes to perform the same piece of code. However, the child process ID pid is 0 in this program. While the parent process pid is greater than zero. This can be distinguished. pid == 0 is executed child process, the child process calling a function exits. The parent process will perform the last few lines of code.
Start gdb by gdb ./gdb_test
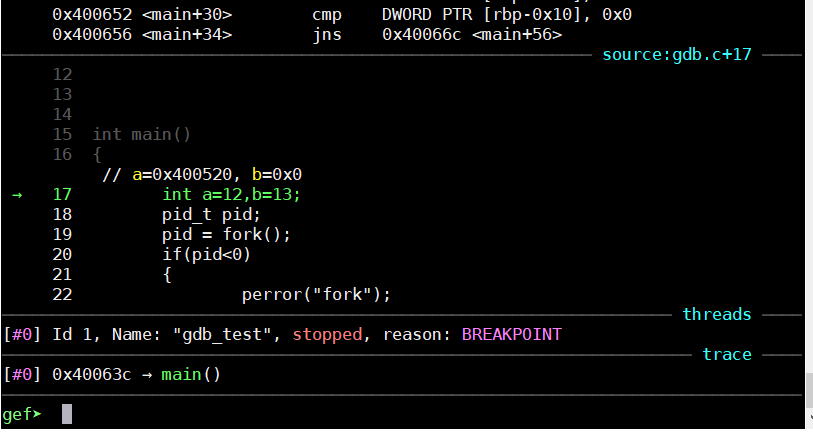
1. b b breakpoint is marked with the number of lines of code or function name to view b breakpoint information: info breakpoints cancel a breakpoint: delete breakpoint numbers
1 l look at the code usage is the same as with b

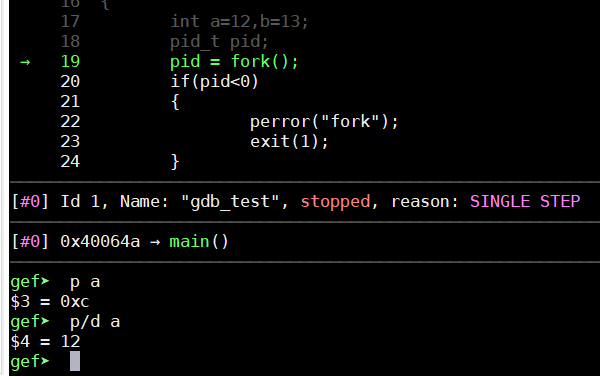
3. Run: r the next line: n
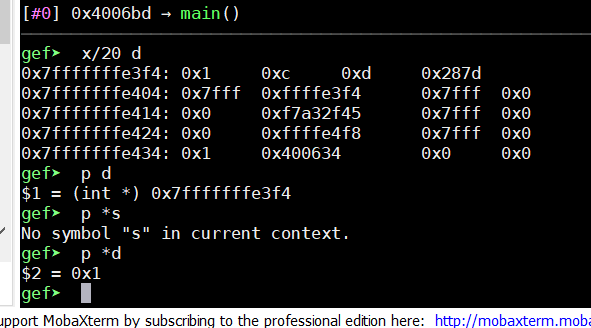
4. Check the value of variables: p / d is a decimal
The multi-process multi-threaded debugging: As the child process and the parent process different code execution. First choose to follow the child process: set follow-fork-mode child to see there are several processes: info inferiors can attach process with the process ID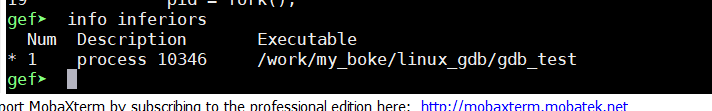
6. Enter function: s function quickly: finish
7. View stack space: bt
8. Review the heap: heap
9. Check Address: x / 20 is the view 20
A little gdb basis, hoping to help. .