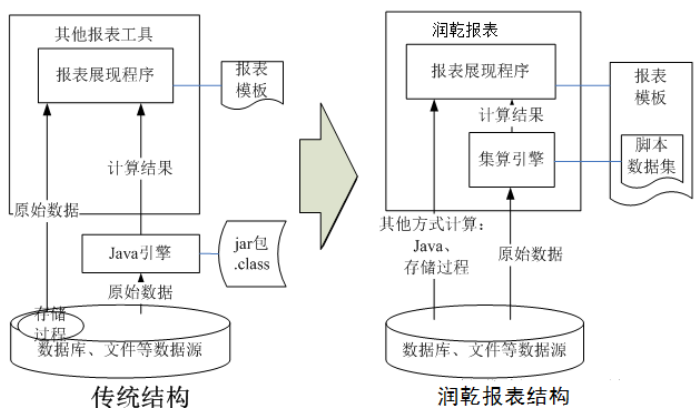
In the report project, often somewhat complex data is calculated using a special report, and other reports with less. Typically, such calculations can be implemented in SQL statements using the data source, but because SQL can not be calculated step by step, you need to write a very long statement intricacies, it is not conducive to debug and maintain, and therefore also the use of Java or stored procedures to achieve. But in that case, the program will calculate and report templates separately, is not conducive to organizational management.
Run Dry dataset using a script report (implemented in conjunction operator set) report to achieve special-purpose computing, is an effective means to solve this dilemma, one can write either stepwise straightforward calculation script, on the other hand can will be stored together scripts and report templates, which will help management.
System Structure comparison of these two methods shown below:
A concrete example of the report look at the usage report scripts run dry by the data set.
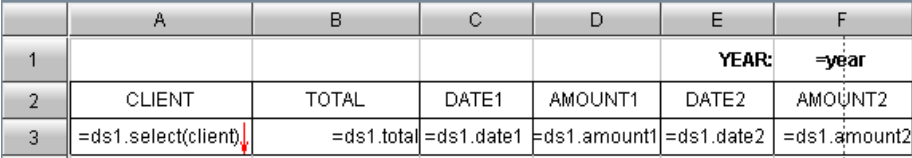
The following table is a "annual customer sales analysis reports," which called the year can be selected as an input parameter:
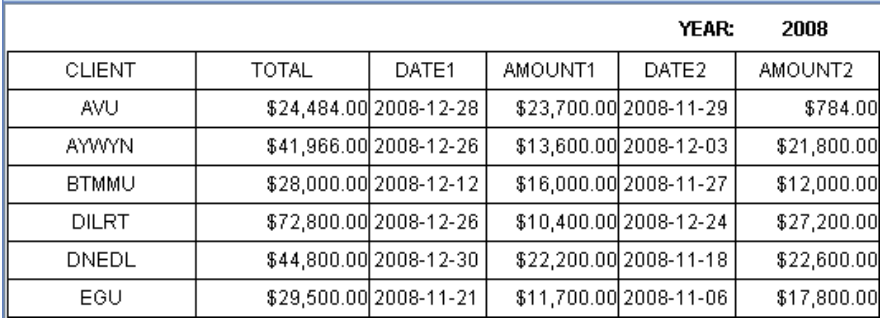
Which, CLIENT is a client, TOTAL is total customer sales, DATE1 last customer sales date, AMOUNT1 last customer sales amount, DATE2 customers penultimate date of sale, AMOUNT2 customers penultimate date of sale.
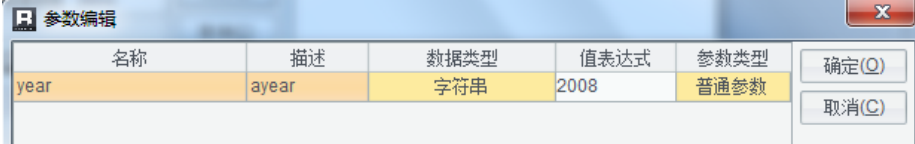
1. Define report parameters
Run Dry statements after New report templates to define report parameters:
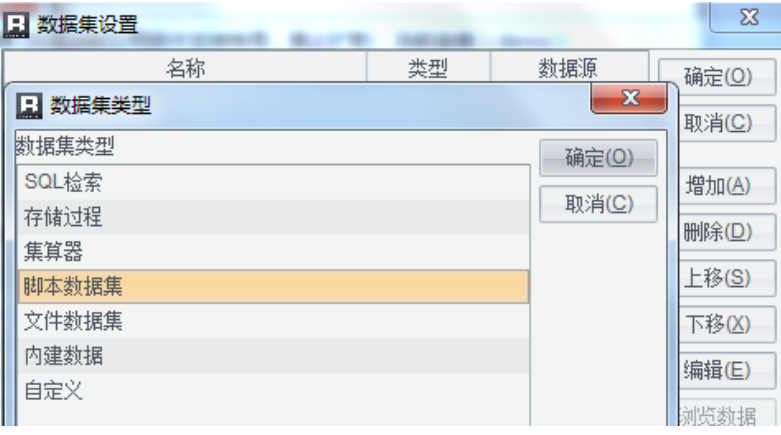
2, data collection configuration script
A script that defines the data set as follows:
Scripts written in the data set as follows:
| A | B | |
|---|---|---|
| 1 | =create(client,total,date1,amount1,date2,amount2) | |
| 2 | =demo.query(“select * from sales where year(ORDERDATE)=”+year) | |
| 3 | =A2.group(CLIENT) | |
| 4 | for A3 | |
| 5 | > = A4.m customer (1) .CLIENT | |
| 6 | >total=A4.sum(AMOUNT) | |
| 7 | =A4.sort(ORDERDATE:-1) | |
| 8 | >date1=B6.m(1).ORDERDATE | |
| 9 | >amount1=B6.m(1).AMOUNT | |
| 10 | >date2=B6.m(2).ORDERDATE | |
| 11 | >amount2=B6.m(2).AMOUNT | |
| 12 | result A1 |
Code Description:
A1: Create an empty sequence tables prepared for the result data.
A2: a data source demo use report sales data taken with a simple sql, year report parameter.
A3: sales data grouped by CLIENT.
A4: Start loop processing packet data.
B4: -B11: request result data, A1 is inserted, not described in detail herein.
A12: A1 returns the resulting data to the report.
3, report design
Back to the Report Designer main interface, report design in the following figure:
Save as salary.rpx can. You can see the report design, calculation scripts are written in the same rpx file management easier.
Details link: http://c.raqsoft.com.cn/article/1555378552869?r= bubblegum