![]()
Author: Tang Kai
Data processing diagnostic dial
Log service processing functions operating status can be viewed via the dashboard, the entrance is the "rule Insight" button processing list page:

Click the change button to jump to the dashboard and to be respectively in accordance with the job name, instance ID, source LogStore status screen for other tasks. See for example, FIG default current instance ID (90c9d47714dbb807d47c13b819d3e7df) operations:

Note : preview job status data is not included in this report.
Overview Index

- Total Number of read log: LogStore each shard read from the source to the total number of log
- Total delivery of logs: read from the source LogStore each shard to log and successfully delivered to LogStore total number of log pieces of target
- Total number of failed log: LogStore each shard read from the source to the log and log the number of failures occurring in the article during processing Total
- Delivery of logs accounted for: the number of log pieces successfully delivered to the target LogStore source LogStore read proportion to the number of logs
Processing rate index

Statistical per minute within the window, the number of data processing logs, comprising four indicators:
- accept: Article number read from the source log LogStore
- dropped: read the expected number of discarded codes press the log from a source LogStore
- delivered: read from the source LogStore and successfully delivered LogStore number of log pieces of target
- failed: LogStore each shard read from the source to the log and the number of failed log occurred during processing
Consumer delay rate index

Per minute window within statistical processing task to read the source LogStore each Shard indicators:
- Consumer delay: the current time - the Shard has recently completed a log of time (log write log service time, level Server Arrived Time)
- Consumption Rate: Shard per minute window in which to read the number of log
Note : when dealing with real-time (latest) Log Consumer delay is generally about 1s; if the processing time is a historical log data, the consumption stage in the mission start delay may be high, and carry on with this data processing, consumption continues to progress catch up and ultimately achieve low latency levels.
Indicators active Shard

Shows the number of log lines Shard grade processed per second occurring in the most recent period, (accept, dropped, delivered, failed).
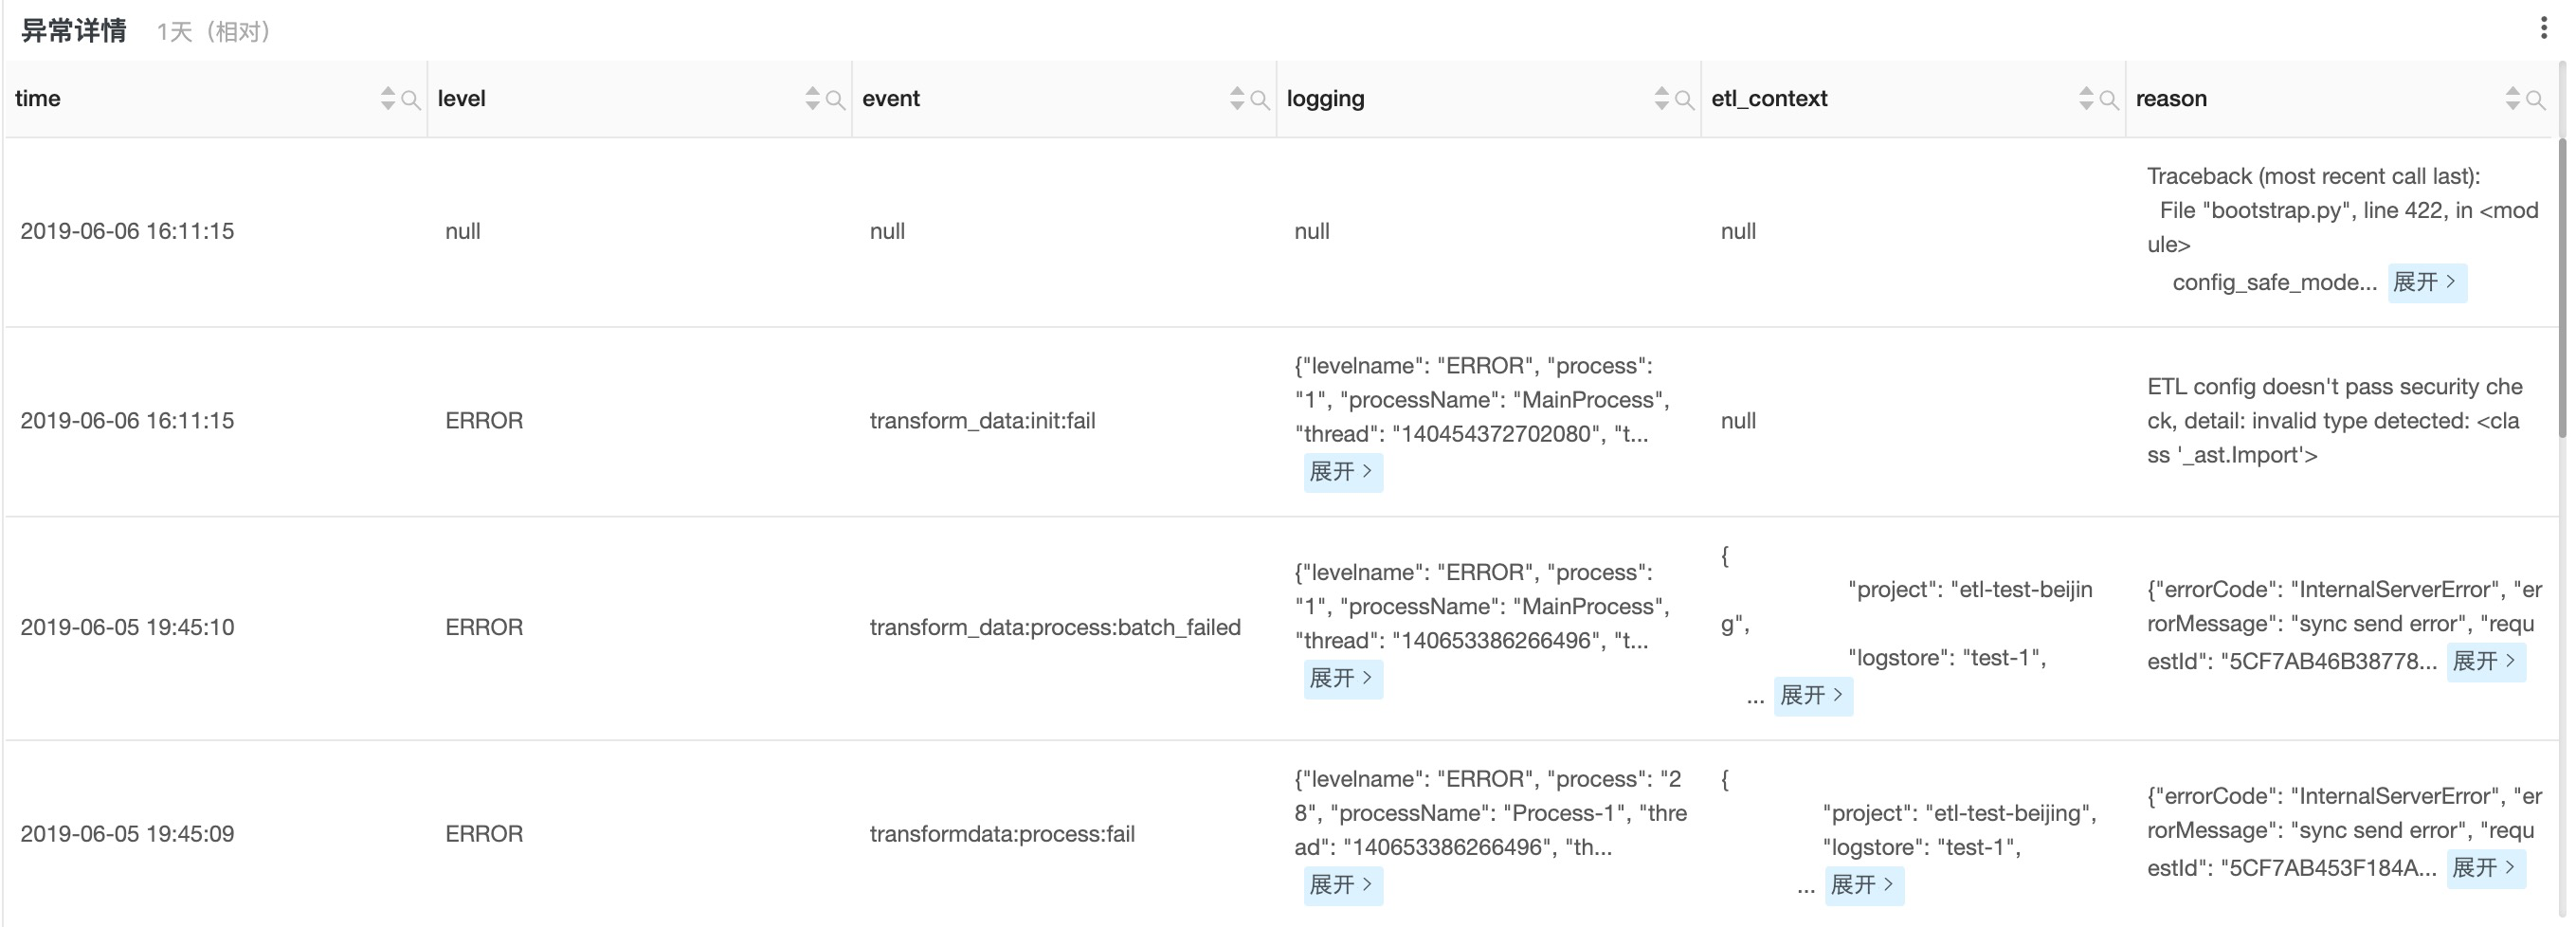
Abnormal details

You can reason field, see the problem could lead to code error. You can also go deep into the current Project of internal-etl-log LogStore (free to use):

By keywords ERROR or WARNING view the full code execution error log.
If the problem persists, this may provide partial information contact log service support.
With further reference
Welcome scan code to join the official nail group (11,775,223) directly support real-time updates in a timely manner and Ali cloud engineers: 